


By Joseph D’Aleo
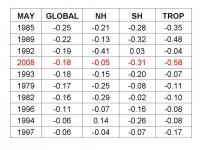
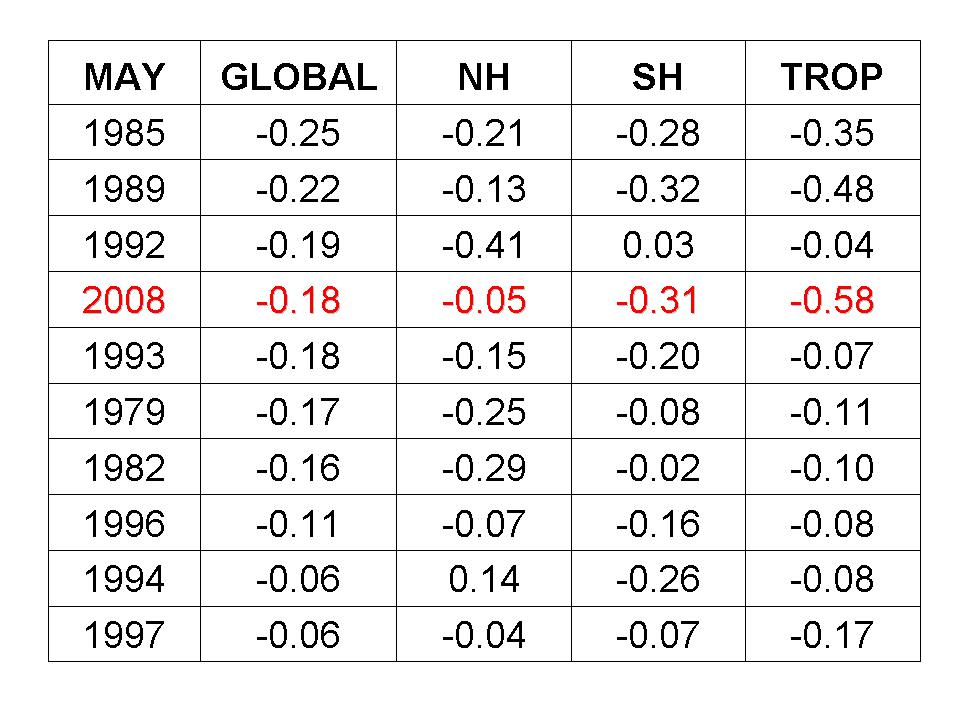
The University of Alabama MSU lower tropospheric data just released showed this May was the 4th coldest May for the globe since that record began in 1979. It was also below the average for both hemispheres. It trailed only 1985, a weak El Nino at the tail end of the El Chichon cold period, 1989, a summer following a strong La Nina, and 1992, the year after Pinatubo. It was just 0.003 colder than 1993, another Pinatubo affected year that ranked 5th.
This year is coming off a strong La Nina and a cold Pacific (negative PDO). Satellite monitoring began in 1979. Had it been available before the Great Pacific Climate Shift, you would find more such cold May years.
See larger table here
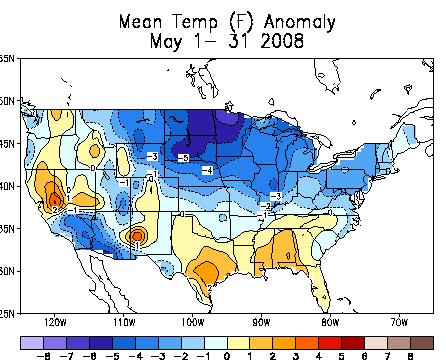
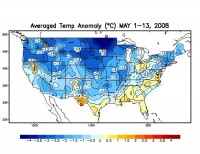
For more than 75% of the nation, according to the CDC, May was cooler than normal, as much as 7.5F below in the far North Central.

See larger map here
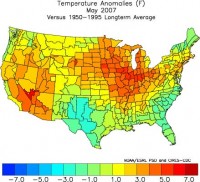
This is in sharp contrast to May 2007 which was warm in the same areas it was cold this year. May 2007 was the 11th warmest May for the US.
See larger map here
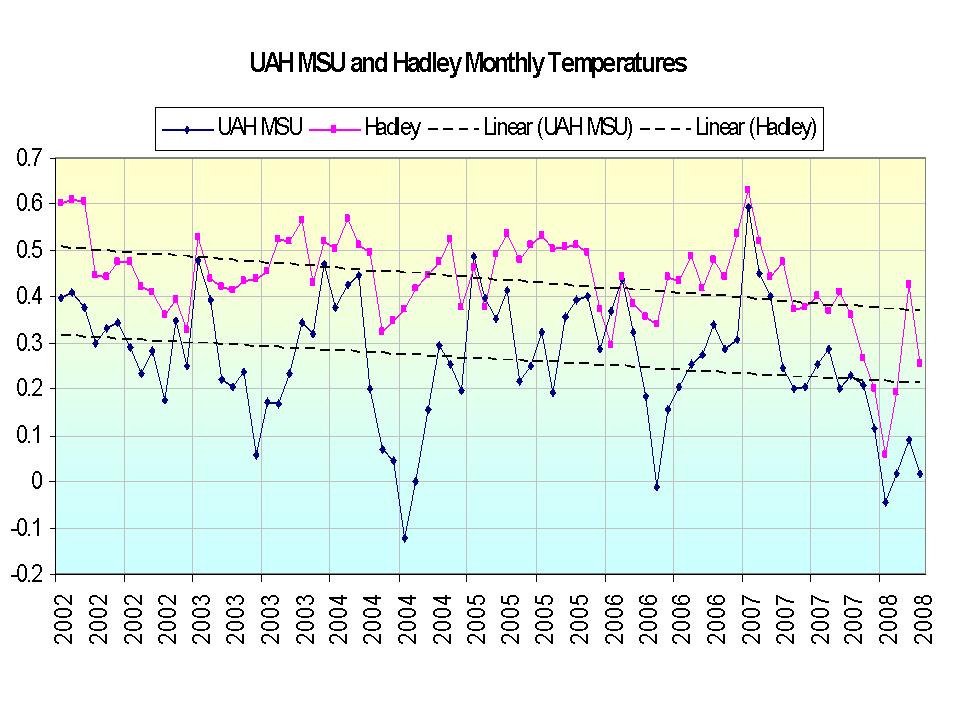
That continues the downslide we have seen starting in 2002 which accelerated the last year with the Pacific cooling and La Nina.
See the larger image here.
The next week will see a sudden arrival of summer temperatures in the east and central United States as the Madden Julian Oscillation (MJO) is in a location that favors a western North American trough and the building of a southeast and south central ridge. After mid-month, the MJO should advance to a spot favoring the trough coming east and the ridge backing up to the south central and Rockies/Intermountain. The heat will retreat west gain and more normal June readings will return to the east.
Mark Henderson, Science Editor, Copenhagen, Times Online
Malnutrition should be the world’s major priority for aid and development, a panel of eight leading economists, including five Nobel laureates, declared yesterday. The provision of supplements of vitamin A and zinc to children in developing countries, to prevent avoidable deficiencies that affect hundreds of millions of children, is the most cost-effective way of making the world a better place, the Copenhagen Consensus initiative has found.
Three other strategies for improving diets in poor nations were also named among the top six of 30 challenges assessed by the project, which aims to prioritise solutions to the world’s many problems according to their costs and benefits. Efforts to control global warming by cutting greenhouse gas emissions, however, were rated at the bottom of the league table, as the economists considered the high costs of such action were not justified by the payoffs. Research into new low-carbon technologies, such as solar and nuclear fusion power, was ranked as more worthwhile, in 14th place.
The previous Copenhagen Consensus, held in 2004, also listed global warming as its lowest priority. The exercise was organised by Bjorn Lomborg, the controversial Danish statistician who has long argued that though climate change is real, current approaches to fighting it offer poor value for money. Dr Lomborg said: “This gives us the ultimate overview of how global decisions can best be made and how we can best spend money to do good in the world. Prioritising is hard. It’s much easier to say we want to do everything, but unfortunately we have limited resources. We don’t just focus on what’s fashionable, but also on what’s rational.”

See the rankings of the 30 major programs here. See the Times story here.
By Joseph D’Aleo, CCM
For more than 75% of the nation, May was cooler than normal, as much as 7.5F below in the far North Central.
See larger map here
This is in sharp contrast to May 2007 which was warm in the same areas it was cold this year. May 2007 was the 11th warmest May for the US.
See larger map here
We will see in a few days where this May ranks. Clearly it will be colder than normal. UAH MSU daily data suggest a colder than average May for the globe too. That continues the downslide we have seen starting in 2002 which accelerated the last year with the Pacific cooling and La Nina. Meanwhile Antarctic ice remains at 1 million square kilometers ahead of last year at this time and ahead of the average since 1979. If it stays at this anomaly, we will surpass the record set late last winter there. The arctic ice is similar to late May at this time after recovering nicely this past winter from record low levels in September and October. Only time will tell whether the same flow patterns will develop in June that developed last year to rapidly diminish the ice. See more here.
By Steve McIntyre on Climate Audit
Thompson et al 2008, writing in Nature, assure their readers, the data before ~1940 and after the mid-1960s are not expected to require further corrections for changes from uninsulated bucket to engine room intake measurements. Is there a shred of evidence to support this assertion? There is convincing evidence otherwise - evidence already reported here. While Thompson et al do confirm some Climate Audit observations, on essential points, their analysis is actually a step backwards from my 2007 posts (one here).
The hypothesis of the original Hadley Center Windowed Marine De-trending program was that there was an approximate 0.3 deg C inhomogeneity between engine inlet SST measurements and canvas bucket measurements and that there was a drop-dead changeover on December 1941, a switch which continued in place to the present day.
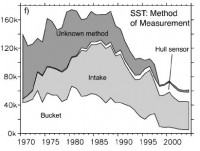
In earlier posts, I showed that there was strong documentary evidence against this assumption and hypothesized that there was a return to “business as usual” after the war. On the post-1960s period, they have completely lost their bearings and are, so to speak, lost at sea. Thompson et al 2008 completely failed to discuss or cite the most relevant graphic in Kent et al - a graphic previously reproduced at Climate Audit on a number of occasions - and reproduced one more time below. This graphic, based on a very comprehensive examination of metadata, showed the distribution of measurement type from 1970 to 2006.
See full size image
In 1970, as I observed last year, about 90% (this is a visual estimate from the graphic) of SST measurements, for which the type is known, were done by buckets. Because the proportion with metadata is a very large sample, it’s plausible to use this 90% estimate for the entire population, including the unknown population. Between 1970 and 2006, the proportion of bucket and engine inlet measurements is more or less reversed, with about 90% of SST measurements in the 2000s being engine inlet or hull sensor, the latter by the way, being a further addition to the witches’ brew that the Nature boys didn’t mention at all. However, Thompson et al 2008 completely failed to grasp the significance of this graphic. The changeover to engine inlet measurements, previously attributed to a drop-dead date in 1941, actually took place after 1970 (providing, of course, for a one-off WW2 adjustment ending in 1945).
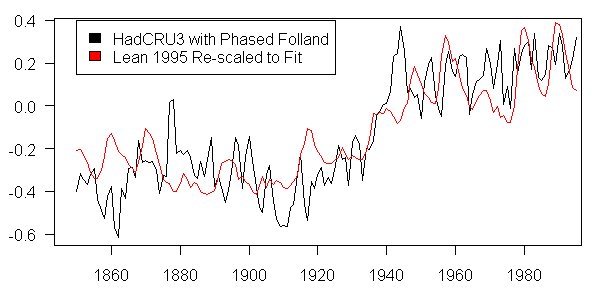
Icecap Note: In an earlier post here in this comment Steve noted “I took the graphic (above) in which the Folland adjustment was phased in allowing for the fact that 90% of known SST measurements in 1970 were done by bucket and not engine inlet and regressed that against a solar index that I had handy (Lean 1995) and plotted the two series together. Here’s what I got and this is the first pass without any attempt at designing:

See full size image
The correlation between the two series was 0.80 going from 1850 to 1995, the last year of the Lean 1995 solar estimate. I’ll compare this to Lean 2000 as well. This isn’t a “decadal” correlation or some such either. This is using the annual data.” Icecap Note: As another commenter noted, Real Climate which claimed the rapid cooling after WWII refuted the solar as a factor needs to rethink that (and a lot more). Read more of Lost at Sea here.
Update see the Battle between Real Climate and Prometheus over this issue here.
By Joseph D’Aleo, CCM
The global warmers are becoming increasingly desperate to prop up their failing prophesy in every way possible. Behaving just as Leon Festinger predicted in When Prophecies Fail. As the earth shows no net warming in a decade and cooling into its 7th year, as new models suggest cooling may continue because of natural ocean cycles, as the sun stays quiet now 12 years since the last solar minimum, usually a signal of cooling, as more and more peer review calls into question the importance of CO2 and of the the accuracy of the models and the entire greenhouse theory because of the failure of fingerprinting, the alarmists begin a frantic effort to save their failing theory. You see so many have won the lottery and want to ensure the annuity checks keep coming.
As we indicated in an earlier blog, they are now busy reinventing old data. The Hadley Center has repeatedly refused to release lists of the stations used in compiling their global data sets or in their papers claiming the data shows no urban adjustment is needed. NASA and NOAA continually revises old data and makes gross assumptions that always result in more warming. The old reliable radiosonde weather balloon data gets challenged because it (and the satellite derived data) do not show the warming the models and theory predict for the high tropical atmophere. A legitimate scientist would trust the data and assume the models are in error (as models so often are) but to these agenda driven alarmists, the models must be right and the data wrong. But because they can’t challenge the satellite data which has been quality assured and passed the sniff test, they go after the weather balloon data. They use some of the same unsound tricks that get more warming in the global data and revise the old balloon data to get better agreement with the models. See the ludicrous adusted data (RAOB 1.4 in black) in the diagram below.
See larger image here
They don’t stop there. They try a left end run by using winds as a proxy for temperatures to show the warming not shown by the balloon temperature measurements was really there (see May 26 Warm Winds Comfort Climate Models). In the same Natural Geoscience Journal issue, coincidentally, Peter Thorne of Britain Met Office Hadley Centre in a commentary wrote “The new study “provides ... long-awaited experimental verification of model predictions.” All these efforts were “fast-tracked” through the Journal of Climate and Nature in record time to show the complicity of the AMS and Nature in the whole scam.
Then there is that mid-century cold period, well-documented in many cold and snow records that were set in the 1960s into the 1970s but a thorn in the side of the alarmists as when combined with the apparent current cooling might imply cyclical behavior which would be hard to explain away without considering natural factors. So the solution - again find fault with the data. NASA and NOAA make adjustments to their “adjustments” to minimize the cooling then and now. Now they suddenly discover in a paper in the latest Nature that the ocean temperature measurement techniques did not change at once but gradually (something well known for years) and making that slower correction for the ocean changes results in at least part of the mid-century cold period become an artifact. This now will allow models to tweak back on the aerosol “fudge factor” adjustment they had to use to explain the cooling (since they downplay the sun and don’t handle ocean cycles well). Diminishing the cyclical look will allow them to argue this current cooling is a brief anomaly not totally inconsistent with their models, at least for a while longer. Unfortunately it may be a long enough period to allow congress and the new President to do something stupid. No on further reflection, that would be nothing unusual, I should have said REALLY stupid.
By Joseph D’Aleo, CCM
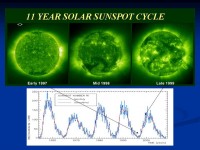
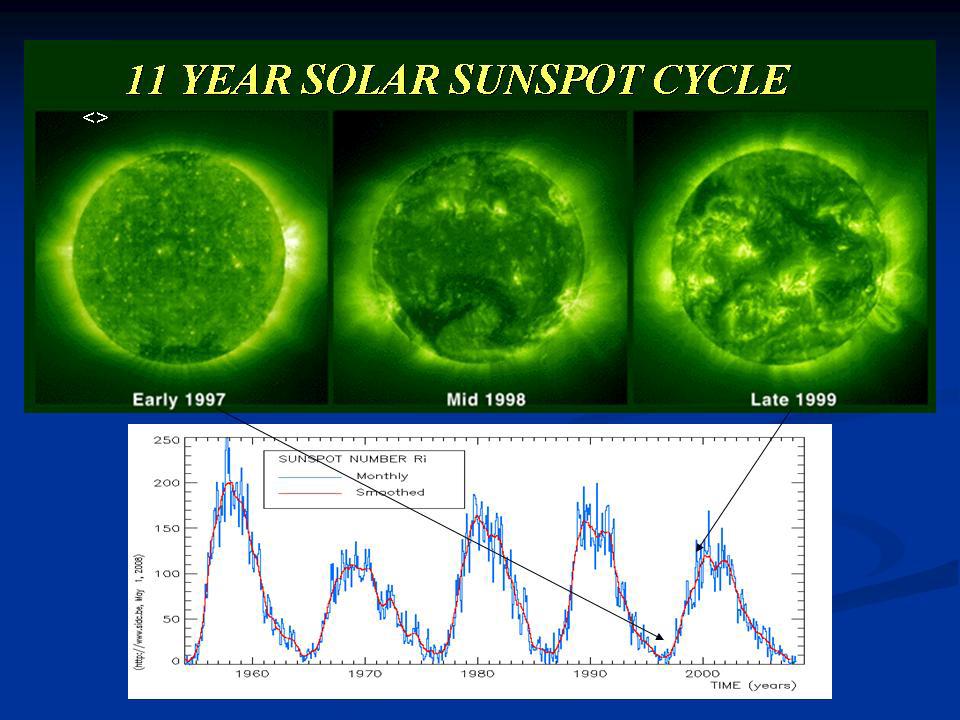
In 1610, shortly after viewing the sun with his new telescope, Galileo Galilei made the first European observations of Sunspots. Daily observations were started at the Zurich Observatory in 1749 and with the addition of other observatories continuous observations were obtained starting in 1849. As a climatologist, I always found it amazing that we have had regular sunspot data far longer than we have had reliable coverage of temperature or precipitation.
Monthly averages (updated monthly) of the sunspot numbers show that the number of sunspots visible on the sun waxes and wanes with an approximate 11-year cycle, The last five cycles are shown in the diagram below.
See larger image here
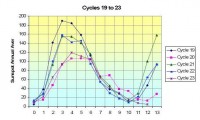
You can see from this diagram that the cycles are not equal in magnitude (smoothed sunpot number peaked 110 to 200) or period (9.8 to 12+ years). If you superimpose the five cycles you can see this even more dramatically. The chart has the annual average sunspot number and starts with the year of the solar minimum (lowest sunspot average). You can see that cycles 19, 21, and 22 were higher amplitude and shorter periods (bottoming out in years 9-10 and then rebounding rapidly). Cycles 20 and 23 were less amplified and longer. Cycle 20 lasted about 11.8 years. It appears from the evidence we will present that cycle 23 has not yet bottomed out and thus is at least 12 years long.
See larger image here
See in this analysis how longer, quieter cycles correlate with global cooling and shorter, stronger cycles with warming. The current cycle 23 appears to be the longest in at least a century and may project to quieter subsequent cycles and cooling temperatures ahead.
The publication ”Nature - Not Human Activity - Rules the Climate” is a Summary for Policymakers of the Report of the Nongovernmental International Panel on Climate Change with contributions by 25 scientists and edited and published by Dr. Fred Singer and the Heartland Institute. It has a forward authored by Dr. Frederick Seitz in February 2008. Dr. Seitz was President Emeritus, Rockefeller University, Past President, National Academy of Sciences, Past President, American Physical Society and Chairman, Science and Environmental Policy Project. Dr. Seitz sadly passed away on March 2, 2008. The NIPCC is being presented in briefings throughout Europe over the next month.
After the Introductioon (Section 1), the Nongovernmental International Panel on Climate Change focuses on two major issues: 1) The very weak evidence that the causes of the current warming are anthropogenic (Section 2) and 2) The far more robust evidence that the causes of the current warming are natural (Section 3).
The NIPCC then addresses the following issues: 3) Computer models are unreliable guides to future climate conditions (Section 4), 4) Sea-level rise is not significantly affected by rise in greenhouse gases (Section 5), 5) The data on ocean heat content have been misused to suggest anthropogenic warming. The role of greenhouse gases in the reported rise in ocean temperature is largely unknown (Section 6), 6) Understanding of the atmospheric carbon dioxide budget is incomplete (Section 7), 7) Higher concentrations of CO2 are more likely to be beneficial to plant and animal life and to human health than lower concentrations (Section 8), 8) The economic effects of modest warming are likely to be positive and beneficial to human health (Section 9) and 9) the Conclusion: Our imperfect understanding of the causes and consequences of climate change means the science is far from settled. This, in turn, means proposed efforts to mitigate climate change by reducing greenhouse gas emissions are premature and misguided. Any attempt to influence global temperatures by reducing such emissions would be both futile and expensive (Section 10).
Big Investors Seek Stricter Climate Laws
By Rachelle Younglai, Reuters
Investors managing more than $2.3 trillion urged the government on Tuesday to enact strict laws to cut greenhouse gas emissions, saying lax regulation could hurt the competitiveness of U.S. companies. The group of some 50 investors, including the world’s biggest listed hedge fund firm, Man Group Plc and influential venture capitalist John Doerr, want U.S. lawmakers to pass laws to reduce climate-warming emissions by at least 60 to 90 percent by 2050.
Legislation that promotes new and existing clean technologies on the scale needed to dramatically cut down pollution is needed, they said. The same group of investors are also pushing the U.S. Securities and Exchange Commission to force publicly-traded companies to disclose climate-related risks along with other factors that affect their business. “Establishing a strong national climate policy for emissions reductions will help investors manage the enormous risks and opportunities posed by global warming,” Anne Stausboll, Calpers’ interim chief investment officer, said in a statement.
“It’s a huge job opportunity,” said Edwards, who managed about $80 billion in assets as of March 31. “It will be a shifting economy. No economy is static.” The investors’ letter, addressed to Senate Majority Leader Harry Reid of Nevada and Minority Leader Mitch McConnell of Kentucky, comes ahead of Senate debate on legislation aimed at limiting the carbon emissions that spur climate change. Read more if you have the stomach here.
See the actual letter to congress from the investors who manage $2.3 trillion here.
As a scientist I respect remarked in response to this letter “Plainly, after investing for years in ‘solar energy’ and other dubious enterprises that have tanked simply because they are worthless, the investors are demanding compensation for their wishful thinking. This can only come by government intervention, because the free market cannot support businesses that cannot sustain themselves with their profits”
You can reach Harry Reid at 528 Hart Senate Office Bldg, Washington, DC 20510, Phone: 202-224-3542,Fax: 202-224-7327 or e-mail him here. You can reach Mitch McConnell at this address 361-A Russell Senate Office Building, Washington, DC 20510, Phone: (202) 224-2541, Fax: (202) 224-2499
By Joseph D’Aleo, CCM
NOAA reports that April 2008 was a full degree (F) below normal making it the 29th coldest April out of 115 years for the United States, the coldest in 11 years. Much of the western 2/3rds of the lower 48 were colder than normal. In Washington State, it was the second coldest April on record. In contrast in the east, in New York State it was the 3rd warmest.
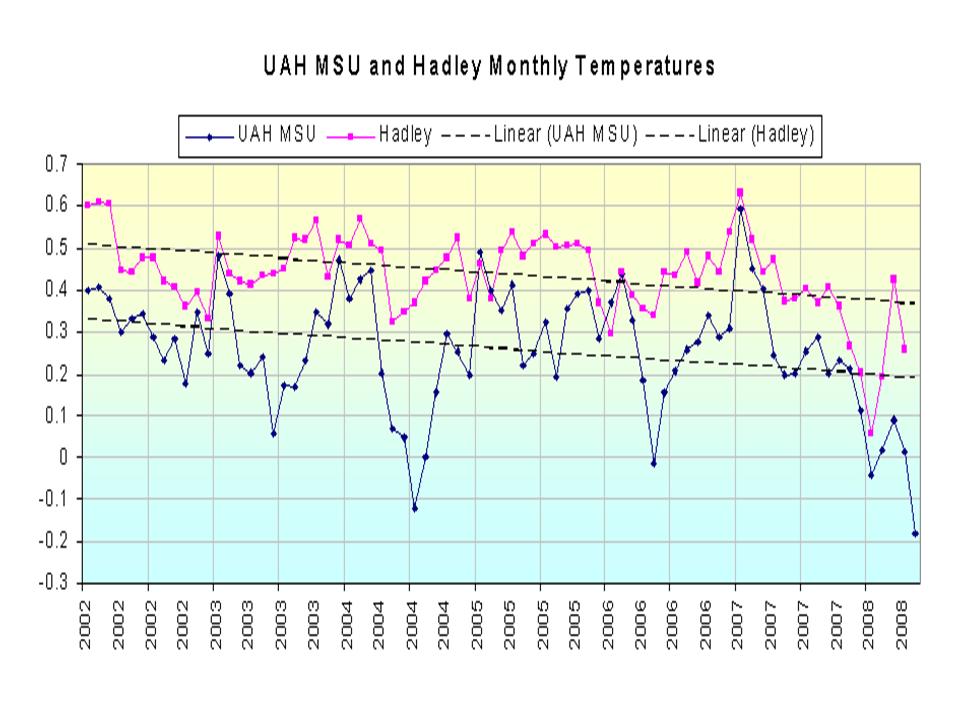
All the monthly global data sets are updated now. The University of Alabama Hunstville (Spencer-Christy) MSU satellite derived lower tropospheric data shows an anomaly of just +0.015C. The UK Hadley Center version 3v which includes land station and some ocean reports showed an anomaly of +0.265C. Adding this month to the plot since 2002 shows the downtrend continues.
See larger graph here
NOAA reported the combined average global land and ocean surface temperatures for April ranked 13th warmest since worldwide records began in 1880. However as numerous peer-reviewed papers have shown in the last few years, the global (and even the United States) data sets overestimate the warming by as much as 50% because of data dropout (see John Goetz post on Climate Audit here), the downplaying of the importance of urbanization (thanks to the acceptance of flawed papers by Peterson and Parker) and because as Anthony Watts and Roger Pielke Sr. have shown, there is poor siting of many of the instruments and improper documentation and adjustments for land use changes around the sites. The ocean data sets have their own set of issues as the methods (buckets, intake tubes and now satellite) have changed over the years. Hadley only includes data from merchant ships and noted that its ocean coverage is limited to regularly traveled ship routes and vast areas of the oceans (which make up 71% of the globe) are unaccounted for in their analysis (especially the southern oceans and a look at your globe will show you that the Southern Hemisphere is mainly ocean). Satellite data which senses over land and sea has the best coverage and is the most reliable, consistent and objective but is available only since 1979.
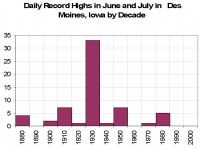
There has no doubt been some cyclical warming from 1979 to 1998, but it has been exaggerated by the poor station or ocean data. The state records as documented by Bruce Hall in 2007 tell the story. Scroll down to see the monthly records by state and link to other states. Most all of the heat records were set in the early half of the 1900s. A plot of Des Moines, Iowa June and July record highs by decade graph says it all. These tables and chart show that the current warming is clearly not unprecedented as alarmists claim, not even in the last century.
See full size graph here
I believe that if we had satellite monitoring for the last 120 years, we would see the recent warming though real, fell short of that in the 1930s and that the changes are cyclical and thus primarily natural in origin. That is not to say that cities have not grown warmer as they have grown and some warming through the population growth from 1.5 to 6.5 billion since 1900 has taken place nor that we shouldn’t be better stewards of our environment, only that man-made greenhouse warming as portrayed by the agenda driven alarmists, the mainstream media and the IPCC is a fraud.
By Patrick J. Michaels, The Washington Times
On May Day, Noah Keenlyside of Germany’s Leipzig Institute of Marine Science, published a paper in Nature forecasting no additional global warming “over the next decade.” Al Gore and his minions continue to chant that “the science is settled” on global warming, but the only thing settled is that there has not been any since 1998. Critics of this view (rightfully) argue that 1998 was the warmest year in modern record, due to a huge El Nino event in the Pacific Ocean, and that it is unfair to start any analysis at a high (or a low) point in a longer history. But starting in 2001 or 1998 yields the same result: no warming.
The Keenlyside team found that natural variability in the Earth’s oceans will “temporarily offset” global warming from carbon dioxide. Seventy percent of the Earth’s surface is oceanic; hence, what happens there greatly influences global temperature. It is now known that both Atlantic and Pacific temperatures can get “stuck,” for a decade or longer, in relatively warm or cool patterns. The North Atlantic is now forecast to be in a cold stage for a decade, which will help put the damper on global warming. Another Pacific temperature pattern is forecast not to push warming, either.
Computer models, like the one used by Keenlyside, et al., rely on “positive feedbacks” to generate much of their warming. First, atmospheric carbon dioxide warms things up a bit. Then the ocean follows, raising the amount of atmospheric water vapor, which is a greater source of global warming than carbon dioxide. When the ocean does not warm up, it seems that the additional warming is also delayed. All of this may mean that we have simply overestimated the amount of warming that results from increases in atmospheric carbon dioxide.
Several recent publications in the peer-reviewed literature argue that observed changes in temperature show the “sensitivity” of temperature to increasing carbon dioxide is lower than earlier estimates. All of this suggests a 21st-century warming trend that will be lower than the average value calculated by the climate models in the IPCC compendium. Several recent publications in the peer-reviewed literature argue that observed changes in temperature show the “sensitivity” of temperature to increasing carbon dioxide is lower than earlier estimates.
One final prediction: The teeming polar bear population will be listed as “endangered,” and in the next year or two, Congress will pass a bill mandating large and impossible cuts in carbon dioxide. What is “settled” is the politics, not the science. Read more here.
By Joseph D’Aleo, CCM
As part of a four part series on the ocean’s multidecadal cycles and their importance to climate on Intellicast.com, the last two weeks we showed how the natural multidecadal cycles in the Pacific (called the Pacific Decadal Oscillation or PDO) and Atlantic (called the Atlantic Multidecadal Oscillation or AMO) affected the frequency of El Ninos and La Ninas and combined to correlate strongly with temperatures over the United States. In part III this week, we discuss temperatures and ice in Greenland and the Arctic, topics sure to dominate the news this summer. Already recent media stories have some scientists predicting another big melt this summer. We will show how that is not at all unprecedented (happens predictably every 60 years or so) and is in fact entirely natural.
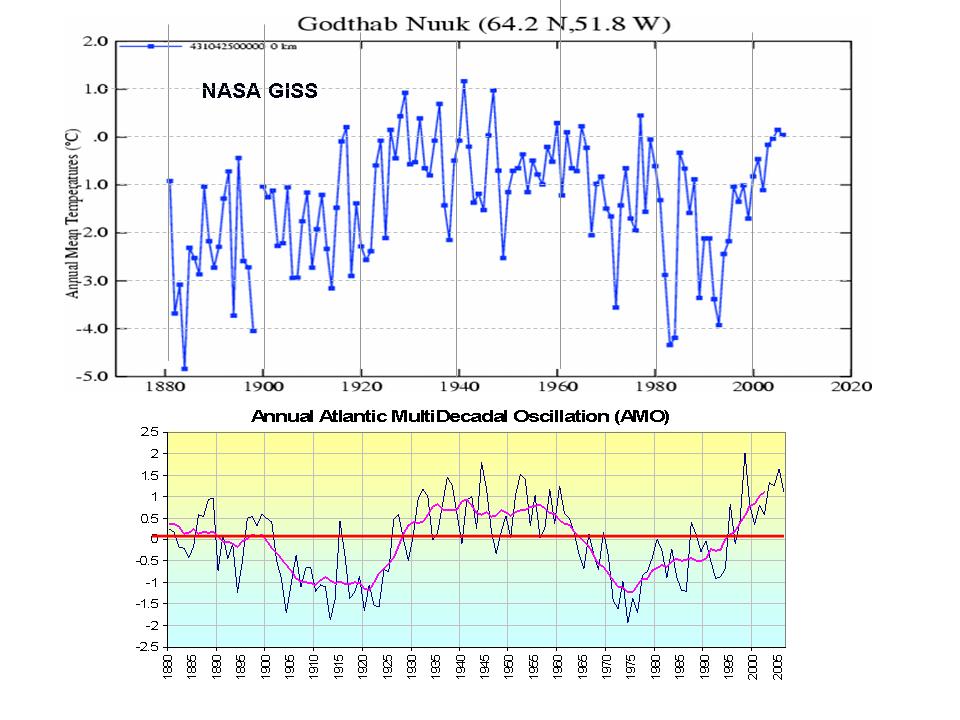
Temperatures were warmer in the 1930s and 1940s in Greenland. They cooled back to the levels of the 1880s by the 1980s and 1990s. In a GRL paper in 2003, Hanna and Cappelen showed a significant cooling trend for eight stations in coastal southern Greenland from 1958 to 2001 (-1.29C for the 44 years). The temperature trend represented a strong negative correlation with increasing CO2 levels.
Shown below is the temperature plot for Godthab Nuuk in southwest Greenland. Note how closely the temperatures track with the AMO (which is a measure of the Atlantic temperatures 0 to 70N). It shows that cooling from the late 1950s to the late 1990s even as greenhouse gases rose steadily, a negative correlation over almost 5 decades. The rise after the middle 1990s was due to the flip of the AMO into its warm phase. They have not yet reached the level of the 1930s and 1940s.
See full size here.
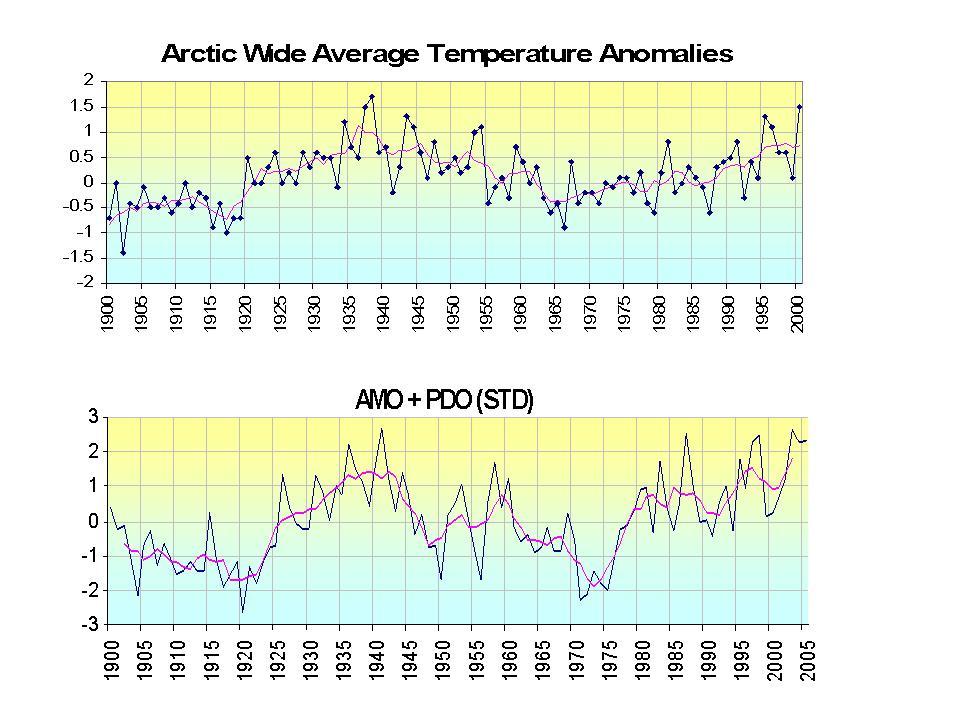
Warming in the arctic is likewise shown to be cyclical in nature. This was acknowledged in the IPCC AR4 which mentioned the prior warming and ice reduction in the 1930s and 1940s. Warming results in part from the reduction of arctic ice extent because of flows of the warm water associated with the warm phases of the PDO and AMO into the arctic from the Pacific through the Bering Straits and the far North Atlantic and the Norwegian Current.
As was the case for US temperatures, the combination of the PDO and AMO Indexes (PDO+AMO) again has considerable explanatory power for Arctic average temperature, yielding an r-squared of 0.73.

See full size here.
See much more with much peer review support for the ocean’s role in the Arctic and Greenland cycles of temperature and ice in the story here. In part IV, next week, we will address how both the Pacific and Atlantic control the strength, frequency and favored storms tracks for Atlantic tropical storms.
By Joseph D’Aleo, CCM
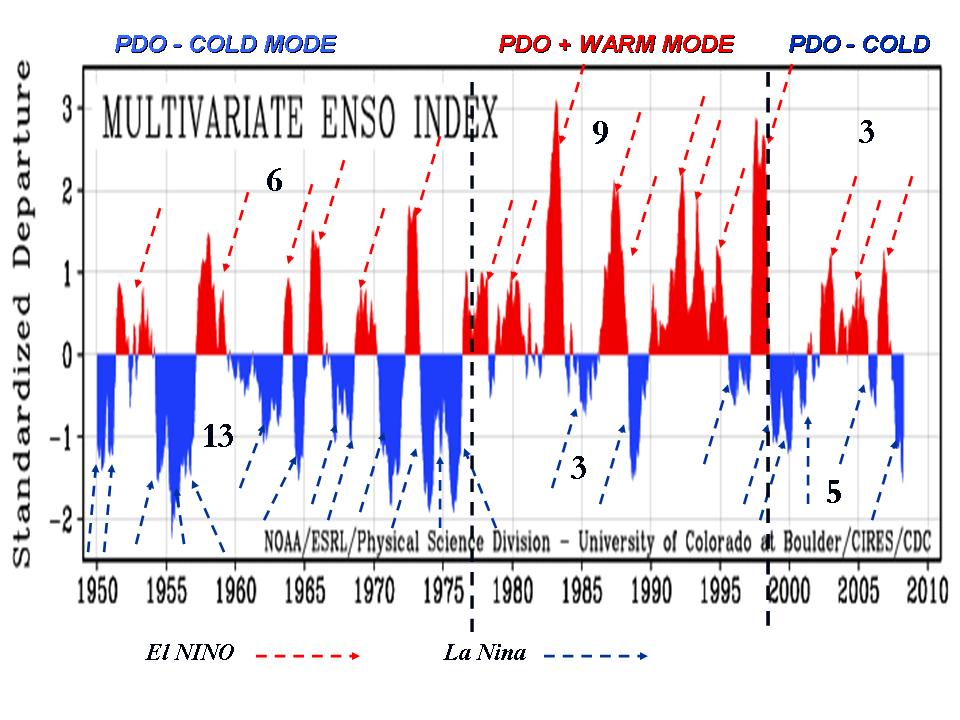
In a recent story we showed how the PDO cycle related to the relative frequency of El Ninos and La Ninas and through that, global temperatures. This is the case because El Ninos lead to global warmth and La Ninas a cooling.
See larger graph here.
You can clearly see on the chart of Wolter’s Multivariate ENSO Index (explained here) the predisposition for more and stronger La Ninas and fewer weaker El Ninos during the cold phase of the PDO and more and stronger El Ninos and fewer cooler La Ninas.
See larger graph here.
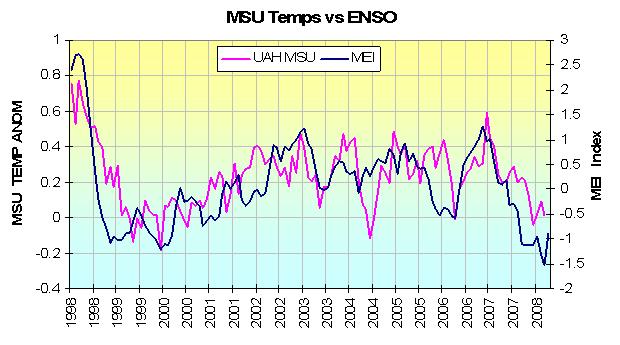
The last decade, we see how well the monthly MEI correlated with the global temperatures. The correlation (Pearson coefficient) is 0.60. There appears to be a lag of a few months from the diagram and indeed if we lag temperatures 3 months to MEI, the correlation jumps to 0.68. Read more here.
See larger graph here.
CO2 Science
In their 2008 peer review paper in Deep Sea Research, Hobson etal. used International Comprehensive Ocean-Atmosphere Data Set sea-surface temperature data to calculate, in annual time steps, the mean August-September positions of the 12, 15 and 18C isotherms in the North Atlantic Ocean from 1854 to 2005 at 2-degree longitudinal intervals.
In the words of the authors: (1) the three isotherms “have tended to move northwards during two distinct periods: in the 1930s-1940s and then again at the end of the 20th century,” that (2) “the chances of this occurring randomly are negligible,” that (3) the 15C isotherm “reached a maximum latitude of 52.0N in 1932, and a latitude of 51.7N in 2005, a difference of approximately 33 km,” and that (4) “of the 10 most extreme years, 4 have occurred in the 1992-2005 warm era and 3 have occurred in the 1926-1939 era.”
Considering the totality of their findings, the UK and Australian researchers concluded, in the broadest of terms, that “current ‘warm era conditions’ do not eclipse prior ‘warm’ conditions during the instrumental record,” which sounds an awful lot like what we have concluded, over and over, in our U.S. Temperature Record of the Week feature, i.e., that during the period of most significant greenhouse gas buildup over the past century (1930 and onward) there has been little to no net increase in mean near-surface air temperature throughout the United States. Now the same appears to also have been true throughout a large sector of the North Atlantic Ocean.
Wet, Cold Weather Continues to Slow Corn Planting, Baseball BattingBy Darwin Danielson, Radio Iowa
Wet weather is continuing to slow the progress of planting in the state. The latest report from the State Agriculture Department says continued scattered showers last week left many fields wet, and cold weather that included frost in some areas, also hampered planting. But the report says farmers have made some progress.
Farmers had planted 46% of their corn acres by the end of last week, which is a little more than half of what was planted at this time last year and well below the five year average of 70%.
The report says corn planting overall is 11 days behind the five year average. Farmers are hoping to make more progress this week as more delays will cut into yields at the end of the season. See story here.
And this one By Max Utsler in Major League Baseball.com
You can describe Kansas City’s season-long lack of offense with two simple words: Cold bats. And the reason why might be cold bats—literally. In spite of being the southern-most team in the AL Central, the Royals have only played two of 17 home dates where the temperature registered above 70 degrees.
Things haven’t been so hot on the road, either. Road trips have included Detroit, Seattle, Los Angeles, Oakland and Cleveland. The trip to Texas featured temperatures well into the high 70’s, but even that was somewhat offset by winds that roared up to 30 mph.
Fans and players won’t notice any great improvement this weekend. Saturday night’s game-time temperature was expected to be slightly under 60 degrees, with an overnight drop to 44. Sunday’s predicted high is 54. See that story here.
See larger image here.
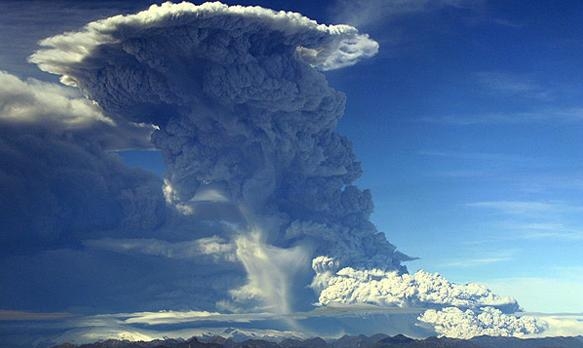
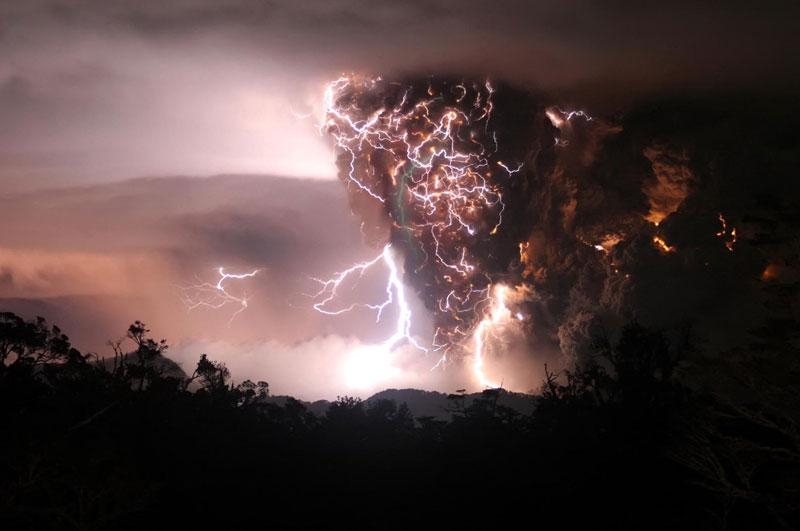
By Joseph D’Aleo, CCM
The news is reporting a relatively large and long lasting volcanic eruption in Chile. According to the AP, the Chaiten volcano spewed lava and blasted ash 20 miles (105,000 feet) into the sky on Tuesday the largest ruption to date since the volcano came back to life last week, prompting a total evacuation of the provincial capital and other settlements. The volcano’s long lasting eruption has sent a thick column of ash into the stratosphere, streaming across Patagonia to the Atlantic.
In earlier stories, we noted that there are usually 8 to 12 volcanic eruptions on-going at almost all times. Most are the small guys which emit just lava or if eruptive have their ash and gas clouds only reaching thousands to a few tens of thousands of feet in the air, remaining within the troposphere where the ash and gases quickly falls or gets rained out within a few days or weeks.
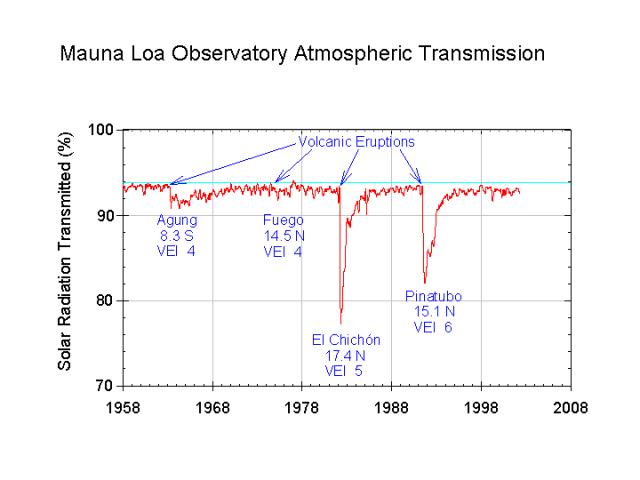
It is the bigger eruptions that reach above this tropospheric layer into the more stable stratosphere that can have long lasting (up to several years) and extent effects (global). Pinatubo in 1991 reached over 110,000 feet and El Chichon 105,000 feet in 1982. Both Mt. St. Helens in 1980 and Cerro Hudson in 1991 reached around or just over 60,000 feet. The activity has not ceased and it is still possible a larger eruption will follow. The long lasting (5 days plus) nature of this eruption adds to the likelihood of an effect. But so far according to Simon Carn, a University of Maryland-Baltimore volcanologist who uses satellites to measure volcanic gases, Caiten had so far only emitted a few thousand tons of sulfur dioxide, small by comparison to Pinatubo which emitted 20 million tons. According to Alan Robock, a Rutger’s volcanologist at least a million tons must be emitted to really make a difference. He also noted that because of it high latitude location, any affect may be mainly limited to the Southern Hemisphere.
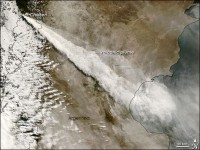
See larger image here. See video of the eruption here. See some amazing photographs here and here.
Note how much a major eruption can reduce incoming solar energy. This would add to the global cooling from the ocean flips and the a super long cycle 23 and possibly quiet solar cycle 24.
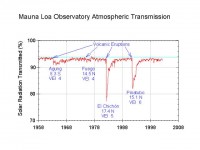
See larger graph here.
We have written on volcanic potential effects here and here.
One other note, back over a decade ago, there was some speculation that volcanic activity led to El Nino development as the ash reduced the thermal and thus pressure gradients and through them the equatorial easterlies, reducing cold water upwelliing in the eastern Pacific and favoring the sloshing east of warm water from the western Pacific. Anecdotally the super El Nino of 1982/83 followed El Chichon and the El Ninos of 1991/92 and 1992/93 followed Pinatubo and Cerro Hudson. Stay tuned as additional assessments are made of how much Chaiten may play a role on what’s ahead.