


By Peter Finlayson
With the die now cast for the imposition of an onerous carbon tax on the Australian economy it is timely to consider how this senseless position was reached and forecast what lies ahead for an Australian society of 22 million souls.
While the more courageous scientific and economic lobbies are protesting the rationale for the tax, there should be no doubt now that it is being forced upon this nation for political reasons simply to safeguard the majority Greens-Labor-regional independents’ alliance in the federal parliament.
For the present the Greens effectively control federal policy, especially on issues that really matter, with the carbon tax but the tip of an iceberg. Consequently, those complicit in their election have much to answer for. That the alarmist measures are unnecessary and result from a systematic Green’s-driven campaign is evident from the fact that science has yet not found a clear link between man-made CO2 and climate change. There has been no increase in global temperatures, as predicted by IPCC computer modelling, since 1998, nor has there been any decline in the arctic polar bear population, nor any abnormal rise in ocean levels, nor damage to
the Great Barrier Reef, etc.
Furthermore, far from being a pollutant, CO2 is necessary for plant life with a scientifically-proven positive correlation between atmospheric CO2 concentration and plant growth. Indeed, the planet supported an abundant plant life during the Carboniferous era with CO2 concentrations more than five times today’s levels of less than 400ppm.
That the tax is futile in terms of any global impact on emissions is self-evident from the fact that Australia’s contribution to global emissions is negligible at under 2% and Australia has failed to influence the big emitters to follow suit.
In compensating households for the increase in their utilities’ costs the government provides no incentive for domestic energy users to change their behaviour; in addition, some economists are predicting that the government will not be able to meet its compensation promises.
That the tax will have a serious negative impact at all levels of the economy is becoming clearer daily. At domestic level, the cost of living will increase due to the direct and indirect impact of the tax on processed consumer goods and utilities. Despite denials by the pro-tax lobby and policy-makers the impact on industry and commerce will be variably significant depending on their energy consumption.
Heavy industry and mining will likely be at a comparative disadvantage to their overseas competitors and forced to go offshore where emissions will continue, or shut down with consequent unemployment issues. The seriousness of many social impacts is only slowly beginning to unfold as these are not immediately apparent and the wider community has not yet realised the serious longer term implications of the relentless Greens’-driven ‘reforms’.
Moreover, the UN’s ‘Green’-motivated international agencies such as the UN Women’s and radical feminist groups, with their anti-life (abortion, euthanasia, same-sex marriage and the like) policies are already disrupting traditional family life.
Greens’ assault
With their electoral power now assured, and in accord with their Global Charter, the Greens will intensify their assault, firstly on Australian society, to ultimately create a biocentric world in which nature (landscape, plants, animals, insects) is superior to humanity and becomes the focus of humanity’s development.
This means that resources and activity now used for the benefit of human society will be transferred to enhancing nature, including reversing the scientific advances that have fed, clothed and kept healthy an increasing, longer-living population.
The carbon tax is but a legal ploy for forcing our (mineral and energy) resources to remain untouched. It joins the long-time successful challenge by the Greens and other groups who demanded that water flow out to sea where its (edible) creatures could enjoy an unmolested existence!
Without coal, society will depend for its energy on renewable sources, which scientists have warned will be very expensive and cannot match fossil energy, thus enforcing a reduction in living standards. Energy-dependent industry will be forced to downsize with inevitable flow-on effects on economic development.
At the same time measures to lower national (and global) population will emerge to reduce the human ‘polluters’ to a level that will accommodate society within the limited resource and economic base permitted by a nature-oriented world. The Green’s sustainable human population estimate for Australia is seven million.
The dilemma for many environmentally conscious Australians is that the anti-humanity focus of the Greens’ policies is completely at odds with the Judaeo-Christian principles governing a balanced relationship between humanity and nature. Successive popes have stressed that nature is at the service of humanity which may use and develop its natural resources, always mindful of the obligation to safeguard nature for the benefit of future generations, while emphasising that nature must not be glorified.
The blame for the political rise of the Greens-dominated environmental lobby can include a sympathetic media, influenced by the clever Greens’-driven propaganda campaign that began fifty years ago, along with the failure of orthodox science to be more outspoken, especially those employed in the public sector.
In addition, according to anecdotal information, the religious education system, in encouraging an environmental consciousness, has failed to get the correct balance between a (Christian) humanity-centred and a (atheistic) biocentric focus, in accord with Christian principles. Sadly, a number of influential clergy and religious have also lost sight of a human development imperative within a theology of the environment.
Peter Finlayson is an active Catholic in the Ballarat Diocese and an agricultural scientist who has worked in many developing countries.
By Patrick J. Michael, Senior Fellow in Environmental Studies at the Cato Institute
Boston University’s Robert Kaufmann and colleagues recently published a paper in the Proceedings of the National Academy of Sciences examining the causes of the recent dearth of “global warming.” They concluded that it’s simply natural variability, augmented by increasing sulfate emissions from dramatically growing coal consumption by China.
Of course, it is the latter conclusion that has drawn all the attention, for it allows the possibility that greenhouse gases are continuing to impart an as-expected warming influence on the global climate. And then once China gets its air pollution under control (and we are talking about true air pollution here, i.e., not carbon dioxide), global temperatures will rise rapidly. Thus the dream of alarming climate change lives.
If China’s sulfate emissions are not having much of an impact of global temperatures, then, the dearth of warming in recent years supports the hypothesis now made by many (unpopular) folks in the climate business that the “sensitivity” of temperature to carbon dioxide has been guessed (we choose our words carefully here) to be too high by climate modelers. In this scenario, we wake up from the alarmist nightmare and resume our normal lives.
There are two reasons why we think it is wrong for Kaufmann et al. to attribute a reduced rate of global warming to Chinese sulfates:
1) China’s cooling sulfates do not readily make their way into the Southern Hemisphere, yet, from 1999-2010, temperatures actually fell there, while they rose in the Northern Hemisphere. This is exactly the opposite of what should have happened if sulfates are exerting a relative cooling primarily in the Northern Hemisphere
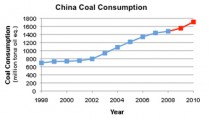
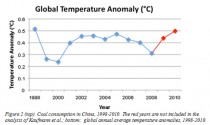
2) Chinese coal consumption increased in 2009 and 2010 (in fact, 2010 had the biggest year-over-year increase recorded) yet, the global temperature rose sharply in 2009 and in 2010. Because Kaufmann’s climate model responds instantaneously to sulfates (as opposed to a decades-long lag to adjust to carbon dioxide changes) this is contrary to his hypothesis.
Let’s look at the first one.
The link below shows the march of weather systems around the globe for several months. Notice that the weather systems passing through China quickly move into the north Pacific Ocean, and don’t mix into the Southern Hemisphere. Since sulfates only have an atmospheric lifetime of about a week or so, they are hard pressed to cause any cooling impact beyond the areas to the immediate east of China.
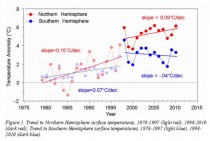
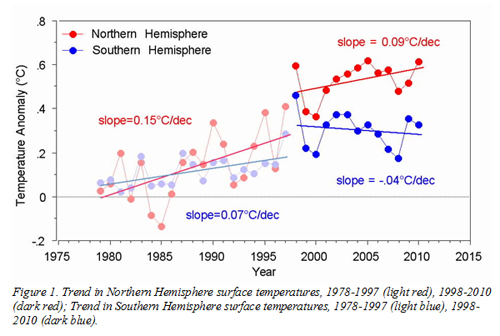
So, if a dramatic increase in Chinese sulfur emissions during the past decade or so has been responsible for the observed slowdown in the rate of global temperature increase, then the Northern Hemisphere should be doing most of the work - that is, the rate of warming in the Northern Hemisphere should have slowed by much more than the rate of warming in the Southern Hemisphere. This situation is easy to check.
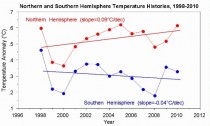
Figure 1 shows the Northern and Southern Hemisphere temperature history from 1980 through 2010 according to the surface temperature data set compiled and maintained by the Climate Research Unit at the University of East Anglia. During the period of time during which Chinese sulfate emissions rose (1998-2010), the warming in the Southern Hemisphere went negative (i.e. became a cooling) while the Northern Hemisphere warmed. From Figure 1 it is obvious that the Southern Hemisphere is driving the global temperature slowdown, not the Northern - a result completely contrary to Kaufmann et al.’s Chinese sulfate hypothesis.
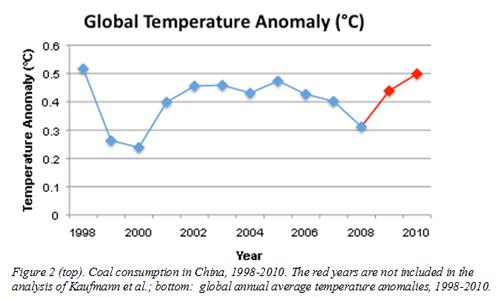
Now let’s turn to our Reason #2. Simply put, during the past 2 years (which were not part of the Kaufmann et al. dataset), global temperatures rose as did Chinese coal consumption. According to Kaufmann et al.’s hypothesis, the increase in Chinese coal consumption should act to drive down the rate of global temperature rise, but that is not what happened. Again, temperatures are behaving in an opposite fashion, compared to what the hypothesis predicts.
Enlarged.
The top panel in Figure 2 shows Chinese coal consumption from the BP Statistical Review of World Energy from 1998 through 2010. Notice that it increased substantially in both 2009 and 2010 - two years not included in the Kaufmann et al. analysis. The year-over-year increase from 2009 to 2010 was the highest annual increase on record. If Chinese coal consumption were having a large impact on global temperature, we would expect that global temperatures would remain suppressed in 2009 and 2010. But the bottom panel in Figure 2 shows what really happened - global temperatures rose in both 2009 and 2010, contrary to the Kaufmann et al. hypothesis.
It is clear that natural variability, not sulfate emissions, is the cause of the lack of recent warming. We arrived at this very same conclusion several years ago, however, despite repeated attempts, we were unable to find a journal even interested in considering our work for publication.
Our analysis was remarkably similar to Kaufmann’s:
a) in previous work, we both built (and published) a statistical model relating global temperature change to elements of natural variability (including El Nino, volcanoes, and solar variability) and anthropogenic forcing;
b) in our new papers, we used that same (published) statistical model, but updated the independent variables (natural variability and anthropogenic forcing) with recently available data;
c) we used the updated independent variables to “forecast” the dependent variable, global temperature from 1998-2007 (in our case) or 1999-2008 (their case)
d) we concluded that our model developed from the pre-1998 data worked quite well using the post-1998 data i.e., the global temperature response since 1998 was just what we would expect it to be, based on what it was in the couple of decades immediately prior to 1998;
e) we both arrived at the same take home message:
Kaufmann et al. (2011):
[W]e find that recent global temperature records are consistent with the existing understanding of the relationship among global surface temperature, internal variability, and radiative forcing, which includes anthropogenic factors with well known warming and cooling effects.\
Our paper (2008):
We find that the combined forces of “natural” variations in ENSO, solar activity and volcanic eruptions have acted to temporarily offset the continued pressure exerted by “global warming” [which we defined as “from anthropogenic activities, or from some other not-yet-fully-understood processes"]
The only difference between the manuscripts was Kaufmann’s unsupportable hypothesis that Chinese sulfate emissions also contributed to the lack of warming.
Our experience with the peer-review process was a nightmare that eerily resembles what University of Guelph’s Ross McKitrick describes in his chapter “Bias in the Peer-Review Process,” in my new book, Climate Coup.
We started with the American Geophysical Union’s (AGU) publication EOS, Transactions of the American Geophysical Union. After sitting on the paper for several months (which included getting a review or two), the EOS editors told us that we had too much “new” science in our piece and that EOS was more of a news publication and that they’d be happy to consider publishing a description of our work after it was published elsewhere:
Here is a review that they got concerning our submission:
I have carefully read and reread this proposal. Must say that I am surprised that the 2nd author [Patrick Michaels] is now stating that global warming is alive and well, and implicitly supports the view that anthropogenic activities, especially greenhouse gas accumulation in the atmosphere and ocean is the cause of current global warming trend. Eos readership would find the overall argument interesting, especially from the 2nd author.
However, the authors propose to carry out new analysis using a version of a previously published methodology/model. Hence, in my view, such analyses should be submitted as a research paper in a peer reviewed journal and rather than Eos. I admit that I have not chased the previously published methodology to ascertain the validity or otherwise of the proposed new analysis.
And here is their final decision:
I have consulted with several Eos editors, and one problem with this submission is the presentation of any new data. As stated earlier Eos is not an appropriate outlet for publishing new data. However, we would be very much open to publishing reinterpretation of **published** data or analysis.
Therefore, we stand by our earlier decision that after you publish the original research in a peer-reviewed journal that you come back to us with a proposal for writing something for Eos that would be written for the broad spectrum of disciplines represented by our readership.
OK, fine. Since the paper describing our original model (Michaels and Knappenberger, 2000) was published in another AGU publication, Geophysical Research Letters, we figured we submit our new paper there, after expanding the piece from the original EOS submission to a paper more appropriate for GRL. In our cover letter to GRL, we included our full set of correspondence with the editors of EOS, and explained how EOS was potentially interested in our findings, but considered there to be too much “new” science for it to be published there. We also included the reviewer’s comments that Eos had obtained (and reproduced above) including “Eos readership would find the overall argument interesting, especially from the 2nd author.”
Here is what we got back from the GRL editor, one day after submission:
I have evaluated your paper, 2008GL035428, and determined that it is not the type of high-impact contribution that warrants rapid publication in a letters journal such as Geophysical Research Letters. Of course the topic of your work is of critical importance. However, I believe that your analyses are too simplistic relative to others published in GRL. As such I am returning your paper without review.
Interesting. Too much new science for one AGU publication, too little for another.
So we turned to a journal which has a section dedicated to short science pieces with broad interest - we reworked our article and submitted it as a Brevia piece to Science magazine.
A week later we got this:
Thank you for submitting your manuscript “Did Global Warming Stop in 1998?” to Science. Because your manuscript was not given a high priority rating during the initial screening process, we will not be able to send it out for in-depth review. Although your analysis is interesting, we feel that the scope and focus of your paper make it more appropriate for a more specialized journal. We are therefore notifying you so that you can seek publication elsewhere.
Well, we figured Science was a long shot.
At the same time, we had received several emails soliciting/inviting us to submit a paper to a new journal titled Advance in Meteorology - a journal that was looking for content to get it off the ground:
I am writing to invite you to submit an article to the newly launched Advances in Meteorology, which aims to provide a rapid forum for the dissemination of original research articles as well as review articles in all areas of meteorology.
We figured, we had a paper basically ready to go for them. So, we redrafted it to fit the submission guideline to Advance in Meteorology, and sent it off.
About a week later we got this:
Following the review of your Research Article AMET/746854 titled “Did “Global Warming” Stop in 1998?,” by Patrick J. Michaels and Paul C. Knappenberger, I regret to inform you that it was found unsuitable for publication in Advance in Meteorology.
The major reasons are that this topic is discussed elsewhere (e.g. IPCC 2007), the statements are too general and simplified, the methods not appropriate to address the question of detection and attribution at such short time scales. Further, the analysis does not include other relevant factors, such as oceanic components, that have been shown to be of importance to account for continental to global warming. Also important other features at intra to interannual time scales are missing. The period is too short for a good model calibration/verification and to derive statistical sound results.
The complexity of this kind of analysis, in this case applied to decadal scale predictions are presented in Keenlyside et al. (2008, Nature, 453, 84-88). They have also hindcast experiments using different forcings to explain current conditions.
Ok, well, at least we got some scientific feedback, all of which was irrelevant. Our empirical model was built using monthly data over a time period of 20 years, fit the observed temperatures pretty well (the explained variance was about 60%) and it had already been published in Geophysical Research Letters. We were merely using it to understand the recent lack of warming.
Before giving up completely, we thought that we’d give it on more go, this time at the journal Climate Research, where we had published a half dozen or more papers in the past. About a week after submission, we got this response:
We have looked through the manuscript (ms) ‘Did “global warming” stop in 1998?’ that you recently submitted for publication in Climate Research.
While the information reported might be interesting, I regret to inform you that we cannot consider your ms for publication. We did not find your scientific arguments very convincing.
Climate Research was the journal that the climategaters particularly hated. They hatched plans to destroy it every time it published something they didn’t like, and I am sure these leaked all over the porous world of climate science. Perhaps their campaign worked.
We don’t know how to explain the glib acceptance of a very similar paper in the Proceedings of the National Academy of Sciences (with the exception of the obviously wrong hypothesis about Chinese sulfates), and our going 0-for-5. But that is the way it is.
References:
BP Statistical Review of World Energy 2011
Hansen, J., et al., 2005. Efficacy of climate forcings. J. Geophys. Res. 110, D18104, doi:10.1029/2005JD005776.
Kaufmann, R. K., et al., 2011. Reconciling anthropogenic climate change with observed temperature 19982008. Proceedings of the National Academy of Sciences. doi: 10.1073/pnas.1102467108
Michaels, P.J., and P.C. Knappenberger, 2000. Natural signals in the MSU global temperature record. Geophysical Research Letters, 27, 2905-2908.
By Jack Spencer, CAPCON Aug. 5, 2011
For nearly 20 years George Taylor, former Oregon State professor of climatology, has been one of the more vocal skeptics of man-made climate change.
Like other climatologists, such as Patrick J. Michaels in Virginia, Taylor lost his title as a “State Climatologist” in 2007 after refusing to jump onto the man-made climate change wagon. Taylor was also actively involved with the American Association of State Climatologists, which ran afoul of the U.S. Congress and lost funding for not going along with climate alarmists.
When asked once by a reporter whether the Earth’s temperatures would be warmer or colder in 5,000 years, Taylor pointed out that by that time we’d be headed back toward the next ice age. “It will almost certainly be colder,” he explained.
That was the sort of politically incorrect answer that has gotten Taylor in trouble with the man-made climate change crowd for years. About three years ago Taylor, now 63, left his post as Oregon State University professor and is now a private-sector climatology consultant.
Capitol Confidential interviewed Taylor via telephone on Aug. 1. The following are excerpts from that interview.
CC. There are those who describe climatologists who don’t believe in man-made climate change as being on the fringe. Is that true?
“Absolutely not. It’s very much in the mainstream now. There are many, many climatologists who are skeptical about it (man-made climate change). I don’t know if it’s more than 50 percent or not. But in science that really doesn’t matter. Science has nothing to do with who has a consensus or a majority.
CC. That’s true about science but not politics and this has all become very political hasn’t it?
“Yes, it has. By the way, I’m a minimalist. I do believe that human activity might affect the climate a small amount, but whatever that is it’s vastly overshadowed by natural forces. There are many, many people who feel like I do. I’d be willing to change my mind if the science indicated that I should. But the science doesn’t suggest that.”
CC. Is it frustrating to deal with the way climatologists like you are characterized by some segments of the news media?
“Yes; very frustrating. As a scientist my job is to give an accurate assessment. In return I was getting back a lot of personal attacks - even ones that tried to impugn my integrity. They’ve claimed that I’m working for the oil companies and all sorts of things. OK, if you don’t happen to agree with me then say so but to resort to these personal attacks . . . Then Ellen Goodman said (in 2007) that global warming deniers were on par with Holocaust deniers. It was unbelievable. I guess it’s like an attorney friend of mine says: ‘if the law is on your side pound on the law - if the facts are on your side, pound on the facts - if the facts aren’t on your side, pound on the table.’ So the other side pounds the table. But I have to say that now, as more and more people have been willing to say they agree with my point of view, I feel a lot more comfortable about it.”
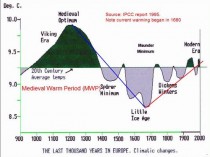
CC. The various charts that show the history of climate change over the past 2,000 to 3,000 years; is there much dispute about them? Don’t they all show basically the same history of changes - the spike of the Medieval Warm period and the Little Ice Age we’ve been climbing out of?
“They’d show that about a thousand years ago it was a lot warmer than it is now. That was the Medieval Warming period. Then around the 1300s it started to cool as the Little Ice Age began. But I guess we’d have to say this was all still in dispute. Michael Mann came along and drew the Hockey Stick graph for Al Gore, which completely changed modern climate history. It didn’t have the Medieval Warming period or the Little Ice Age on it. He used tree rings and proxies to support this. Of course this goes against almost every other piece of historical evidence.”
CC. Aside from the scientific evidence, wasn’t there also direct historical evidence of the Medieval Warming period, such as the Viking expansions, written evidence from that time and art from that period?
“Yes, there are those examples, such as the Vikings settling in Greenland, which shows how much warmer it was back then. And there were no internal combustion engines to blame the warmer temperatures on.”
CC. Do you think most people in your audience are even aware of this historical context?
“What do you mean by my audience?”
CC. The people you talk with or to whom you make presentations.
“For the most part my audience is made up of intelligent lay people. My experience has been that usually they see it from my perspective. But as Richard Lindzen has pointed out, a lot of very smart people believe in man-made global warming. My experience has been that a lot of very smart people buy into it but most normal people don’t.”
CC. To what do you attribute that?
‘When I say real smart people, I’m referring to people like university professors and so on. I think they tend to buy into it because generally they’re liberals who look to government action to address problems. Meanwhile the average, normal person is likely to be a little more conservative. Ultimately, I think that’s what makes the difference.”
CC. When climatologists write about man-made climate change, they often pay lip service to it = saying how important continued studies are and so on. However, looking closely, often they don’t come out and say whether or not they actually subscribe to the theory. Are there really that many who believe in it, or has there been an effort to make it appear that more believe in it than actually do?
“I absolutely believe that is one of the things the other side has done. They trot out agencies like the American Meteorological Society. I’m a member of that society, but a small group within that society came up with a statement supporting the other side. None of this is science. It’s all aimed at the court of public opinion, which has nothing to do with science. So it all ends up being very political. Now I believe in conservation. Real conservation is always good. I ride a bicycle and I believe there are many things we can do in terms of conservation that make sense. But what I see more and more is these climate claims being used to justify insidious changes in energy policy. Some of these changes could have huge negative effects.”
CC. Another observation about stories claiming “70 percent of climatologists believe in man-made climate change” etc., is that the headlines might say “climatologists” but in the stories often only refer to “environmental scientists.” What’s an environmental scientist?
“Basically, I’d say they are people who have gone through environmental or ecological programs. I would consider it very soft science, as opposed to studies like meteorology, which is a hard science where you need to have to learn applied calculus and so on.”
CC. Do environmental scientists conduct experiments?
“I really doubt that they do.”
CC. Would you consider sedimentology to be a hard science?
“I’m not sure. I presume they’d need to have a degree in geology, so I’d say yes.”
CC. In Michigan about a decade ago environmental groups were claiming lake levels were falling in a manner that wasn’t normal. This actually resulted in legislation. At the time the leading Great Lakes lake level expert, Todd Thompson, senior scientist and sedimentologist at the University of Indiana-Bloomington, claimed the levels were exactly where they should have been, based on an overall 38-41 year cycle that could be traced back to beginning of the Great Lakes system. He even predicted that high (not low) water levels would be the problem by 2016. As the water levels have been rising, the issue has quieted down.
“I did something similar. In the 1990s there were claims that we’d seen the last of the snowpack in the mountains out here. I said it was about a 45-year cycle and things would change. Now the snowpack has been piling up and I’m glad I said what I did in the 1990s. It feels awfully good to be vindicated.”
CC. Are you upbeat about eventually being proven right about doubting man-made climate change?
“In the end I believe the evidence will show that I was right.”
CC. But will that be enough. Even if the evidence supports you, that doesn’t mean the politics of the issue would automatically change.
“I think the truth is coming out. Whether or not people choose to believe the truth is something I can’t do anything about.”
CC. To what extent did you feel like you were standing alone in resisting the man-made climate change theory back in the 1990s?
“It was difficult. I knew that many of my colleagues at the Association of State Climatologists agreed with me. But many of them wouldn’t say anything because they were worried about losing their jobs or just plain having their professional lives made difficult. Frankly there’s a lot more money supporting the other side. Things would be easier if you just go along with them.”
CC. “You’d say that now there’s a lot more money supporting the man-made climate change side of the issue than there is on the side of the skeptics?
“Oh yes, it’s been that way for a long time.”
by Jonathan DuHamel, Tuscon Citizen
This 96-page book is intended as a tutorial for journalists. The book is written by the Environmental Law Institute (ELI), a Washington, D.C.-based environmental advocacy organization.
The book covers most of the climate change issues and takes its science mostly from the U.N. IPCC Fourth Assessment Report, so it is hardly an objective science tutorial. Because the IPCC has been caught in some well-publicized errors, the book consumes several pages attempting to rationalize and downplay these errors.
The book seems to be written for a junior high-school level of comprehension which I presume is how ELI regards journalists lacking scientific training.
I found many apparent errors and contradictory statements in the book. I document some of them below.
On page 3, in their explanation of the Greenhouse Effect, ELI makes the common mistake of attributing the high surface temperature of Venus to the high concentration of greenhouse gases in the atmosphere. However, there is no greenhouse effect on Venus because sunlight cannot penetrate the thick atmosphere and reach the planet surface.
A more fundamental error is made on page 4 with the explanation of the Coriolis effect. “This is the force that causes wind to rotate clockwise around low-pressure centers in the Northern Hemisphere and counter-clockwise in the Southern Hemisphere.”
In the Northern Hemisphere, low pressure areas, such as hurricanes rotate counter-clockwise, not clockwise. A clockwise-rotating high-pressure dome brings Arizona its summer monsoon by drawing moist air from the Gulf of Mexico and Gulf of California into the State. The graphic to the left shows hurricane Katrina and its counter-clockwise rotation. Interestingly, ELI uses this same graphic on page 79. I guess the PhDs who wrote the first part didnt check with the PhDs who wrote the later part. You can see counter-clockwise rotation in videos of hurricane Rita here.
On page 11, we find these statements:
“A careful examination of the data in Figure 9 shows that CO2 increases precede temperature increases in Earths geologic history. Contrarians have used this to argue (incorrectly) that CO2 cannot be causing any warming.”
These two sentences are in conflict. Think about it. If the second sentence is true, then the first sentence should say that CO2 increases follow temperature increases. And, in fact that is the case. Throughout the larger geological history, there is no correlation between carbon dioxide and temperature. However, ice core data show that in the glacial-interglacial cycles, temperature increases are followed by carbon dioxide increases. Farther down the page ELI contradicts the first sentence in the paragraph above and says that temperature increases cause the oceans to give off CO2. That same sentence is also contradicted on pages 19 and 20. And, by the way, figure 9 shows radiative forcing, not temperature.
On page 63, journalists are told:
“Trust only peer-reviewed science.” But we found from Climategate that certain groups conspire to keep opposing views out of peer-reviewed journals, and that there are certain groups of scientists that review papers written by each other, hardly an objective review.
And:
“Build stories on consensus science, while recognizing that many areas of eventual scientific consensus originate as minority viewpoints.”
But the concluding chapter warns in a highlighted box: “It is critical for journalists to understand that the ‘he said, she-said’ style of reporting . is simply inappropriate for reporting on the science of climate change: it means giving equal voice to a tiny minority of opinions.” In other words, stick to the orthodoxy and ignore other views.
My note to journalists: Theories, no matter how widely held, can never be proven, only disproven by that lone minority voice who just happens to provide the critical piece of evidence.
Throughout the book, ELI repeats that current warming is caused mainly by carbon dioxide emissions from burning fossil fuels. But neither ELI nor the IPCC provide any physical evidence to support the contention that these emissions have a significant effect on global temperature.
The IPCC does make one cogent statement on the climate, but that statement does not appear in the ELI book:
“In climate research and modeling, we should recognize that we are dealing with a coupled non-linear chaotic system, and therefore that the prediction of a specific future climate state is not possible.” - Final chapter, Draft TAR 2000 (Third Assessment Report), IPCC.
The ELI book is available through Island Press books for $39.95.
My advice to journalists is to skip this book; it is more propaganda than science, and it will give you a false view of how the climate works.
For a free “tutorial” on climate science read my articles from the WryHeat blog:
Carbon Dioxide and the Greenhouse Effect
Your Carbon Footprint doesn’t Matter
The Assumed Authority a commentary on IPCC science and methods
A Basic Error in Climate Models
Climate Model Projections vs Real World Observations
How Mother Nature Fools Climate Scientists
Sea Level Rise in the South Pacific: None
Size matters in sea level studies
The State of our Surface Temperature Records
By P. Gosselin on 31. Juli 2011, No Tricks Zone
The European Institute for Climate and Energy (EIKE) has a story on the German Weather Service, and temperature trends for Germany, which are a good indicator for Central Europe.
Cooling in Germany has been accelerating (enlarged)
A few days ago the Deutscher Wetterdienst, DWD, (German Weather Service) in a press release warned that Germany’s temperature were likely to rise 2 to 4C by the year 2100 and that action was necessary. Like the Potsdam Institute for Climate Impact Research (PIK) the DWD too has been transformed into a propaganda mouthpiece for Germany’s powerful government-driven global warming movement.
But there’s a small problem at the DWD. Like the outlier sea level projections made by the PIK, the temperature projections made by the DWD just don’t match observations. For example Germany’s annual temperature over the last 11 years has shown COOLING, and not warming, see chart above produced by EIKE.
This has led scientists at EIKE to comment as follows:
“This casts the DWD’s credibility into question.” Sure many warmists will point to the latest press release issued by the DWD, which claims that the first 6 months of 2011 in Germany have been the second warmest on record.
But if the 2nd half continues on the same path as the July trend, then the DWD, may soon start find itself comparing quarter years, or even months to milk out any warming news from its statistics.
And in the meantime, in the real world, Germans will have to wait until 2050 or even 2100 for any real warming. The DWD should take a close look at what happened to the Met Office in England back when it tried to get into the global warming gig and so began issuing stupid press releases filled with fantasies and not meteorology.
By Joseph L. Bast, Heartland Institute President
Nature, the widely respected science journal, has a feature story and an unsigned editorial in its latest issue addressing The Heartland Institutes contribution to the global debate over climate change. The articles can be read (for free) at the following links here and here.
These articles are surely a sign that the debate is not over regarding the causes and consequences of climate change and what, if anything, should be done to alter the human influence on climate. But the articles themselves hardly do justice to our efforts, or the efforts of many scientists who are speaking out against the fake “consensus” that Nature itself has done so much to promote in its coverage of climate change.
Turning first to the feature story by Jeff Tollefson, titled “The Sceptic Meets His Match,” I’ve thanked Mr. Tollefson for an article that is, by and large, fair and accurate. He accurately summarizes my position, saying “he does not necessarily deny that humans are having an influence on the climate, but he does question the forecasts of catastrophic impacts and the rationale for curbing carbon emissions.” But there are some important errors and omissions we wish to correct.
Two of the five critics of our efforts he quotes are the worlds most notorious global warming alarmists who have made it their business to exaggerate the scientific certainty of climate predictions and the impacts of climate change, and to suppress academic debate and demonize skeptics. It’s no surprise they object to our calling them out. The third critic works for an organization started by and still run by President Bill Clinton’s former global warming advisor and Kyoto negotiator - no partisan bias there! Al Gore would be no less objective or credible a judge of our work than these three advocates. More about the remaining two critics in a moment.
The article implies we rely on a 1999 NASA study to argue for the existence of a natural “heat vent” over the tropics that cools the Earth as ocean temperatures rise. In fact, this discovery has been documented in a series of peer-reviewed studies, many of them reported in our 800-page report, Climate Change Reconsidered, and the controversy is being hotly debated in the leading journals today. We summarized and cited research questioning this discovery and its implications as well as seeming to confirm them.
One of the authors of the 1999 NASA study (the fourth of the five critics) is quoted as disagreeing with our interpretation of his findings. It is good journalism to report this, but it underscores a point I made repeatedly during the interview and make in all my writing on climate change, which is that most scientists working in this field “believe” in man-made global warming even though their own published work punches big holes in the scientific foundations of that belief. This is an important point.
It is easy to cry wolf and make scary predictions in presentations to Congress or even in classrooms, but scholars who do this often publish research that either contradicts basic tenets of alarmism or contains admissions of major gaps in knowledge that would be necessary to predict future climate conditions. Either this is hollow careerism and ought to be subject to public criticism, or it is cognitive dissonance - holding two contradictory ideas in your mind at the same time. If the latter, it is probably caused by the complexity of the issue (we must trust the judgment of scientists working in other fields to form opinions on subjects we are not ourselves expert about) and its close association with social and economic agendas (we want to believe something is true even if our own research suggests it is not).
Is this an outrageous claim or an attack on the integrity of working scientists? Absolutely not. It is a standard theme in many books on the history of science, dating back at least as far as Charles Mackay’s 1841 classic, Extraordinary Popular Delusions and the Madness of Crowds, and as recently as Mike Hulme’s 2009 tome, Why We Disagree About Climate Change. Hulme, not incidentally, is no skeptic: He contributes to the alarmist IPCC reports and works at the University of East Anglia (home of the Climategate scandal). Even he admits that his position is based on belief rather than scientific understanding and is inseparable from his partisan political beliefs.
Roger Pielke Jr., the fifth and final critic quoted by Tollefson, is admirable for his ability to stay suspended in mid-air for years between the two camps of alarmists and skeptics. One of these days, he’ll need to plant his feet in one camp or another, and because hes a good scientist, I believe it will be in ours. He is quoted characterizing Climate Change Reconsidered as “a big fat bowl of cherries.” The reference is to “cherry picking,” or citing only the scientific reports that support one’s point of view. But Climate Change Reconsidered has (I am told) 4,235 source citations. How many examples do we need of scientists writing in peer-reviewed journals admitting that the science doesn’t support claims of man-made catastrophic warming before we can conclude that skepticism, not alarmism, is the real position of most scientists? I think we passed that threshold hundreds or even thousands of citations ago. Frankly, it’s getting boring pointing this out over and over again. Only people who are blinded by ideology or careerism are still defending a hypothesis that has been soundly and repeatedly debunked.
Finally, contrary to Mr. Tollefson’s claim, I do not “dismiss” the findings of Bray and von Storchs latest international survey of climate scientists. In fact, I write about it because it demonstrates once again the extent of disagreement among scientists over the underlying science. Approximately two-thirds of the questions about the underlying science of climate reveal deep uncertainty or outright skepticism, even as 85 percent of the scientists who participated say they “believe” in AGW. So what questions help us get closer to the truth about climate change? Questions about the science, which the scientists actually understand and say is missing or contradicts alarmist predictions? Or questions about how they feel or what they believe about global warming? The right choice should be obvious, but good luck finding a reporter willing to ask these questions and make that choice.
Turning now to the unsigned editorial, titled “Heart of the Matter,” the difference in tone and rhetoric from Tollefson’s essay could hardly be greater. According to the editorial, The Heartland Institute’s conferences - which have drawn more than 2,000 scientists and other experts from some 20 countries - are “curious affairs,” “easy to lampoon,” “predictable,” and “absurdities.” Nature deigns to recognize us, we are told, only because “closing our eyes will not make the climate sceptics go away.” Well, they at least got that part right.
The editorial admits that Climate Change Reconsidered “is well sourced and based on scientific papers,” but complains it “makes many bold assertions that are often questionable or misleading, and do not highlight the uncertainties.” The complaint lacks any examples or substantiation, so it cannot be rebutted except to say “prove it.” But the irony should not be overlooked that it was Nature’s record of publishing misleading editorials and articles that hide uncertainties or make claims that cannot be replicated by other scientists that made publication of Climate Change Reconsidered necessary. If we err on the side of being too skeptical, it is only because we are trying to restore balance to a ship that is listing so far to one side that it is in imminent danger of capsizing.
Finally, the editors declare they are in pursuit of “a theory that can explain observations of the world,” whereas the skeptics seem content to point out gaps in that theory. “The Heartland Institute and its ilk,” they say, “are not trying to build a theory of anything.” Well, where to begin?
I am not a scientist, and it certainly is not my place to tell the editors of such an esteemed publication as Nature what they ought to be about. But it is my understanding of the scientific method that it proceeds by the falsification of hypotheses, not their defense by every means possible, which is what Nature and regrettably other leading science journals have resorted to in the case of man-made climate change. The goal ought not to be to defend a hypothesis, but to test it, and if it fails, to consider competing hypotheses and test those just as rigorously.
Nature, it seems to this nonscientist observer, has lost its way. Until the journal opens its eyes, it will not be a serious voice on climate science. Post here.
By Joseph D’Aleo , CCM, AMS Fellow, WeatherBell.com
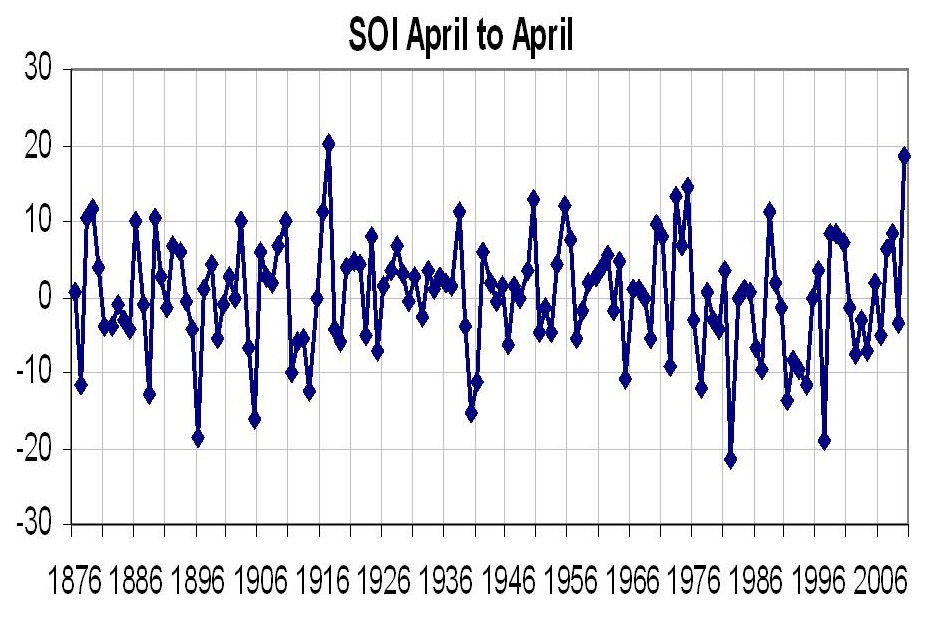
The southern plains drought, followed the second strongest La Nina (behind only 1917/18) according to the Southern Oscillation Index (SOI), an atmospheric pressure based measure (standardized Darwin, Australia versus Tahiti surface pressure). Positive values are La Nina, negative El Ninos. The April to April SOI showed the 1917/18 peak and 2010/11 close behind.
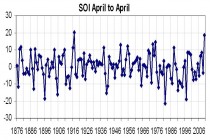
Enlarged.
1917/18 was a very cold winter, coldest La Nina on record. It wasdry in the winter and spring in the south and east. Like this year late in the winter it warmed in the southeast. Summer heat developed in 1918 in early August when Baltimore reached 105F on successive days, The drought in Texas that year ranked neck and neck with 2011. This past winter started out very cold even down to Florida (coldest ever December and January) and ended warm southeast February and March and now the late July heat wave.
----------------
Ironically check out this story on ChristChurch, NZ:Christchurch: second coldest day since 1918
Christchurch cold snap ‘shocker’ - Local News - Star Canterbury
Mrs Griffith said the country was in the middle of what was traditionally the two coldest months of the year but it was rare that Christchurch should experience the second coldest day since 1918.
Dumps of up to 30cm and 15cm were recorded around the city on Monday, with a maximum temperature of 1.9 deg C. It was the second coldest day since -1.2 deg C was recorded at the Botanical Gardens on July 21, 1918.
An event like this happens about once or twice in a century, said Mrs Griffiths.
-------------------
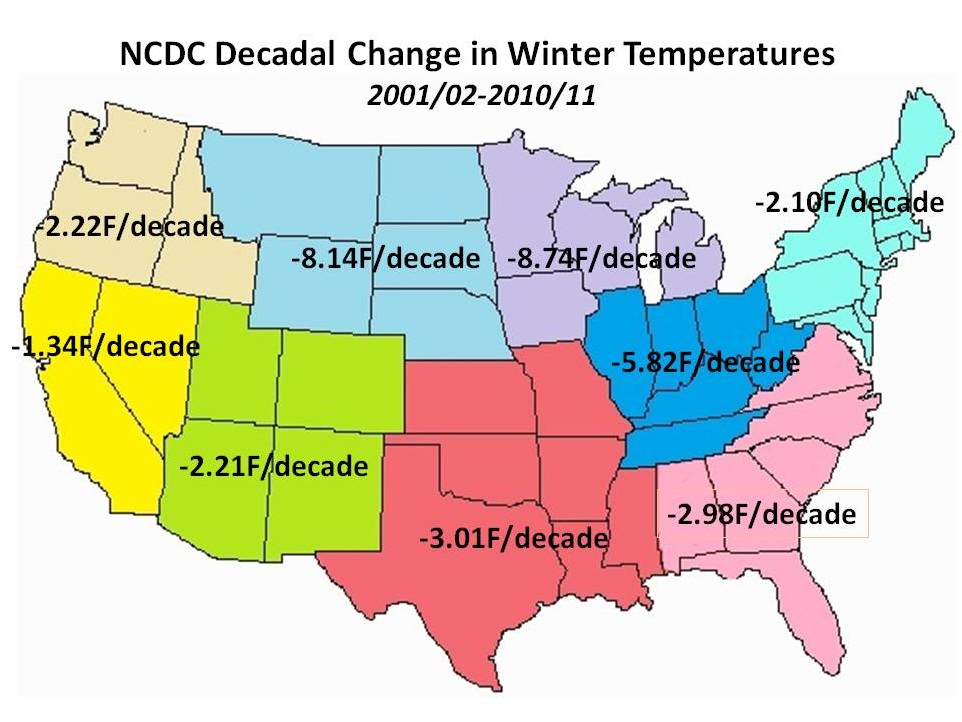
It was unlike 1917/18, very wet in the Ohio and Mid-Mississippi Valley and northwestern plains and Rockies where it left a deep snowpack. It might have been wetter because unlike 1917/18 the US was cooling not warming. The US has been cooling the last decade in winters.
Enlarged.
This cooling has enhanced the snowfall. 20010/11 ranked 3rd snowiest for the Northern Hemisphere behind 1977/78 and 2009/10 and just ahead of 2007/08. The last decade was the snowiest decade on record for the hemisphere as temperatures cooled.
Enlarged.
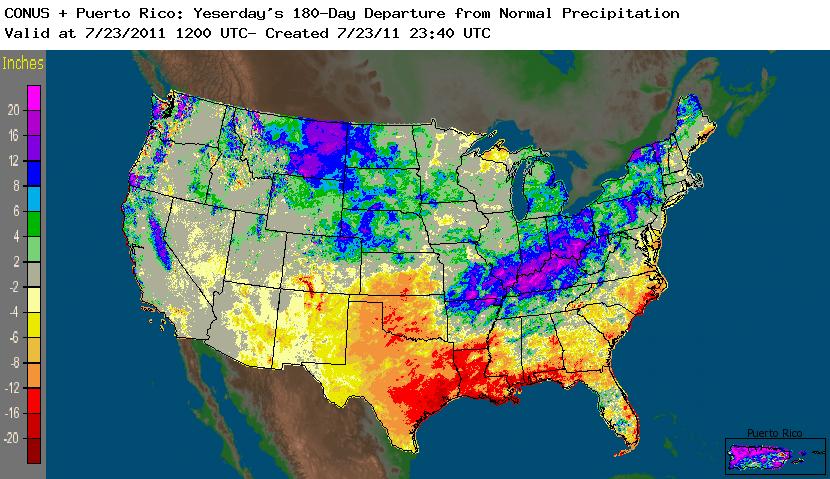
The deep snow in the north and dry warmth in the south enhanced the storm track and produced tornadoes in April and May (with April to big month) and a ton of rain along the Ohio and Mid Mississippi Rivers and also in the north on the Red and later the Missouri River. The flood on the Mississippi was worst since 1927. Many locations in the wet areas had surpluses of over 20 inches while in the dry areas of the south they had deficits exceed 20 inches for the 6 month period.
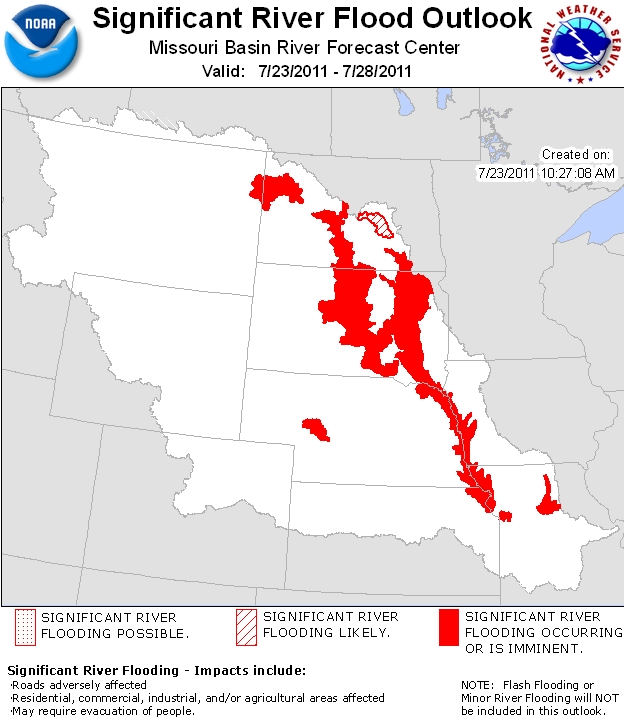
The Missouri is still in flood.
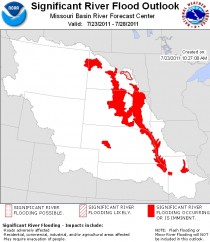
Enlarged.
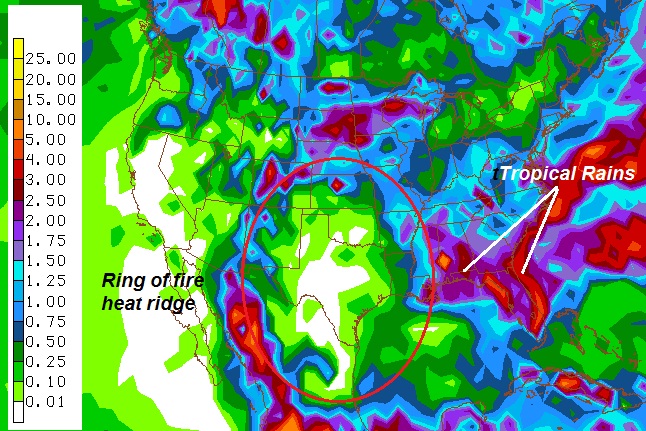
The heat wave that made the news this week was actually a result of both the dry and moist conditions.
Heat tends to build over drought areas like we saw this year in Texas and Oklahoma. Drought begets drought. Dry air precludes clouds, which allows for more sun which warms even more, a positive feedback. This process often leads to what forecasters call a heat ridge or mound of hot air extending far up into the atmosphere. Like a rock in a stream, much like a blocking high in high latitude it forces systems around it. The heat can get picked up by disturbances around the edges and feed instability and strong thunderstorm complexes. Forecasters refer to this as the ring-of-fire. It has operated for many weeks. Here is a picture of the ring-of-fire on July 8, 2011 as forecast by the GFS model. I could have picked most any day.
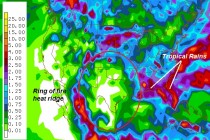
Enlarged.
When dynamic factors like cool air diving south off the west coast where they have a year without a summer has a compensating downstream push north of warm air. This hot air moves over saturated or even flooded fields and lush vegetation. The plants like us humans transpire moisture from their stomata in the leaves (like pores in our skin). This process is an attempt to cool the plant and our body. That process raises the dewpoint (a measure of actual moisture contenjt) in the air. This makes hot temperatures even more uncomfortable.
The NWS has been stressing the heat indices justifiably so just as they do the wind chill in winter because that affects how a person feels. When the air is dry and body or plant is able to easily evaporate moisture, it can stay cooler. To enter the vapor state, the moisture needs heat and extracts it from the evaporating surface- the leaf or you skin. That process can dehyrdate the soil moisture and your body. On a very hot day, soils can lose up to a third of an inch a day. When it is very humid, this mechanism is less effective. Likewise on cold days in winter when the winds blow, they strip away air molecules warmed by contact with your skin and make you feel colder.
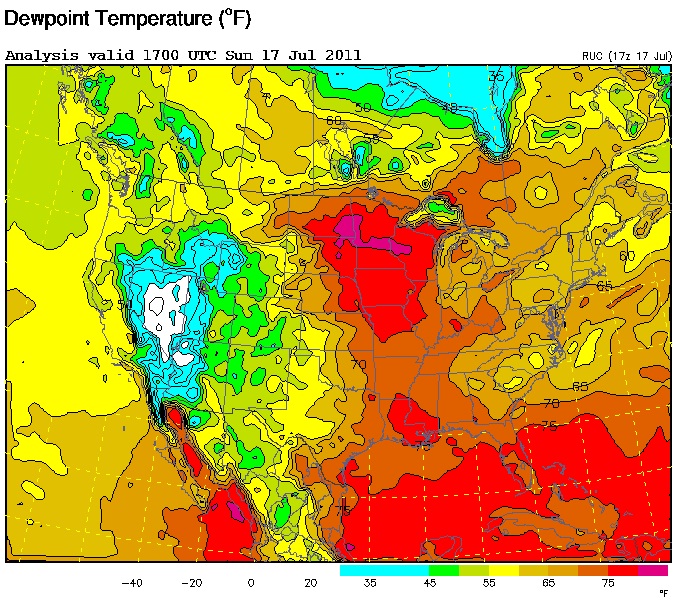
In Morehead, MN, the dewpoint when temperature last week rose to 93F rose to an incredible 87.8F. That made the heat Index 134F, equivalent to the US temperature record set in Death Valley in 1913. But it wasnt 134F, it just felt that way according at least to this one index. The dewpoint is shown below - purple is over 80F. Some media headlines and cable nitwits said it was 123 or 134F in MN.
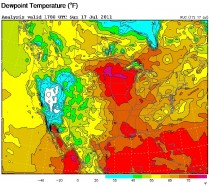
This led to elevated nighttime temperatures. In fact 72.5% of the record highs (and 65% of all record temperatures) set the last 8 days were not highest maximum temperature but highest nightttime low temperatures.
How does this translate into the record heat in the east Friday?
Well Friday, that air mass came east. Not only was it warm to begin with but the convection to the west added latent heat to the air as the rising air condensed into clouds and precipitation. When that super warm air aloft got carried east on strong west to northwest winds and subsided downslope from the mountains it warmed even more by compression - about 10F. Sinking and warming cleared out any clouds and haze and enhanced the solar factor. The eastern big cities all get the 100F days when wind are blowing downslope.
In a more typical summer, when the Bermuda high is dominant, the cities suffer the dog days of summer - triple H weather - hot, hazy and humid upper 80s to low 90s. Hot and sticky but not record setting. Often on those days the sea breeze kicks in along the coast as southwest winds turn more southeast from the cooler water. In the strong west to northwest wind case, that sea breeze is shut off. That same heat ridge in the south central has suppressed the Bermuda high by causing downstream trough off the east coast. That explains the many fine days in the east in between the taste of heat in early June and the 3 day heat wave in late July.
Heavy thunderstorms have continued in the ring of fire area this week as the heat eased. Chicago set a record with 6.86 inches of rain at Ohare Saturday. That turned a dry July into the second wettest on record and likely to become the wettest July with more showers expected this week. Only 0.54 inches is needed.
By Steve Goddard, Real Science
From http://thinkprogress.org/As Oklahomans Die, Inhofe Mocks Killer Heat Wave
By Brad Johnson on Jul 22, 2011 at 3:20 pmThe heat wave now battering much of the nation is centered on Oklahoma, where record heat and drought have crippled the state for the entire summer. With August on the way, there is no end in sight. The prolonged heat - Oklahoma City has been above 100F for 30 days this summer - has probably killed over a dozen Oklahoma residents:
The oil-rich state is also the epicenter of global warming denial, led by its senior U.S. Senator, Jim Inhofe (R-OK). The oil-funded senator has a long history of finding humor in the misery caused by extreme weather disturbed by greenhouse pollution, including the record snowstorms of this winter. This deadly heat wave is no exception.
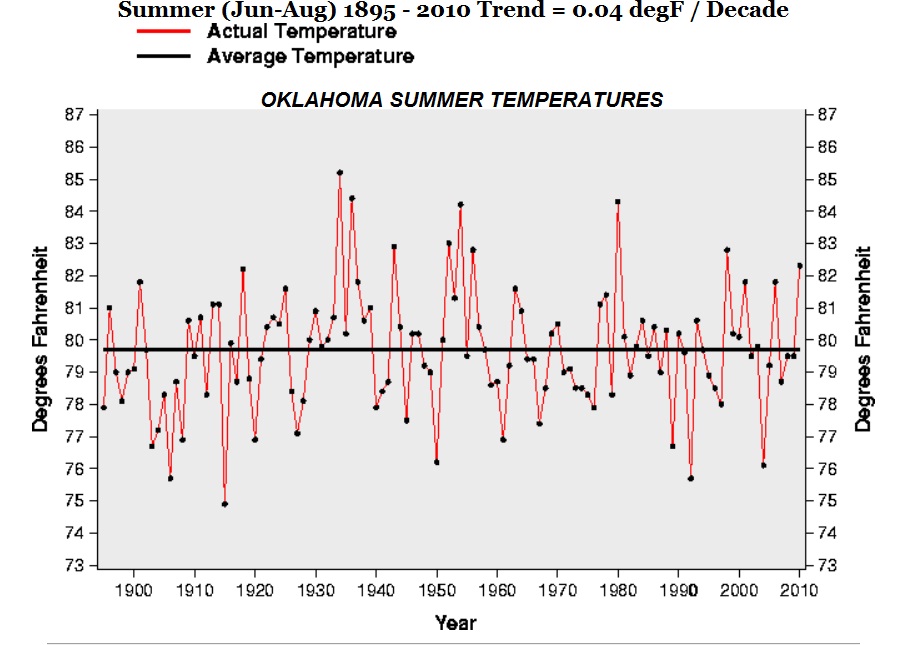
The closest USHCN station to Oklahoma City is at Meeker. This July, the average high temperature has been 102.
In July, 1936, the USHCN average high temperature in Meeker was 104. August, 1936 averaged 106. CO2 was 310 ppm at the time. Hundreds of people died.
July 1913 - 103 degrees. July 1934 - 104 degrees. July 1954 - 103 degrees. July 1980 - 103 degrees. Five years had higher temperatures and all were below 350 ppm.
Team AGW are classic witch burners. They imagine a problem and then find someone to blame it on.
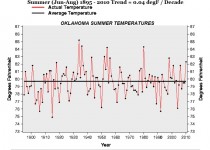
Enlarged No trend in summer.
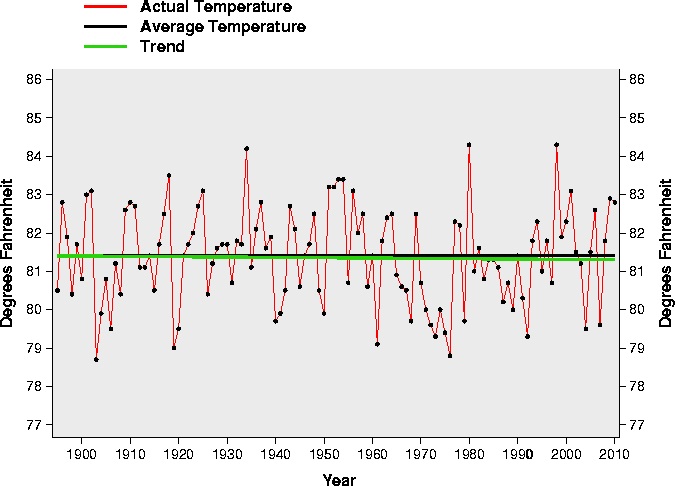
Nearby Texas.
Enlarged No trend in summer.
By Joseph D’Aleo, CCM, AMS Fellow, WeatherBell Co-Chief Meteorologist
June temperature and precipitation rankings are in.
Enlarged. Warmest in Texas, Second warmest in Oklahoma.
Enlarged Driest in New Mexico. Fourth driest in Oklahoma. Fifth driest in Texas. Wettest in California.
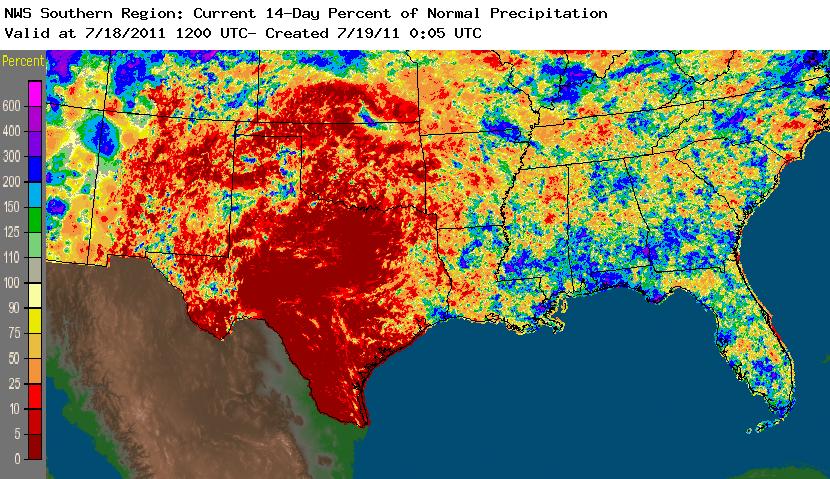
Texas and Oklahoma has felt the brunt of the 14 state drought that has plagued the south this past winter and into the summer. Almost 20% of the United states is said to have been affected by drought.
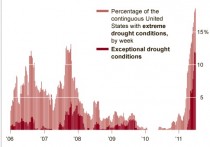
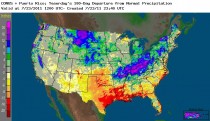
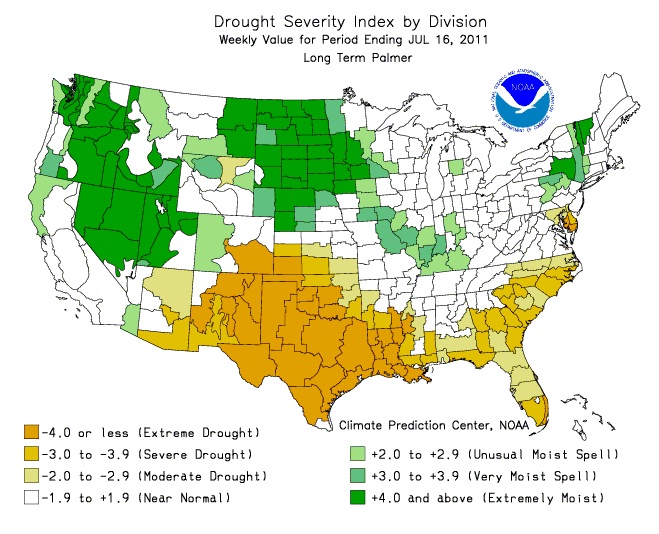
The traditional Palmer Drought Severity Index through Saturday looks like this.
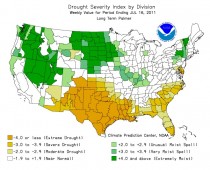
Slow improvement has occurred further east along the Gulf Coast and in the desert southwest as seen in this shorter term drought blend. More rains have fallen since the 9th in Louisiana.
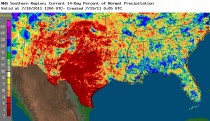
The precipitation anomalies in the last 14 days from Louisiana east have been in many areas well above normal, making a dent in the drought. Reportedly up to 13 ionches fell in parts of Lourisiana in the latest heavy rains. Little help has come to most of Texas.
In an earlier post we showed how since south central drought relates to the strength of La Nina in the prior winter and this winter ranked the second strongest on record, a severe Texas drought is not surprising.
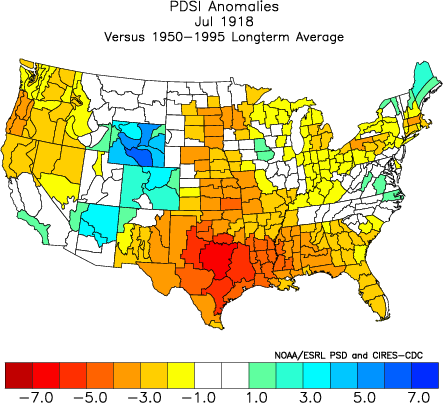
Here was the Southern Oscillation Index (SOI) since 1876. The only strong La Nina from this atmosphere ENSO emasure was in 1918.
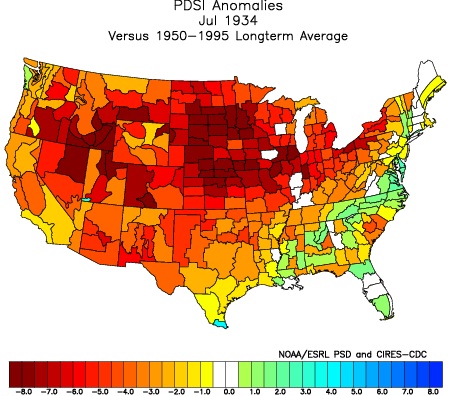
Here was the Palmer Drought Severity Index in July 1918.

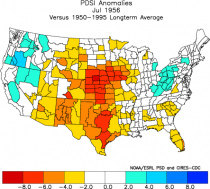
The Multivariate Enso Index or MEI bottomed out in 1956, the only period sincce 1950 with a stronger La Nina. Here was the Palmer Drought Severity Index in July 1956
Compared to the near 20% of the country in serious drought, the 1950s when up to 60% was affected and especially the 1930s when 80% of the United States felt the effect of drought and heat.
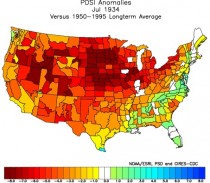
The 1930s drought peaked in 1934. the drought was centered further north in 1934.
Though the heat wave has spread into the wet areas further north this week creating a literal sauna, the rains and cooling will return there n the next 8 days but the drought will persist in parts of the southern plains. The next 8 day total rainfall shows this. The heat ridge ring of fire is very evident actuyally shrinking a bit as some showers coming to the southern parts of Texas.
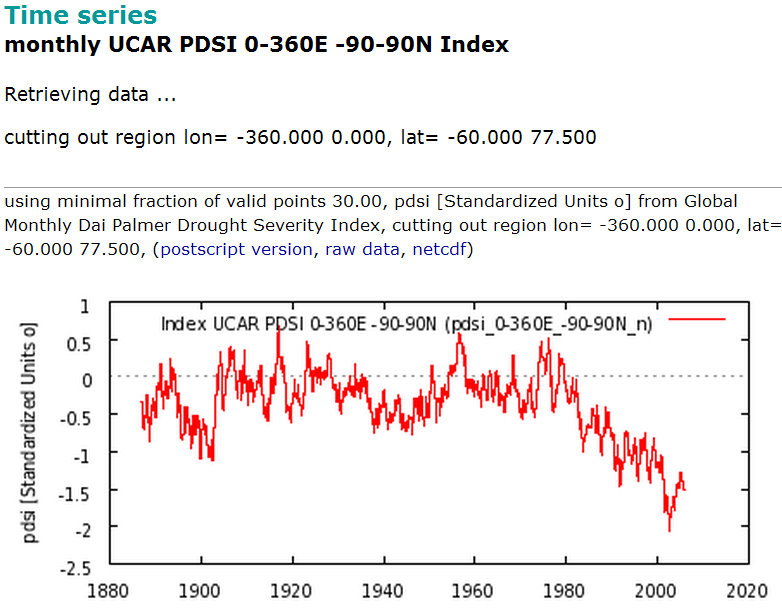
A plot of the worldwide data for the Palmer Drought Severity Index shows that there has been an unprecedented decrease in world drought severity over the past 30 years, possibly due to the plant enhancing increase of CO2.

Enlarged H/t Hockey Stick for this graphic.
Co Chief Meteorologist Joe Bastardi and I post everyday on weather and climaate issues on WeatherBell.com. For the hobbyiests, our premium blog has daily posts like this and daily Weatherbell blog and FOX Business videos and access to model and other data. We both focus on the short, medium and long range weather and climate and our insight may help your business and personal planning. In our commercial section we have daily special reports for energy, agriculture, hedge funds and retail markets with outlooks for 20 days, months, and seasons. Please help us build that business. If you enjoyed Joe Bastardi’s posts and videos and Intellicast’s Dr. Dewpoint, this blog is for you.
MILLBROOK—Michael Mann has felt the heat for being part of the international scientific consensus behind man-made climate change.
For a decade, the soft-spoken 45-year-old physicist, who runs the Earth System Science Center at Penn State, has been a self-described lightning rod for those opposing science that shows fossil fuel emissions are causing the planet to gradually warm.
“There is an orchestrated denial machine for climate change. Science is on a collision course with powerful vested interests,” Mann said during a packed lecture Friday at the Cary Institute of Ecosystem Studies.
In 2001, Mann published a report that showed temperatures have risen dramatically during the previous two decades compared with the previous 1,000 years—which included a temperature chart known as the “hockey stick” because of its distinctive shape.
Mann’s work is part of the 2007 Intergovernmental Panel on Climate Change, a report incorporating the work of thousands of scientists, which concluded that rising emissions of carbon dioxide, a gas released by combustion of coal, oil and natural gas, were behind an increasing greenhouse effect.
Now, conservative commentators repeatedly attack Mann by name, causing his email inbox to swell with angry messages accusing him of being a liar and a fraud. The attorney general of Virginia, who denies climate change, is investigating Mann’s past work at the University of Virginia. A conservative think tank is trying to obtain practically every word Mann has written or received during his six years at Penn State.
Mann also found himself swept up in the 2009 hacker theft of emails from an English climate science center, where opponents claimed the messages proved a massive global conspiracy by scientists to fake data.
That contention has been disproved by four separate investigations, including by Penn State and the British House of Commons.
A decade after the “hockey stick” chart was published, Mann said observations from around the globe continue to support ongoing climate change. Average global temperatures have risen for three consecutive decades. Average snowfalls continue to decline and glaciers around the world keep melting.
While some contrarians claim Earth is warming because the sun is getting stronger, the temperature of the upper atmosphere is dropping, while the lower level atmosphere warms, which Mann called the “fingerprint” for the man-made greenhouse.
Last month, the American Association for the Advancement of Science. a 163-year-old national scientific body that includes more than 260 groups, defended Mann and other scientists from “personal attacks” meant to “harass and intimidate.” The group warned that such attacks “could well have a chilling effect on the willingness of scientists to conduct research.”
In Pennsylvania, Mann’s university records are being sought by a group called the American Traditions Institute, a conservative think tank headed by members of other conservative groups that claim global warming is a fraud—the Competitive Enterprise Institute and the Cooler Heads Coalition.
Both groups are funded by Koch Industries, the nation’s largest privately held corporation, owned by two conservative Kansas petrochemical billionaire brothers, Charles and David Koch. Another Koch-affiliated organization, Americans for Prosperity, which works closely with the tea party movement, is suing to bounce New York out of a greenhouse gas control program, the Regional Greenhouse Gas Initiative.
Read more.
ICECAP REPLY:
Mann’s work has been totally discredited. Only has cadre of grant toting scientists agree with him and some of his friends have replicated his bad work using the same flawed methods and data. That is not science. Eminent climatologist H.H. Lamb a real scientist had reconstructed with the help of proxxy data compiled by many researchers the past global temperatures. It was used in the IPCCC reports I and II.
before Mann gave them the excuse to ‘get rid of the medieval warm period” as one IPCC lead author requested. See Bishop Hill or Climate Auidt for much more on how Mann has abused the ‘science’.
As for the other claims:
Here in the NOAA Northern Hemisphere winter snow (compiled by Rutger’s snow lab) the last 3 decades.
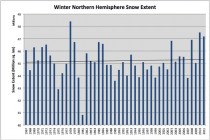
Behind the top year 1977/78 is 2009/10, 2010/11 and 2007/08. The trend is up. With the record snows in many mountain areas, many glaciers are advancing not retreating.
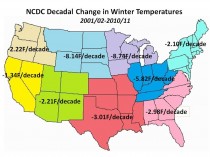
Here are NOAA winter temperature tends in the last decade in the US (below, enlarged). See Pat Michaels on the recent 15 year cooling trend here.
See why the arctic changes are cyclical and natural here.
By Patrick J. Michaels, Forbes
There is no statistically significant warming trend since November of 1996 in monthly surface temperature records compiled at the University of East Anglia. Do we now understand why theres been no change in fourteen and a half years?
If you read the news stories surrounding a recent paper in the Proceedings of the National Academy of Sciences by Boston University’’s Robert Kaufmann and three colleagues, you’d say yes, indeed. It’s Chinas fault. By dramatically increasing their combustion of coal, they have increased the concentration of fine particles in the atmosphere called sulphate aerosols, which reflect away solar radiation, countering the warming that should be occurring from increasing atmospheric carbon dioxide.
Further, if this is true, then (as is usual in climate-world), “it’s worse than we thought”. After all, China will eventually reduce their sulfate emissions as their population becomes affluent enough to demand something better than miasmic air. Indeed, they are already beginning to clean things up, and when they finally do, all the cooling particles will be gone and the earth will warm substantially.
Reality may be a bit simpler, or much more complicated. But the reason this is all so important is that if there is no good explanation for the lack of warming, then an increasingly viable alternative is that we have overestimated the gross sensitivity of temperature to carbon dioxide in our computer models.
One problem is that we really dont know how much cooling is exerted by sulfates, or whether they are just a convenient explanation for the failure of the forecasts of dramatic warming. The United Nations’ Intergovernmental Panel on Climate Change, which grants itself climate authority, states that our “Level of Scientific Understanding” of the effects range between “low” and “very low,” with a possible cooling between zero (none) and a whopping 3.5 degrees (C) when the climate comes to equilibrium (which it will never do). That’s a plenty large range from which to pick out a number to cancel about as much warming as youd like.
Kaufmann’s team looked into how sulfate uncertainty impacted its results and decided that it was relatively minor. However, we can’t find any independent test showing that the geographic “fingerprint” of a dramatic recent increase in sulfate cooling is actually being observed. More on this in a minute.
The other problem - and climate flatliners hate me for pointing this out - is that the beginning of the period of “no warming” includes the warmest year in the instrumental record, caused by the great El Nino of 1997-1998. In a modestly warming world, starting off at or near an anomalously high point pretty much assures little or no warming for years afterward.
Kaufmann’s team (and others) have duly noted that El Nino cycles are one factor partially responsible for the lack of recent warming. There’s little doubt of this. Further, if you back out solar changes and volcanism, as they did, you can convince yourself that there is still an underlying “residual” warming trend, but it is masked by all these variables. This has been done repeatedly in the scientific literature, which, until now, did not include increasing the sulfate effect on recent temperatures.
Where is the test of the hypothesis that sulfates are indeed responsible for the lack of warming? In this paper, it’s simply “modeled-in” as it fits the data well. That’s correlation, not causation.
There is very little exchange of air between the northern and southern hemispheres, and basic climate science shows that most sulfates from China will rain out before they get across the thermal equator. In fact, there is a great deal of literature out there published by luminaries like the Department of Energy’s Ben Santer and NASA’s James Hansen claiming relative cooling of the northern hemisphere from sulfates, compared to the southern.
So, if it is indeed sulfates cooling the warming, given that there is no net change in global temperature, then the northern hemisphere should be cooling since 1998 (the first year in Kaufmann’s paper) while the southern warms. Here are the sad facts:
The opposite is occurring. Why this test was not performed eludes me. Perhaps that is because it provides yet another piece of evidence supporting the hypothesis that we have simply overstated the sensitivity of surface temperature to changes in carbon dioxide.
Patrick J. Michaels is Senior Research Fellow for Research and Economic Development at George Mason University and author and editor of “Climate Coup: Global Warming’s Invasion of our Government and our Lives.”
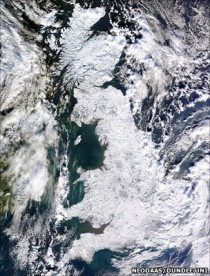
IT’S all white for this year’s ski season, with fresh snow falls breaking records and reaching depths of up to 1.6m at some resorts.
The resorts are experiencing the deepest snow in the first week of July since 1990, with 158.9cm recorded at Thredbo and 13 of its 14 lifts in operation.
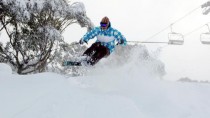
Perisher has had one of the best starts to a ski season in nearly 20 years, with 62cm of fresh snow recorded in the past few days and the snow depth also reaching 158.9cm yesterday.
“This season is shaping up to be one of the best in decades with the snow depth at Perisher officially reaching 158.9cm today,” a Perisher spokesperson said. “Not since 1990 have we seen such a snow depth at this time of the year.”
There are wind-drifts up to 3m deep in places across all four resort areas, and the Interceptor Quad Chair is set to make its season debut this weekend.
Meanwhile Charlotte Pass has also recorded 158.9 centimetres of snow, with three of their five lifts in operation.
In Victoria, Falls Creek is currently just below the one metre mark and more snow is falling, with 72 centimetres of snow recorded in the past three days.
It has 11 lifts in operation, and more terrain is expected to open as more snow falls.
“It is one of the best snowstorms we’ve had since last August providing an amazing amount of snow. It’s soft and dry and kids are having a ball,” Falls Creek’s PR Manager Debbie Howie said.
Mt Hotham Alpine Resort has more good news to report after receiving an extra 31cm of snow yesterday, bringing its snowdepth total up to 98 centimetres.
It will be opening the entire mountain this weekend, including four lifts which didn’t open until mid August last year.
The Bureau of Meteorology is predicting snowfalls until Tuesday, so there’ll be plenty of the fresh white stuff to enjoy.
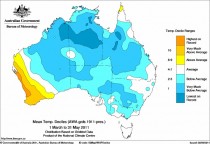
This comes on the heels on the coldest autumn in Australia in at least 60 years.
Climate scientists in the consensus camp are scrambling to find a reason for the slowing of the global temperature rise in the last decade. According to their models, in which climate sensitivity is very high and positive feedbacks rule, temperatures should have continued rising with CO2.
Solar effects are to all intents and purposes ignored, since as the IPCC states in AR4, changes in solar irradiance are too small to affect the climate, and other methods such as cosmic ray modulation are “controversial” [translation: they don’t fit our agenda - Ed]. So they are simply glossed over.
Just yesterday, we read that the additional aerosols from burning coal have “offset” the greenhouse warming over the past decade and are actually cooling the planet, and today, we read that solar effects may cause UK winters to become colder, as the BBC reports:
Britain is set to face an increase in harsh winters, with up to one-in-seven gripping the UK with prolonged sub-zero temperatures, a study has suggested.
The projection was based on research that identified how low solar activity affected winter weather patterns.
However, the authors were keen to stress that their findings did not suggest that the region was about to be plunged into a “little ice age”. [Note the essential caveat - don’t anyone start thinking this is some kind of global effect - Ed]
The findings appear in the journal Environmental Research Letters.
“We could get to the point where one-in-seven winters are very cold, such as we had at the start of last winter and all through the winter before,” said co-author Mike Lockwood, professor of space environment physics at the University of Reading. (source)
Average temperatures for the past three winters have been colder than the previous three decades
There is a clear double standard at work here. The IPCC and the consensus scientists are terrified of investigating solar links to climate change too closely, since it may blow their CO2 driven cash cow out of the water. In their book, virtually none of the current warming is linked to increased solar activity or other solar-related phenomena, it’s all down to man-made CO2. That’s despite the fact that by their own admission, the level of scientific understanding of forcing by solar irradiance is “low” and that of cosmic rays “very low” [translation: “virtually zero” and “zero” - Ed].
But suddenly, as soon as there is a need to find a reason for cooling, the fog clears, as it were, and they invoke the sun as a cause.
------------------------------------------------------------------
See this video featuring Roy Spencer Why the Global Warming agenda is Wrong.
By Dr. Anthony Lupo
On July 1, NOAA’s National Climatic Data Center (NCDC) released the new 1981-2010 normals for weather and climate recording stations across the United States [1], and it was no surprise that these normals were, in general, warmer than the 1971-2000 normals. While global temperatures and US temperatures have leveled off or have begun to trend downward since their late 1990s high, the decade of the 2000s was warmer than that of the 1970s. Thus, it is no surprise that across the US, and as acknowledged by the NCDC director, these new normals are roughly 0.5F warmer than the 1971-2000 normals. But, this does not mean they were uniformly higher everywhere as an examination of Californias temperatures demonstrates [2].
These 30 year normals are derived in order to provide the general public with a baseline reference for what is typical for variables such as temperature using a recent period and definition of climate. The classical definition for what constitutes climate is 30 years, and this can be found for example on the World Meteorological Organization (WMO) website [3]. This is a long enough period so that year-to-year and even interannual variations do not influence the baseline, and it is not too long relative to human life spans.
Even though the warmer 1981-2010 was not a surprise to climate scientists, media outlets reacted to the news predictably. For example one major newspaper [4] led their story with the statement; ‘The new normal is warmer’. In their story, they interviewed two scientists who confirmed the narrative that these warmer normals are a smoking gun showing that global warming is here and happening. One scientist said this was evidence for it, and another said “It means a lot of global warming is built into the new normals”.
To be fair, the article also interviewed Dr. Tim Ball, who is a leading climate skeptic. He points out that comparing the numbers themselves within two consecutive 30year periods can be misleading since trends within each can be different. Additionally, NOAA has issued these normals since 1956 beginning with the 1921-1950 period. Thus, these numbers could be checked back further in time rather than jumping to the conclusion that the new normals are evidence of global warming.
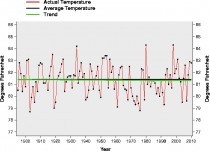
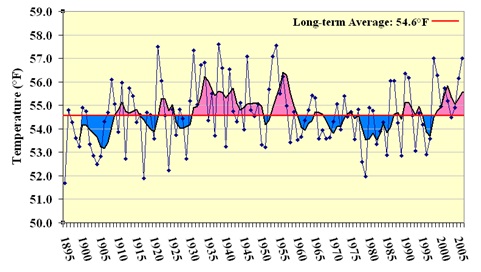
Using the data for my own location in Missouri was not difficult. An examination of Table 1 and Fig. 1 will demonstrate that the 1981-2010 normals overall are about 0.4 F warmer here than the 1971-2000 values, which is consistent with the NOAA finding for the US in general. But, going back further time will demonstrate that for my location, 1981 - 2010 has yet to catch up with the first 30 year products that came out historically (1921-1950, and then 1931-1960). Global warming indeed! But, this shows the impact that the warm 1930s had on these early products. Many skeptics like Dr. Ball have pointed out for a long time that the 1930s were at least comparable to recent years in the United States.
Additionally, examining Table 1 and Fig. 1 demonstrates that these running 30 year periods do act in a mathematical sense as a data filter, but one that may produce a ‘trend’ out of phase with reality. This is the essence of Dr. Ball’s comment. For example, the first two periods in Table 1 give the same average, but by 1930, temperatures were clearly on the rise (Fig. 1). Thus, these 30 year averages lag behind shorter term trends. This can also be seen by comparing the data for the 1921-1960 period in Table 1 and Fig. 1. The second 30-year period was slightly warmer in spite of temperatures trending downward in the 1950s. Additional basic information about these 30 year normal products can also be found on the “Watts up with that?” Climate information website[5].
In light of the fact that temperatures during the 2000s have leveled off or begun to fall, it is not surprising that the new normals have yet to catch up to this fact. Thus, the new 30 year normals cannot be used as evidence for global warming.
Table 1. The 30 year annual “normals” for Columbia, MO from 1890 - 2010 to the nearest 0.1F.
Period Annual Means (F)
1891-1920 54.3
1901-1930 54.3
1911-1940 55.1
1921-1950 55.4
1931-1960 55.6
1941-1970 55.0
1951-1980 54.5
1961-1990 54.2
1971-2000 54.2
1981-2010 54.6
Figure 1. Enlarged. The mean annual temperatures (F) for the state of Missouri versus time (years). (Produced by the Missouri Climate Center)
References:
[1] Leslie, J, 2011: NOAA: Average U.S. temperature increases by 0.5 degrees F. NOAA Press Release, 29 June, 2011.
[2] Fimrite, P., 2011: CA climate: inland warmer; coast cooler and wetter. San Francisco Chronicle. 6 July, 2011.
[3] World Meteorological Organization
[4] Rodriguez, A., 2011: NOAA report shows warmer weather in U.S. Los Angeles Times. 30 June, 2011.
[5] Anthony Watts Commentary on Climate Change and more.
By Patrick J. Michaels, Forbes
Almost every major American daily newspaper picked up an article published earlier this month by New York Times scribe Justin Gillis entitled “A Warming Planet Struggles to Feed Itself.”
How many times have we read, in the last 50 years, that this or that environmental apocalypse is going to starve the world? I got my doctorate on the wings of one; at that time it was called “global cooling,” after a 1974 CIA report leaked to the Times said that rapidly cooling planetary temperatures could usher in an era of heightened global instability caused by food shortages.
In my lifetime there have been a large number of predicted nutritional apocalypses, caused by overpopulation, lack of biological diversity in our food supply, genetic engineering run amok, acid rain, too little ozone, too much ozone and, finally, global warming. If there were futures on the end of the world, I’d go short. The wrong bet won’t matter anyway.
Facts: Global surface temperature rose about three-fourths of a degree Celsius in the 20th century. U.S. corn yields quintupled. Life expectancy doubled. People got fat. Global warming didn’t cause all of this, but increased atmospheric carbon dioxide directly stimulated plant growth. Further, greenhouse warming takes place more in the winter, which lengthens growing seasons. With adequate water, plants then fix and yield more carbohydrate.
While doing my dissertation I learned a few things about world crops. Serial adoption of new technologies produces a nearly constant increase in yields. Greater fertilizer application, improved response to fertilizer, better tractor technology, better tillage practices, old-fashioned genetic selection, and new-fashioned genetic engineering all conspire to raise yields, year after year.
Weather and climate have something to do with yields, too. Seasonal rainfall can vary a lot from year-to-year. That’s “weather.” If dry years become dry decades (that’s “climate") farmers will switch from corn to grain sorghum, or, where possible, wheat. Breeders and scientists will continue to develop more water-efficient plants and agricultural technologies, such as no-till production.
Adaptation even applies to the home garden. The tomato variety “heat wave” sets fruit at higher temperatures than traditional cultivars.
However, Gillis claims that “[t]he rapid growth in farm output that defined the late 20th century has slowed” because of global warming.
His own figures show this is wrong. The increasing trend in world crop yields from 1960 to 1980 is exactly the same as from 1980 to 2010. And per capita grain production is rising, not falling.
Gillis more rightly could have blamed any loss in per capita consumption on the stupid (I choose my words carefully) global warming policy that greens once touted: ethanol production from corn.
Even Al Gore now admits that corn-based ethanol produces more carbon dioxide than it saves. But as a result of recent ethanol policy, we are the first nation in world history to burn up its food supply to please a political faction.
Indur Goklany, a much-published scholar on the consequences of global warming policies, recently calculated that in 2010 alone, diversion of grain to biofuels (like ethanol) caused nearly 200,000 excess deaths in the developing world because of increased prices.
Roger Pielke, Jr., another noteworthy student of global warming science and policy, concurs. Regarding Gillis’ piece, he says: “The carbon dioxide-centric focus on the article provides a nice illustration of how an obsession with global warming can serve to distract attention from factors that actually matter more for issues of human and environmental concern.”
Ever since people noticed how robust the increase of crop yields is, others have been saying that it must soon stop. This “limits to growth” argument is as tired as a farmer at the end of harvest. Two weeks ago, it was announced at the Global Wheat Rust Symposium that scientists are now producing “super varieties” of pathogen-resistant grain, which will tack another 15% onto yield. As the new strain is adopted, it will continue the linear upward trend in wheat yield for at least another decade.
I continue to be amazed at how little the facts are checked on global warming, even when writing for the so-called newspapers of record. Crop yields have increased at a constant rate despite changes in global temperature. Per capita grain production is going up, and stupid policies - not global warming - are putting people’s food security at risk.
Patrick J. Michaels is Senior Fellow in Environmental Studies at the Cato Institute and author of Climate Coup: Global Warming’s Invasion of our Government and our Lives.