Apr 27, 2009
Dr. Leonard Weinstein (former NASA Senior Research Scientist) Shows How AGW Is Not A Problem
By Marc Morano, ClimateDepot.com on GlobalWarmingHoax post
Dr. Leonard Weinstein worked 35 years at the NASA Langley Research Center, finishing his career there as a Senior Research Scientist. Dr. Weinstein is presently a Senior Research Fellow at the National Institute of Aerospace. He is now a critic of the anthropogenic theory of global warming. His analysis shows that man has contributed less than 0.3C of warming and by the year 2100 may contribute less than 0.4C additional warming. This is much less than what the United Nations IPCC has predicted and of course a small fraction of what alarmists such as Al Gore and James Hansen have predicted.
Below is a summary of Dr. Weinstein’s work, we highly recommend you follow the links to read the complete papers. His work is compelling and is yet one more example of a prominent scientist that disagrees with the anthropogenic theory of global warming.
“Preparing for the possibility of an impending ice age along with the possible consequences of a reduction in Earths magnetic field are real concerns. Concern with relatively small effects of possible anthropogenic caused global warming is a misplaced distraction, and will probably lead to the public losing confidence in scientists, and could weaken the support needed when real problems occur.”
“Decreasing availability of oil and anthropogenic pollution (not greenhouse gasses) are real issues. Acid rain, smog, and dirty water sources do need to be fixed. The problems associated with high fuel prices, and dependence on sources of energy from possibly less than friendly foreign countries are critical. While we cant solve the problems with a single magic bullet, more nuclear power plants, along with wind and Solar power, could fill much of the gap. There are solutions, but first we have to identify the correct problems.”
Leonard Weinstein received a B.Sc. in Physics in 1962 from Florida State University. He started work at NASA Langley Research Center in June 1962. While at Langley, Leonard obtained his Master and Doctor of Science degrees in Engineering from the George Washington University. He continued to work at NASA Langley until June 2007, ending as a Senior Research Scientist. Dr. Weinstein is presently a Senior Research Fellow at the National Institute of Aerospace Read full paper here.
Apr 27, 2009
92F New York City in April Portends a Coolish U.S. Summer
By Joseph D’Aleo
Temperatures leaped to 92F at Central Park today as a storm developing over the central pumped warm air east. The air was very dry as vegetation is still mainly dormant. A cooling sea breeze quickly cooled the city but most inland areas stayed in the low 90s. Another very warm day or two are expected this week before wetter cooler weather comes east.
One of the warmest days occurred in April 1976 when it reached 96F in New York City on the 18th of the month. It also reached 90F in 1977. How unusual is that. Well it is pretty common actually in the last half of the month.
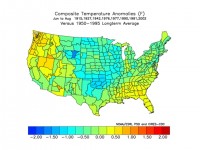
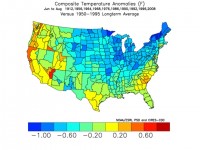
Empirically most forecasters have observed early heat seems often to be followed by seasonable to cooler temperatues in the following summer for the United States. I looked at the years with 90F in New York City in the last century.
Here is what the summer for the United States temperaturewise looked like.
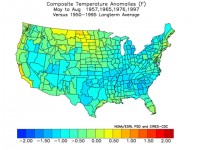
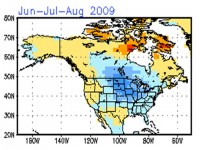
That jives with 3rd summers of La Nina’s trending towards El Nino:
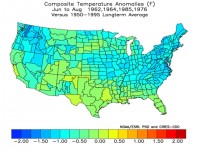
With years with similar, solar, ocean cycles, QBO and other factors:
And with summers following high latitude volcanic eruptions:
By the way, the only year common to all the composite sets above is 1976.....hmmmm
CPC’s Climate Model, the CFS agrees. Here is the latest CFS climate models for summer:
Apr 24, 2009
Sea Ice Claims on Thin Ice
Guest Post by Steven Goddard on Watts Up With That
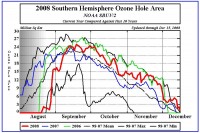
Last weeks’ top Antarctic AGW story was: Antarctic ice melting faster than expected. due to CO2, of course.
This week the #1 story is: Antarctic ice spreading but the increase in size is due to “stratospheric ozone depletion” which is of course also caused by man-made gases.
So Antarctic ice is disappearing faster than expected due to man, and it is also expanding in size due to man. Meanwhile, the early autumn temperature in Vostok, Antarctica is a toasty -95F, a nice warm up from the -104F temperatures earlier this week.
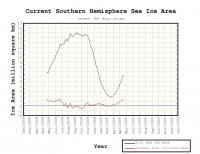
See larger image here
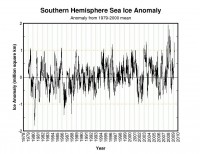
See larger image here
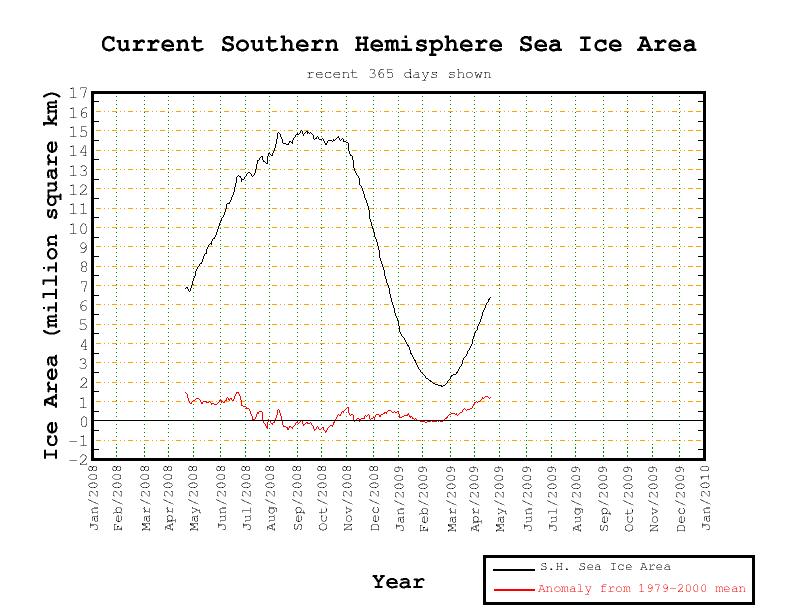
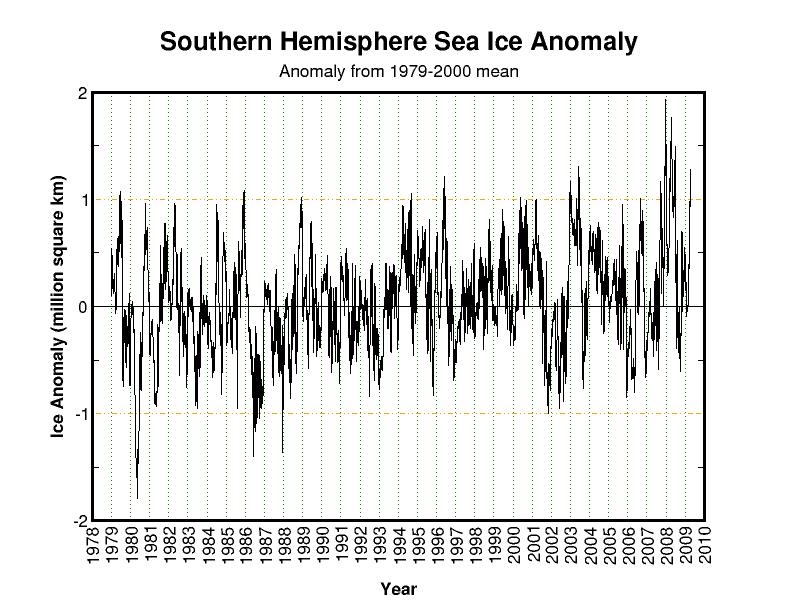
Oh, and one minor problem with the ozone hole theory “The ozone hole occurs during the Antarctic spring, from September to early December” - but the positive ice anomaly occurred during the autumn and winter (March through July) as represented by the red line below. And while the ozone hole was present, ice was normal. So the ice excess probably has nothing to do with the ozone hole.
See larger image here
The AGW standard for broad acceptance of new theories seems to be “not completely implausible - if you avoid actually looking at the body of data or what you might have said last week.” Read more and comment here.
Apr 22, 2009
Revealed: Antarctic ice growing, not shrinking (Updated)
By Greg Roberts, The Australian
ICE is expanding in much of Antarctica, contrary to the widespread public belief that global warming is melting the continental ice cap. The results of ice-core drilling and sea ice monitoring indicate there is no large-scale melting of ice over most of Antarctica, although experts are concerned at ice losses on the continent’s western coast.
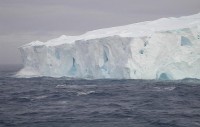
Antarctica has 90 per cent of the Earth’s ice and 80 per cent of its fresh water. Extensive melting of Antarctic ice sheets would be required to raise sea levels substantially, and ice is melting in parts of west Antarctica. The destabilisation of the Wilkins ice shelf generated international headlines this month. However, the picture is very different in east Antarctica, which includes the territory claimed by Australia.
East Antarctica is four times the size of west Antarctica and parts of it are cooling. The Scientific Committee on Antarctic Research report prepared for last week’s meeting of Antarctic Treaty nations in Washington noted the South Pole had shown “significant cooling in recent decades”.
Australian Antarctic Division glaciology program head Ian Allison said sea ice losses in west Antarctica over the past 30 years had been more than offset by increases in the Ross Sea region, just one sector of east Antarctica. “Sea ice conditions have remained stable in Antarctica generally,” Dr Allison said.
The melting of sea ice—fast ice and pack ice—does not cause sea levels to rise because the ice is in the water. Sea levels may rise with losses from freshwater ice sheets on the polar caps. In Antarctica, these losses are in the form of icebergs calved from ice shelves formed by glacial movements on the mainland.
Last week, federal Environment Minister Peter Garrett said experts predicted sea level rises of up to 6m from Antarctic melting by 2100, but the worst case scenario foreshadowed by the SCAR report was a 1.25m rise. Mr Garrett insisted global warming was causing ice losses throughout Antarctica. “I don’t think there’s any doubt it is contributing to what we’ve seen both on the Wilkins shelf and more generally in Antarctica,” he said.
Dr Allison said there was not any evidence of significant change in the mass of ice shelves in east Antarctica nor any indication that its ice cap was melting. “The only significant calvings in Antarctica have been in the west,” he said. And he cautioned that calvings of the magnitude seen recently in west Antarctica might not be unusual. “Ice shelves in general have episodic carvings and there can be large icebergs breaking off—I’m talking 100km or 200km long—every 10 or 20 or 50 years.” Ice core drilling in the fast ice off Australia’s Davis Station in East Antarctica by the Antarctic Climate and Ecosystems Co-Operative Research Centre shows that last year, the ice had a maximum thickness of 1.89m, its densest in 10 years. The average thickness of the ice at Davis since the 1950s is 1.67m.
A paper to be published soon by the British Antarctic Survey in the journal Geophysical Research Letters is expected to confirm that over the past 30 years, the area of sea ice around the continent has expanded. Read story here.

See full image from Cryosphere today here.
See also this story from the Australian where a Russian sea captain says “I see just more and more ice, not less ice.”
RUSSIAN sea captain Dimitri Zinchenko has been steering ships through the pack ice of Antarctica for three decades and is waiting to see evidence of the global warming about which he has heard so much. Zinchenko’s vessel, the Spirit of Enderby, was commissioned in January last year to retrace the steps of the great Antarctic explorer Ernest Shackleton, marking the century of his Nimrod expedition of 1907-09. Spirit of Enderby was blocked by a wall of pack ice at the entrance to the Ross Sea, about 400km short of Shackleton’s base hut at Cape Royds. Zinchenko says it was the first time in 15 years that vessels were unable to penetrate the Ross Sea in January. The experience was consistent with his impression that pack ice is expanding, not contracting, as would be expected in a rapidly warming world. “I see just more and more ice, not less ice.”
Rodney Russ, whose New Zealand company Heritage Expeditions has operated tourist expeditions to Antarctica for 20 years, agrees. He says ships regularly used to able to reach the US base of McMurdo in summer, but ice has prevented them from doing so for several years. “Vessels are usually stopped 8km to 14km short of the base. A few years ago, that was often open water,” Russ says. “We have experienced quite severe ice conditions over the past decade. I have seen nothing in this region to suggest global warming is having an effect.”
Finally see this detailed analysis that puts the Wilkins in perspective to the massive Antarctic ice sheet and this analysis by John McLean showing why the so called Wilkins collapse was another NSIDC, BAS and mainstream media con job.
UPDATE: Finally a New Scientists story “Why Antarctic ice is growing despite global warming ” by Catherine Brahic reports CFCs and other ozone-depleting chemicals have given the South Pole respite from global warming. But only temporarily. According to John Turner of the British Antarctic Survey, the effect will last roughly another decade before Antarctic sea ice starts to decline as well. (ICECAP translation: 10 more years of funding ought to get me nicely to retirement) “By the end of the century we expect one third of Antarctic sea ice to disappear,” says Turner. (H/T Marc Morano, ClimateDepot.com)
Apr 21, 2009
Use Energy, Get Rich and Save the Planet
By John Tierney, the New York Times
When the first Earth Day took place in 1970, American environmentalists had good reason to feel guilty. The nation’s affluence and advanced technology seemed so obviously bad for the planet that they were featured in a famous equation developed by the ecologist Paul Ehrlich and the physicist John P. Holdren, who is now President Obama’s science adviser.
Their equation was I=PAT, which means that environmental impact is equal to population multiplied by affluence multiplied by technology. Protecting the planet seemed to require fewer people, less wealth and simpler technology - the same sort of social transformation and energy revolution that will be advocated at many Earth Day rallies on Wednesday.
But among researchers who analyze environmental data, a lot has changed since the 1970s. With the benefit of their hindsight and improved equations, I’ll make a couple of predictions:
1. There will be no green revolution in energy or anything else. No leader or law or treaty will radically change the energy sources for people and industries in the United States or other countries. No recession or depression will make a lasting change in consumers’ passions to use energy, make money and buy new technology - and that, believe it or not, is good news, because…
2. The richer everyone gets, the greener the planet will be in the long run.
I realize this second prediction seems hard to believe when you consider the carbon being dumped into the atmosphere today by Americans, and the projections for increasing emissions from India and China as they get richer.
Those projections make it easy to assume that affluence and technology inflict more harm on the environment. But while pollution can increase when a country starts industrializing, as people get wealthier they can afford cleaner water and air. They start using sources of energy that are less carbon-intensive - and not just because they’re worried about global warming. The process of “decarbonization” started long before Al Gore was born.
The old wealth-is-bad IPAT theory may have made intuitive sense, but it didn’t jibe with the data that has been analyzed since that first Earth Day. By the 1990s, researchers realized that graphs of environmental impact didn’t produce a simple upward-sloping line as countries got richer. The line more often rose, flattened out and then reversed so that it sloped downward, forming the shape of a dome or an inverted U - what’s called a Kuznets curve. (See nytimes.com/tierneylab for an example.)
In dozens of studies, researchers identified Kuznets curves for a variety of environmental problems. There are exceptions to the trend, especially in countries with inept governments and poor systems of property rights, but in general, richer is eventually greener. As incomes go up, people often focus first on cleaning up their drinking water, and then later on air pollutants like sulfur dioxide. As their wealth grows, people consume more energy, but they move to more efficient and cleaner sources - from wood to coal and oil, and then to natural gas and nuclear power, progressively emitting less carbon per unit of energy.
“Once you have lots of high-rises filled with computers operating all the time, the energy delivered has to be very clean and compact,” said Mr. Ausubel, the director of the Program for the Human Environment at Rockefeller. “The long-term trend is toward natural gas and nuclear power, or conceivably solar power. If the energy system is left to its own devices, most of the carbon will be out of it by 2060 or 2070.”
Read more here.
|

