

By Joseph S. D’Aleo, CCM, AMS Fellow
The Antarctic set a new record (since records began in 1979) for sea ice extent at the end of last winter. It stayed well above the normal through the summer with icemelt 40% below the normal. As a new height of irony and hype, the media made a big deal about a fracture of a small part of the Wilkins ice sheet in late February (160 square miles of the 6 million square mile Antarctic ice sheet (0.0027% of the total). Media headlines blared: Bye-bye, Antarctica? and Massive ice shelf collapsing off Antarctica.
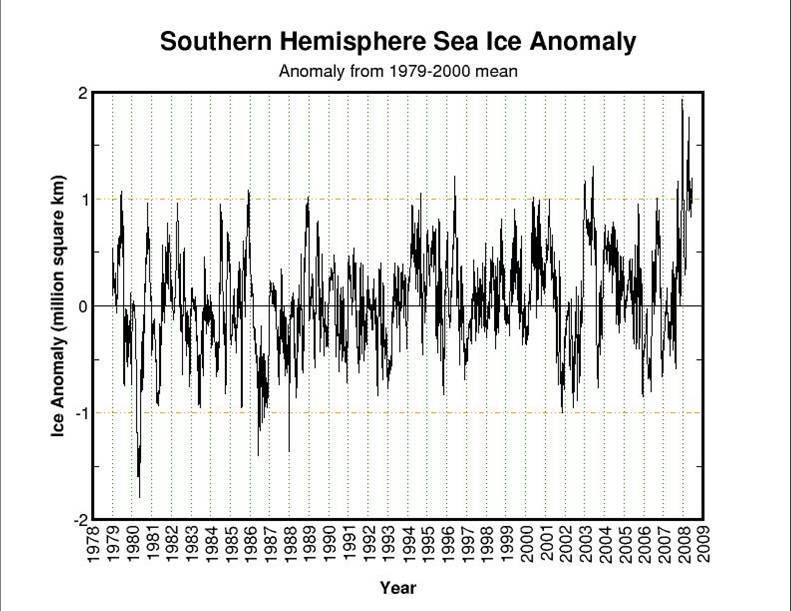
But as you can see from this Cryosphere chart below, the extent never dropped to less than 1 million square km ABOVE NORMAL during or after the brief event. Currently Antarctic ice extent is running nearly 1 million square kilometers higher than last year at this time. Peak comes at the end of the southern winter (September).
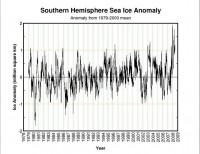
See larger graph here
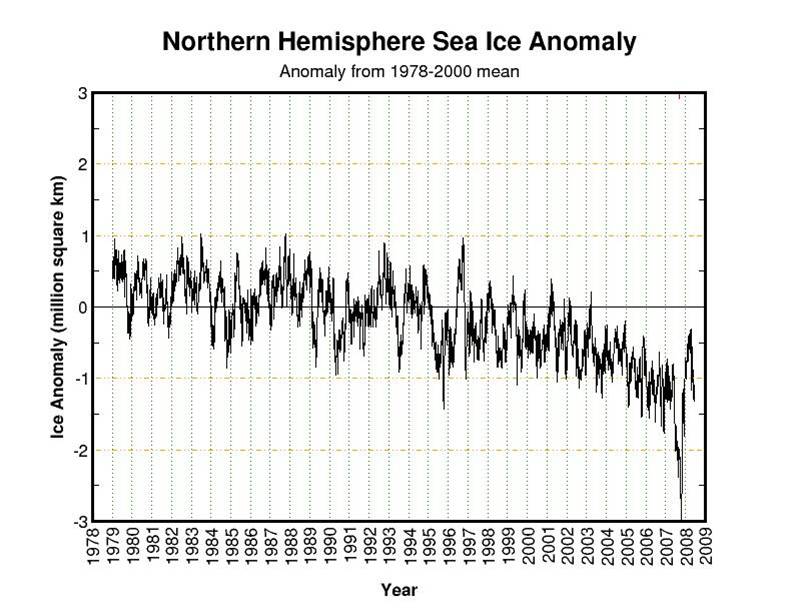
In contrast, the arctic set a record for the least extent since 1979 last September. It recovered at a record pace in the fall and reached levels more like several years ago this past winter.
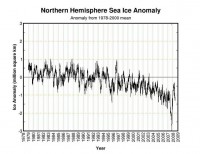
See larger graph here
Last year the upper level pattern in June was very anomalous with a strong ridge of high pressure and warm surface temperatures. The ice melt was rapid. that blocking high pressure led to anomalous warmth near Siberia and Bering Strait and near Greenland leading to rapid ice melt. The surface wind flow helped drain ice from the arctic into the Atlantic at a much higher than normal rate. This year for the same 20 day period, there is a cold trough migrating around the Arctic Ocean with blocking confined to Greenland. The result is temperatures much closer to normal over much of the arctic and cold pools near the Bering Straits and Siberian coast. Models suggest the cold pool strengthens some in the arctic the next few weeks. It is a long time until September, but if the pattern persists, we will likely come up short of last year’s record.
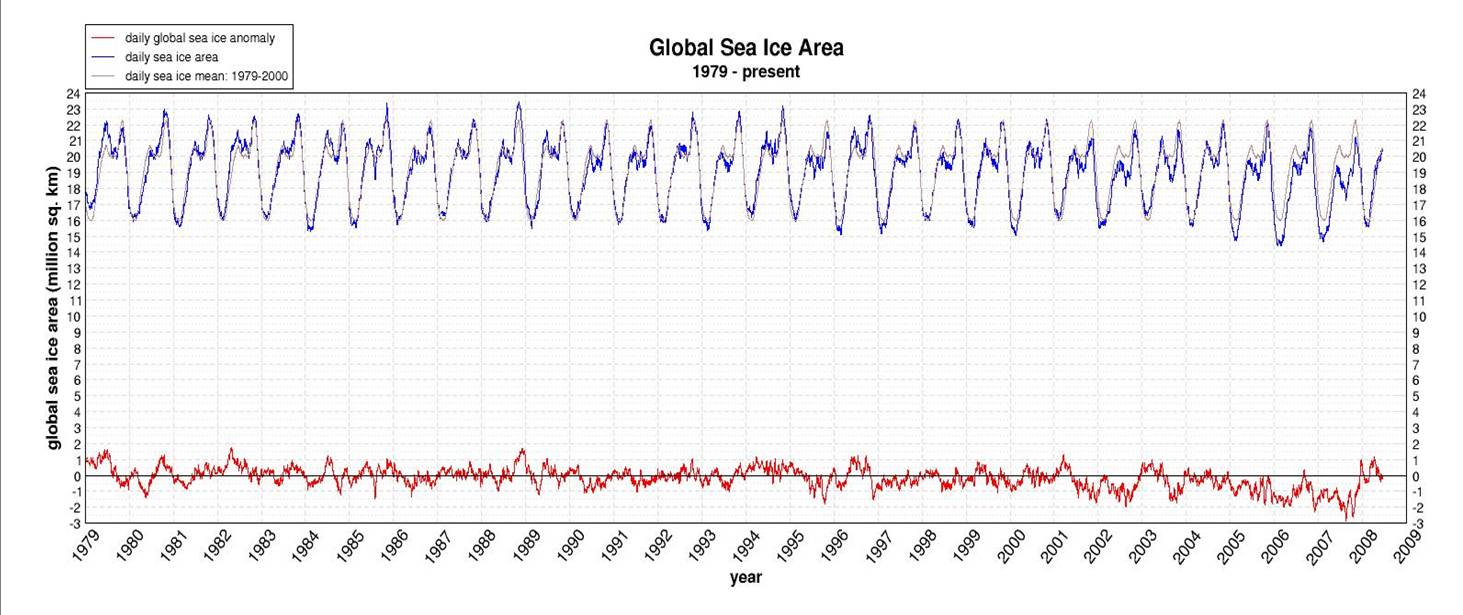
The global sea ice which has been running above normal is now near normal.
See larger graph here
See side by side ice comparisons of the arctic in 2007 and 2008 and more of the patterns leading to the differences and some of the reasons the Arctic has been melting again like it did in the middle of the last century during the end of the last warm period here.