Virtually every month and year we see stories in the once reliable media and from formerly unbiased data centers that proclaim the warmest such period in the entire record back to 1895 or earlier (often 1850).
In the ADDENDUM to the Research Report entitled: On the Validity of NOAA, NASA and Hadley CRU Global Average Surface Temperature Data & The Validity of EPA’s CO2 Endangerment Finding, Abridged Research Report, Dr. James P. Wallace III, Dr. (Honorary) Joseph S. D’Aleo, Dr. Craig D. Idso, June 2017 (here) provided ample evidence that the Global Average Surface Temperature (GAST) data was invalidated for use in climate modeling and for any other climate change policy analysis purpose.
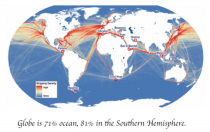
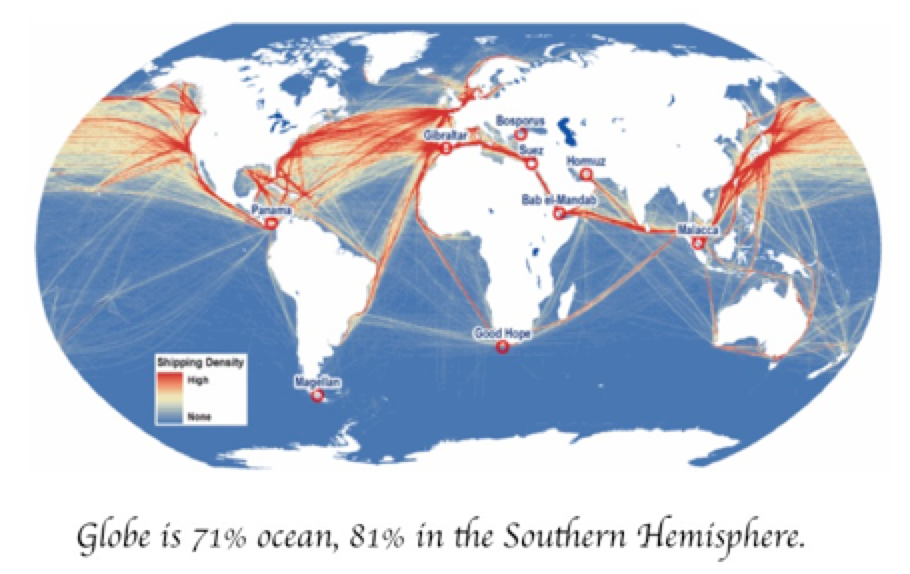
“The conclusive findings of this research are that the three GAST data sets are not a valid representation of reality. In fact, the magnitude of their historical data adjustments, that removed their cyclical temperature patterns, are totally inconsistent with published and credible U.S. and other temperature data. Thus, it is impossible to conclude from the three published GAST data sets that recent years have been the warmest ever - despite current claims of record setting warming. That is made even more true given that 71% of the earth’s surface is ocean and the only ocean data prior to the satellite era began in the 1970s was limited to ship routes mainly near land in the northern hemisphere.”
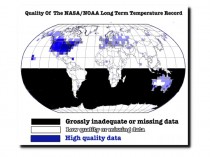
According to overseers of the long-term instrumental temperature data, the Southern Hemisphere record is “mostly made up”. This is due to an extremely limited number of available measurements both historically and even presently from Antarctica to the equatorial regions.
In 1981, NASA’s James Hansen et al reported that “Problems in obtaining a global temperature history are due to the uneven station distribution, with the Southern Hemisphere and ocean areas poorly represented."(Science, 28 August 1981, Volume 213, Number 4511(link))
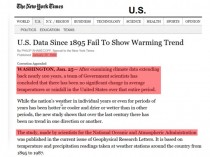
In 1978, the New York Times reported there was too little temperature data from the Southern Hemisphere to draw any reliable conclusions. The report, prepared by German, Japanese and American specialists, appeared in the Dec. 15 issue of Nature, the British journal and stated that “Data from the Southern Hemisphere, particularly south of latitude 30 south, are so meager that reliable conclusions are not possible,” the report says. “Ships travel on well-established routes so that vast areas of ocean, are simply not traversed by ships at all, and even those that do, may not return weather data on route.”
This finding was amplified recently by MIT graduate Dr. Mototaka Nakamura in a book on “the sorry state of climate science” titled Confessions of a climate scientist: the global warming hypothesis is an unproven hypothesis.
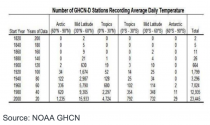
He wrote: “The supposed measuring of global average temperatures from 1890 has been based on thermometer readouts barely covering 5 per cent of the globe until the satellite era began 40-50 years ago. We do not know how global climate has changed in the past century, all we know is some limited regional climate changes, such as in Europe, North America and parts of Asia.”
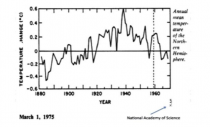
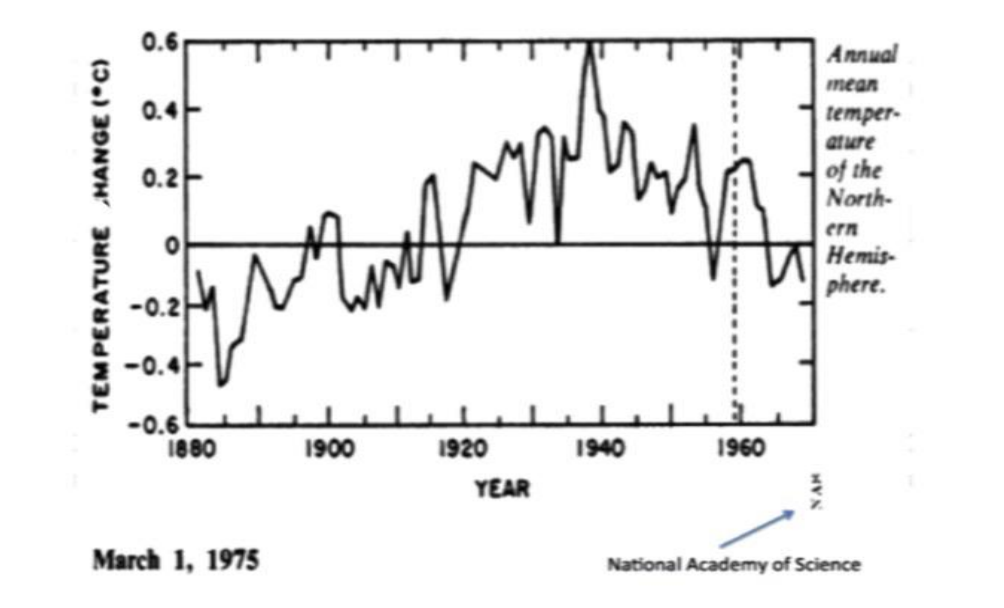
The National Academy of Science recognized this in their first attempt at determining a trend in temperature in the 1970s, which they limited to the Northern Hemisphere land areas. It showed a dramatic warming from the 1800s to around 1940 then a reversal ending in a matching cooling by the late 1970s when even the CIA wrote that the consensus of scientists we might be heading towards a dangerous new ice age.
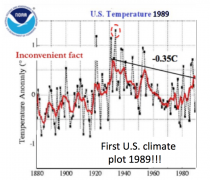
The first real-time temperature trend tracking was in 1989 - and was the US only as the US had the best surface station network and urban contamination was accounted for.
Tom Karl whose paper in 1988 defined the UHI adjustment for the first version of USHCN (which was removed in version 2) wrote with Kukla and Gavin in a 1986 paper on Urban Warming: “MeteoSecular trends of surface air temperature computed predominantly from urban station data are likely to have a serious warm bias… The average difference between trends, urban siting vs. rural, amounts to an annual warming rate of 0.34C/decade. The reason why the warming rate is considerably higher may be that the rate may have increased after the 1950s, commensurate with the large recent growth in and around airports. Our results and those of others show that the urban growth inhomogeneity is serious and must be taken into account when assessing the reliability of temperature records.”
The NY Times reported the US Data failed to show warming trend predicted by Hansen in 1980.
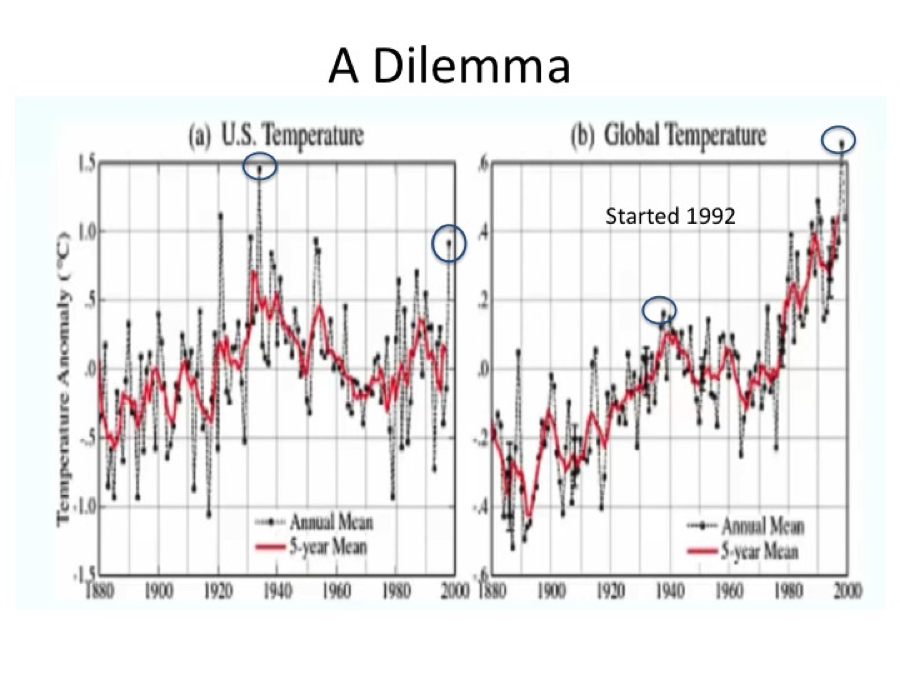
Even in 1999, the temperature still trailed 1934 - James Hansen noted “The U.S. has warmed during the past century, but the warming hardly exceeds year-to-year variability. Indeed, in the U.S. the warmest decade was the 1930s and the warmest year 1934.”
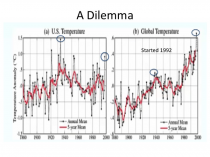
When the data centers were pressured to do the same with global data they faced a dilemma as station coverage was poor and station quality was unknown. The result without station quality control was a warming post 1980.
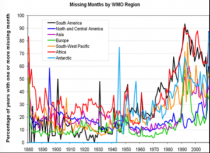
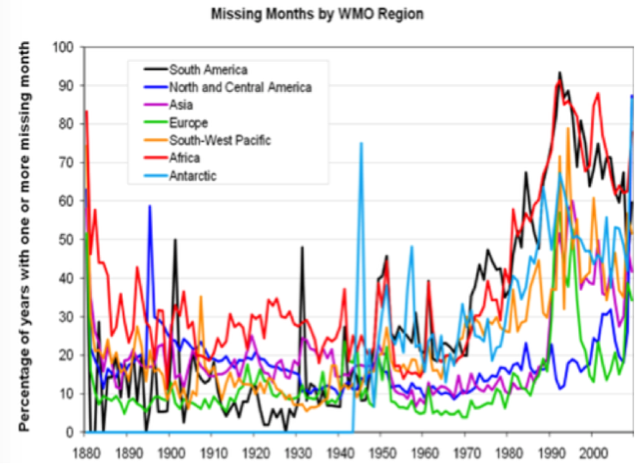
Even as the stations incorporated increased in number and coverage, their reliability became a challenge, with many large continents having a large percentage of missing months in the station data. That required the data centers to guess the missing data to get a monthly and then annual average.
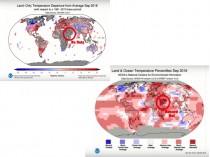
You may be surprised to see that continues today. This required guesswork allows those whose job is to validate their models the opportunity to make adjustments in ways to confirm their biases. See the initial data regions in September 2018 that were filled in by algorithms. It includes in a large data void region a record warmth assessment (Heller 2018).
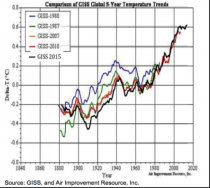
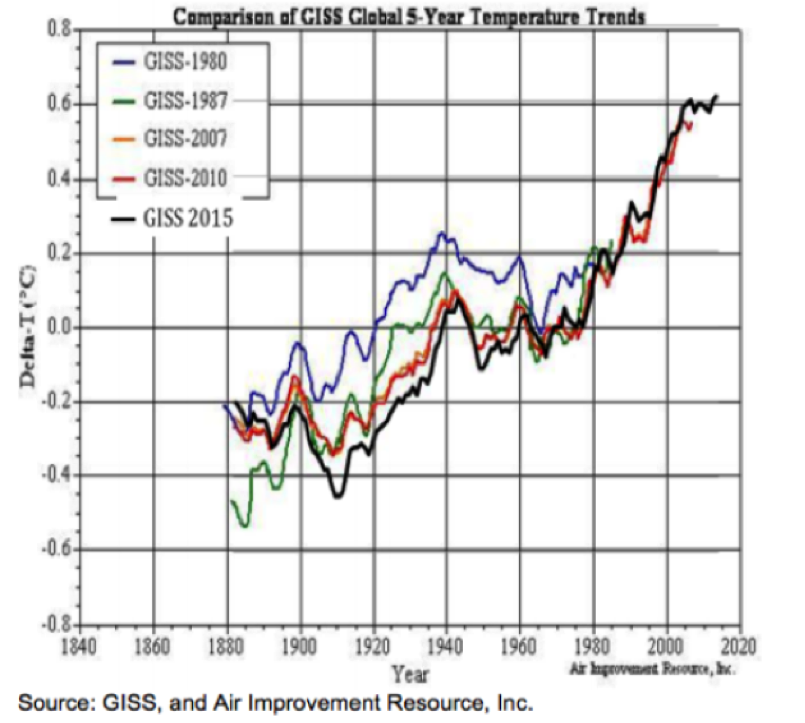
In our assessments, we found that each update cooled past years more and more which serves to make over time the trends more consistent with their model scenarios.
Here is the NASA GISS adaption of the NOAA GHCN data. Each update cools the past to make the trend upward more significant.
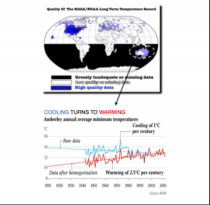
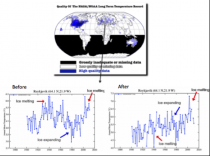
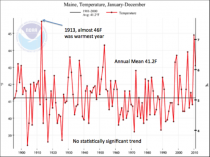
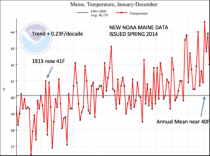
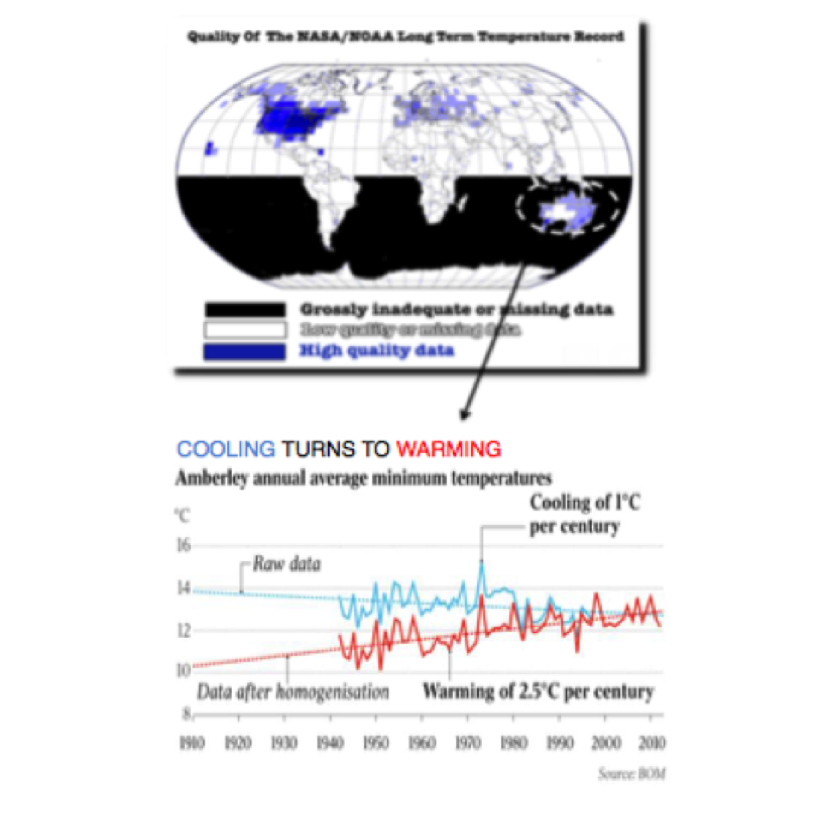
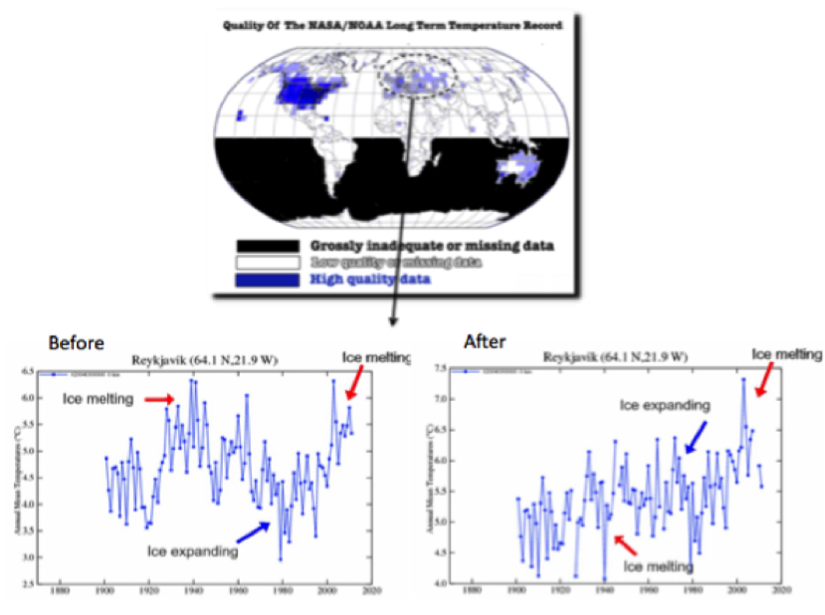
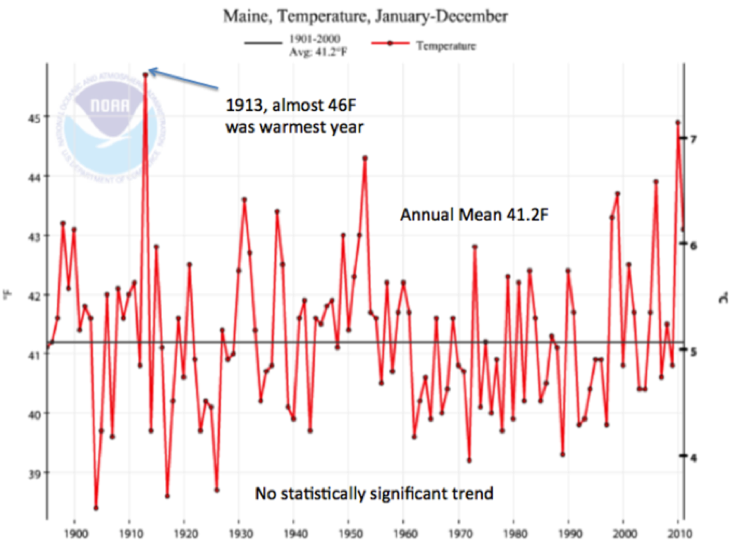
Even in areas with better data, station data was adjusted (corrupted) by the analysts to turn a cooling trend into the desired warming. We picked just three of many examples - one in Australia, the second in Iceland and the plot for the state of Maine.
For Australia, many examples have been uncovered including Darwin and here Amberley. Blue was the original data plot, red is the one after adjustment in Australia.
The NASA GISS plots for the Iceland raw and the adjusted data shows a cycle replaced by a linear warming ramp. The adjusted data was refuted by the Icelandic met department.
A new version of the US data appeared by 2010 and showed similar adjustments.
NOAAs Maine temperature trend was accessed in 2011 and again after 2013. The first showed no statistically significant trend from 1895 (-0.01F/decade) with the warmest year 1913. The second had a trend of +0.23F/decade with 1913 adjusted down almost 5F.
Climategate emails exposed the true state of the data bases used to drive global policy decisions. Their own developers and their chief scientist were exposed and forced to acknowledge the data flaws. Ian ‘Harry’ Harris, the lead CRU climate data programmer and analyst in the ‘Climategate’ emails admitted to “[The] hopeless state of their (CRU) data base. No uniform data integrity, it’s just a catalogue of issues that continues to grow as they’re found… There are hundreds if not thousands of pairs of dummy stations...and duplicates… Aarrggghhh! There truly is no end in sight. This whole project is SUCH A MESS. No wonder I needed therapy!!” http://www.di2.nu/foia/HARRY_READ_ME-0.html
The CRU scientist at the center of the Climategate scandal at East Anglia University, Phil Jones after he thought the jig was up, made a candid admission on BBC that his surface temperature data are in such disarray they probably cannot be verified or replicated, that there has been no statistically significant global warming for the last 15 years and it has cooled 0.12C/decade trend from 2002-2009. Jones specifically disavowed the “science-is-settled” slogan.
Attempting to compile a ‘global mean temperature’ from such fragmentary, disorganized, error-ridden, geographically unbalanced ever-changing data with strong evidence of manipulation is more politically driven fraud than science.
As for the claims of increasing extremes - see a revealing fact check here.
The data supports the findings of the research mentioned above:
“The conclusive findings of this research are that the three GAST data sets are not a valid representation of reality. In fact, the magnitude of their historical data adjustments, that removed their cyclical temperature patterns, are totally inconsistent with published and credible U.S. and other temperature data. Thus, it is impossible to conclude from the three published GAST data sets that recent years have been the warmest ever - despite current claims of record setting warming.”
Support Icecap efforts to combat scientific fraud and environmental fanaticism with even a small donation via a secure access to Paypal - The safer, easier way to help online!
As noted in my post this past Sunday, no amount of fake happy talk in the so-called “Glasgow Climate Pact” can obscure the obvious fact that nobody agreed to anything. To read the text of the “pact,” everybody claims to think that this whole “decarbonization” thing to “save the planet” is real. We’re all going to do something really, really significant, but it will be next year, or maybe the year after that. And meanwhile, nobody has made any remotely serious effort to cost this thing out. Are we talking about a ten percent increase in the cost of energy for this decarbonization project, or will it be a doubling, or maybe a tripling - or maybe even a multiplication by ten?
With tens of trillions of dollars at stake in the world economy, let alone the majority of humanity at risk of energy poverty, you would think that we would be far down the road toward detailed engineering studies of what the decarbonized energy world will look like and exactly how much it will cost. But it is exactly the opposite. Everywhere - or at least everywhere in the Western countries - government functionaries with degrees in English or Political Science (or maybe Gender Studies) issue edicts that carbon emissions will be reduced “50% by 2030” or “90% by 2050,” without any knowledge or understanding of how that may be accomplished.
So, as the costs of attempting to “transition” away from fossil fuels start to hit home, will anybody actually go through with the project? I think that the chance of that is about zero. China and India show how it works. To judge by their actions (rather than their words), they have long since figured out that solar and wind energy can’t succeed in running a modern economy, so they mouth empty platitudes to placate the Western zealots, make unenforceable promises that only come due after everyone is dead, and forge ahead with massive development of coal power. And even more telling are recent developments in Western jurisdictions. When the first hint arrives that fossil fuel restrictions are going to impose cost increases large enough for meaningful numbers of voters to notice, even the bluest of blue U.S. states take about three minutes to abandon their “decarbonization” promises.
.....
...perhaps most notable is what has happened in recent days in some of the bluest of blue U.S. jurisdictions. In 2010, some twelve Northeast states, plus the District of Columbia, entered into a kind of agreement to agree to form something called the “Transportation and Climate Initiative.” The language of the official document was all about “reducing greenhouse gas emissions”; but in practice this was from the get-go intended as a cap-and-trade scheme, which would use a restricted and decreasing supply of permits to gradually force up the price of transportation fuels (mostly gasoline), and thereby force the people to use less of them. The signatories to the initial document included all of the New England and Mid-Atlantic states.
The Boston Herald has a piece yesterday (November 18) summarizing the TCI program and its current status. First, as to the intent of the program and how it would work:
TCI would have capped carbon emissions by forcing fuel companies that exceeded limits to buy additional permits and invest those proceeds into green transportation and climate-resilient infrastructure. It aimed to reduce vehicle emissions by 26% by 2032.
Well, gasoline prices are now up about 50% since President Biden took office in January 2021. Perhaps you might think that the TCI states would be unable to contain their excitement, and would be plowing ahead to raise prices still further and force a rapid decline in consumption. But actually the opposite is occurring. First of all, only a handful out of the twelve original states plus DC moved forward to join the compact:
Initially, 12 states plus the District of Columbia were in talks to enter the agreement, but just Massachusetts, Connecticut, Rhode Island and D.C. eventually signed a memorandum of understanding by December 2020.
And now, with gas prices rapidly rising, what politician wants to be seen as forcing them up still higher? So even the few deep-blue states that had joined TCI are now heading for the exits. The Herald reports that Connecticut pulled out of the compact on Tuesday (November 16); and yesterday (November 18) Massachusetts followed:
Gov. Charlie Baker has pulled the plug on a regional climate initiative that would have capped tailpipe emissions and was projected to hike gas prices at a time of record inflation, admitting the multi state-deal is “no longer the best solution.” He backs out of the Transportation and Climate Initiative just days after Connecticut did.
A Massachusetts group called Mass Fiscal Alliance calls it correctly:
“TCI is a regressive gas tax scheme that would have hurt (the) middle class and the working poor the most. It’s such wonderful news to see that Massachusetts families will not be forced to endure the economic hardship TCI would have imposed upon them,” said [Mass Fiscal Alliance] spokesperson, Paul Diego Craney.
Meanwhile, New York moves ahead with its ignorant bureaucrats issuing edicts for the end to fossil fuels a few years out. At this point the voters remain almost entirely unaware of what is coming. But when the costs start to hit home, will we actually stay the course? No, we won’t. It will be fun watching the process unfold.
--------
November 14, 2021
If you have been following the news at all for the past several weeks, you know that the latest gigantic UN “climate” conference, going by the name COP (Conference of Parties) 26, has been taking place in Glasgow, Scotland. Mercifully, it ended yesterday, Saturday, November 13. All of those hundreds of private jets have now flown home.
Every time one of these UN confabs takes place, you have to hold your breath fearing that some tremendously damaging result will emerge. But, reviewing the final outcome of this latest conference, my comment is that we climate realists have gotten about the best result we could have hoped for. If you read some mainstream news sources, you may well get exactly the opposite impression. So let me give my reasoning.
At this point, there are basically two paths that the world might take in the movement toward so-called “decarbonization” of the energy system:
Path 1 is the path of strict world socialism. Of course, this is the preferred path of climate activists and UN bureaucrats. In this scenario, the entire world is forced, through binding international agreements, into an energy straight jacket, mandating reduction and then elimination of the use of fossil fuels within two or three decades at most.
Path 2 is what happens when there are no compacts with material binding worldwide energy restrictions. On this path, everybody talks a good game about decarbonization but, lacking meaningful binding agreements, most of the countries, with most of the population, continue to pursue whatever energy system is most reliable and cost effective. In practice that almost inevitably means fossil fuels for most to all applications. Meanwhile, a small number of wealthy, small-population jurisdictions that somehow become obsessed with the perceived virtue of eliminating fossil fuels - likely examples being Germany, California, New York, the UK, and perhaps South Australia (aggregating about 2-3% of world population) - will push the limits of decarbonization and intermittent renewable energy sources. They will then be the guinea pigs for the rest of the world to find out whether a decarbonized energy system can be made to work, and at what cost.
The end of the COP26 conference has shown that we are not on Path 1, and are unlikely to go there.
The key difference between the two scenarios is what happens in the nearly inevitable circumstance where the new “decarbonized” energy system fails to work cost-effectively or reliably, leading to enormously increased prices, shortages, and/or frequent blackouts. On Path 1, when that happens, the world’s people get forced into universal energy poverty with no obvious way to escape, and the bureaucrats and left wing press undoubtedly find some way to blame oil companies or some other capitalist bogeymen for the disaster. On Path 2, the 97-98% of the world that has not committed energy suicide can sit back and observe while the guinea pigs self-destruct. Eventually, the people in the guinea pig jurisdictions will catch on that they are being forced to pay a multiple of a reasonable price, and for energy that does not work very well, and they will replace their politicians.
How long will it take for these suckers to catch on? It could take a long time. Note that California and Germany, with self-inflicted energy prices well above those of surrounding jurisdictions, continue to double down and vote for more of same. But then, they are very wealthy jurisdictions, and it is their own problem.
And by the way, if the guinea pigs succeed in decarbonizing at little to no cost in either money or reliability, I will be the first to congratulate them. But they won’t succeed.
So let’s take a look at the outcome of COP26, and consider where this is going. See MORE here.
Mainstream media is infamous for its exaggeration of everyday events. When it comes to the issue of climate change, it rarely misses an opportunity to promote fear. True to form, during the ongoing COP26 climate conference in Glasgow, media promoted incorrect information spewed by politicians and famous personalities.
Special attention was drawn to the assertion that rising sea levels are threatening island nations by none other than Barack Obama, who incongruously has purchased a multi-million-dollar ocean front property on the New England coast.
Catching the attention of millions was the image of a Tuvalu minister standing in knee-high sea water. But there is a problem with this: Most islands in the South Pacific nation of Tuvalu have gained surface area and are in no danger of being inundated.
Despite sea-level rise that has been underway since the end of the last ice age, Tuvalu’s land area has increased recently by 2.9 percent. A peer-reviewed research paper which studied four decades of shoreline change in all 101 islands in the Tuvalu atolls categorically proves this.
The paper notes that “...change is analyzed over the past four decades, a period when local sea level has risen at twice the global average (~3.90/+/- 0.4mm.yr-1). Results highlight a net increase in land area in Tuvalu of 73.5 hectares (2.9%) despite sea-level rise and land area increase in eight of nine atolls.”
The case of Tuvalu is not unique. Various island nations have gained landmass in recent decades, including Maldives which increased by 37 square kilometers since 2000.
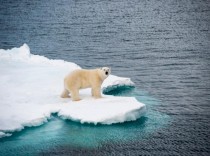
The climate doomsday machine has been using this image-based propaganda for a while now. National Geographic circulated an image of a starving polar bear and claimed that the bear’s condition was a direct result of man-made climate change.
However, polar bear populations are relatively healthy and have increased in recent decades. When exposed, the famous media channel issued a statement saying that the reason for the dismal condition of the bear is unknown and that it had exaggerated the climate impact.
At COP26, Bill Gates joined climate elites who resorted to a representation of reality designed to promote climate fear. “Farmers in low-income countries are at high risk from the impacts of climate change,” said Gates. But a closer look at weather data and the state of global agriculture reveals a different picture.
The United Nations makes clear that there is no strong evidence that climate change is having a significant influence on the frequency of extreme weather events. IPCC AR5 WGI Chapter 2 states, “In summary, there continues to be a lack of evidence and thus low confidence regarding the sign of trend in the magnitude and/or frequency of floods on a global scale.”
When it comes to droughts, the report states that “...there is not enough evidence at present to suggest more than low confidence in a global-scale observed trend in drought or dryness (lack of rainfall) since the middle of the 20th century.”
Consider India, a country with the world’s largest number of low-income farmers. More than 500 million people depend either on agriculture or allied products. Of that total, 150 million depend only on agriculture - the equivalent of 40 percent of the U.S. population.
These farmers - with an average monthly income of less of $120 - depend on monsoon rainfall and there has been no climate signature on the monsoon rainfall trend. Nor has there been any increase in cyclones.
In other words, there has not been any increased risk from climate change for India’s farmers. Another indicator of the absence of heightened risk is crop production. For four consecutive years, India has produced record food crops, higher than ever before in its history.
You would think that Gates would know something about agriculture and climate given that he owns 242,000 acres of U.S. farmland and is said to be the largest private owner of such acreage. However, it appears that the billionaire is at best ill-informed.
Though fancying themselves to be noble defenders of nature, these purveyors of doomsday scenarios are more akin to a cult’s priesthood offering commoners salvation in exchange for prosperity and freedom.
Vijay Jayaraj is a Research Associate at the CO2 Coalition, Arlington, Va., and holds a Master’s degree in environmental sciences from the University of East Anglia, England. He resides in Bengaluru, India.
Temperature Bottom Falling Out: Antarctica’s Coldest Half-Year Since Measurements Began 60 Years Ago
By P Gosselin on 9. November 2021
Antarctica sets a record cold six month period...Neumayer station sets new winter record low, sees rapid cooling since 2000!
German Die kalte Sonne here features Antarctica’s record cold winter - the coldest since temperature measurements began some 60 years ago.
Coldest April-September period
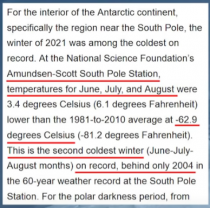
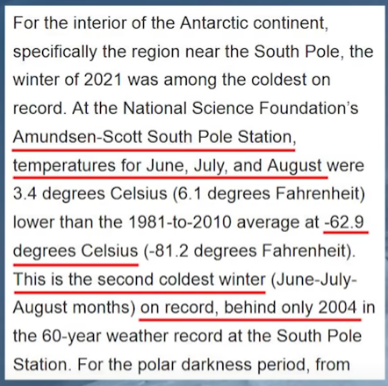
The Amundsen Scott station at the South Pole recorded a mean temperature of -60.9C for the April 1 to September 30 period, according to the US National Snow and Ice Data Center (NSIDC). For the June-July-August period, the mean was minus 62.9C the second coldest recorded.
Apparently the 140 or so ppm added CO2 couldn’t trap enough heat to prevent a record cold from being set. The previous record for June-July-August was set in 2004.
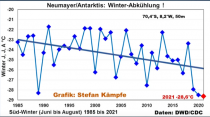
Neumayer sets record cold, sees 3C of cooling since 1985.
Die kalte Sonne reports that a record was also set at the German Neumayer Antarctic station, located on the Antarctic coast, which saw a mean June-July-August temperature of -28.6C.
Recording at the Neumayer station began in 1985, and the linear trend over the past 35 years has fallen by almost 3C! It’s been cooling even faster since 2000:
Rapidly cooling Antarctic. Chart: Stephan Kampfe. Data: DWD.
The German Neumayer Antarctic station has seen a distinct cooling trend since 1985, according to data from the German DWD national weather service. This is not getting reported by the media in Germany in any way, shape or form. We can just imagine the blaring headlines if the trend instead had shown 3C of warming. You’d have a thousand German journalists descending on the South Pole by now.
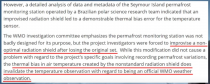
Record warm reading gets discarded
Last February, for example, the German Berliner Morgenpost reported how for the first time the temperature had climbed over 20C at the northern tip of the Antarctic peninsula - Seymour Island. “At the South Pole, climate change is very clear,” declared the Morgenpost.
However a subsequent World Meteorological Organization (WMO) investigation found the reading had in fact nothing to do with climate change, Die kalte Sonne reports:
The 20.75C “record” reading resulted from a faulty instrument, and thus was nullified last July.
Yet, activist groups like Germany’s DUH don’t want to hear any of it. They continue to cite the nullified record even today for gathering petition signatures.
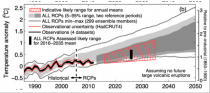
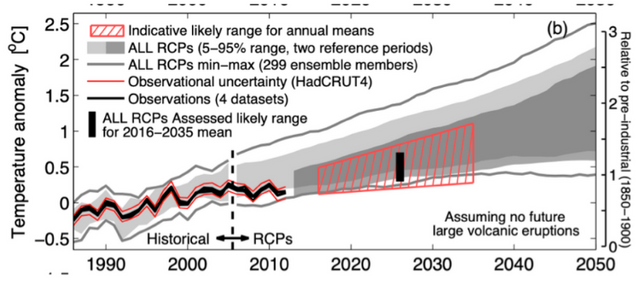
Delving into the latest IPCC report, Judith Curry finds this projection to 2035, at which time the “running hot” models are projecting temperature levels between almost the same as today and a little over 0.5C warmer.
Richard Lindzen notes that global temperatures have increased 0.5C since 1960, noting “Despite the fact that increases of CO₂ thus far have been accompanied by the greatest increase in human welfare in history, and despite the fact that there have been large increases in the Earth’s vegetated area largely due to increases in CO₂’s role in photosynthesis, governments seem to have concluded that another 0.5 C will spell doom”.
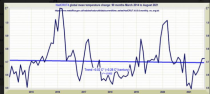
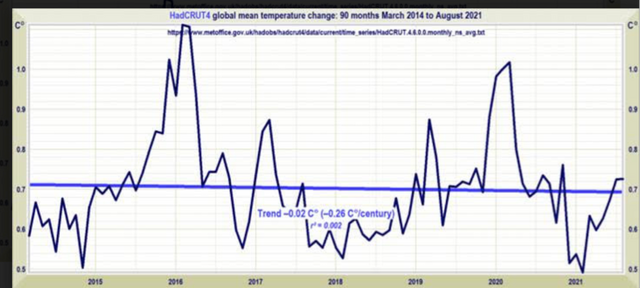
Blogger Geoff Derrick distills the following chart of recent global temperatures from the UK Met Office Hadley Centre showing no warming since 2014.
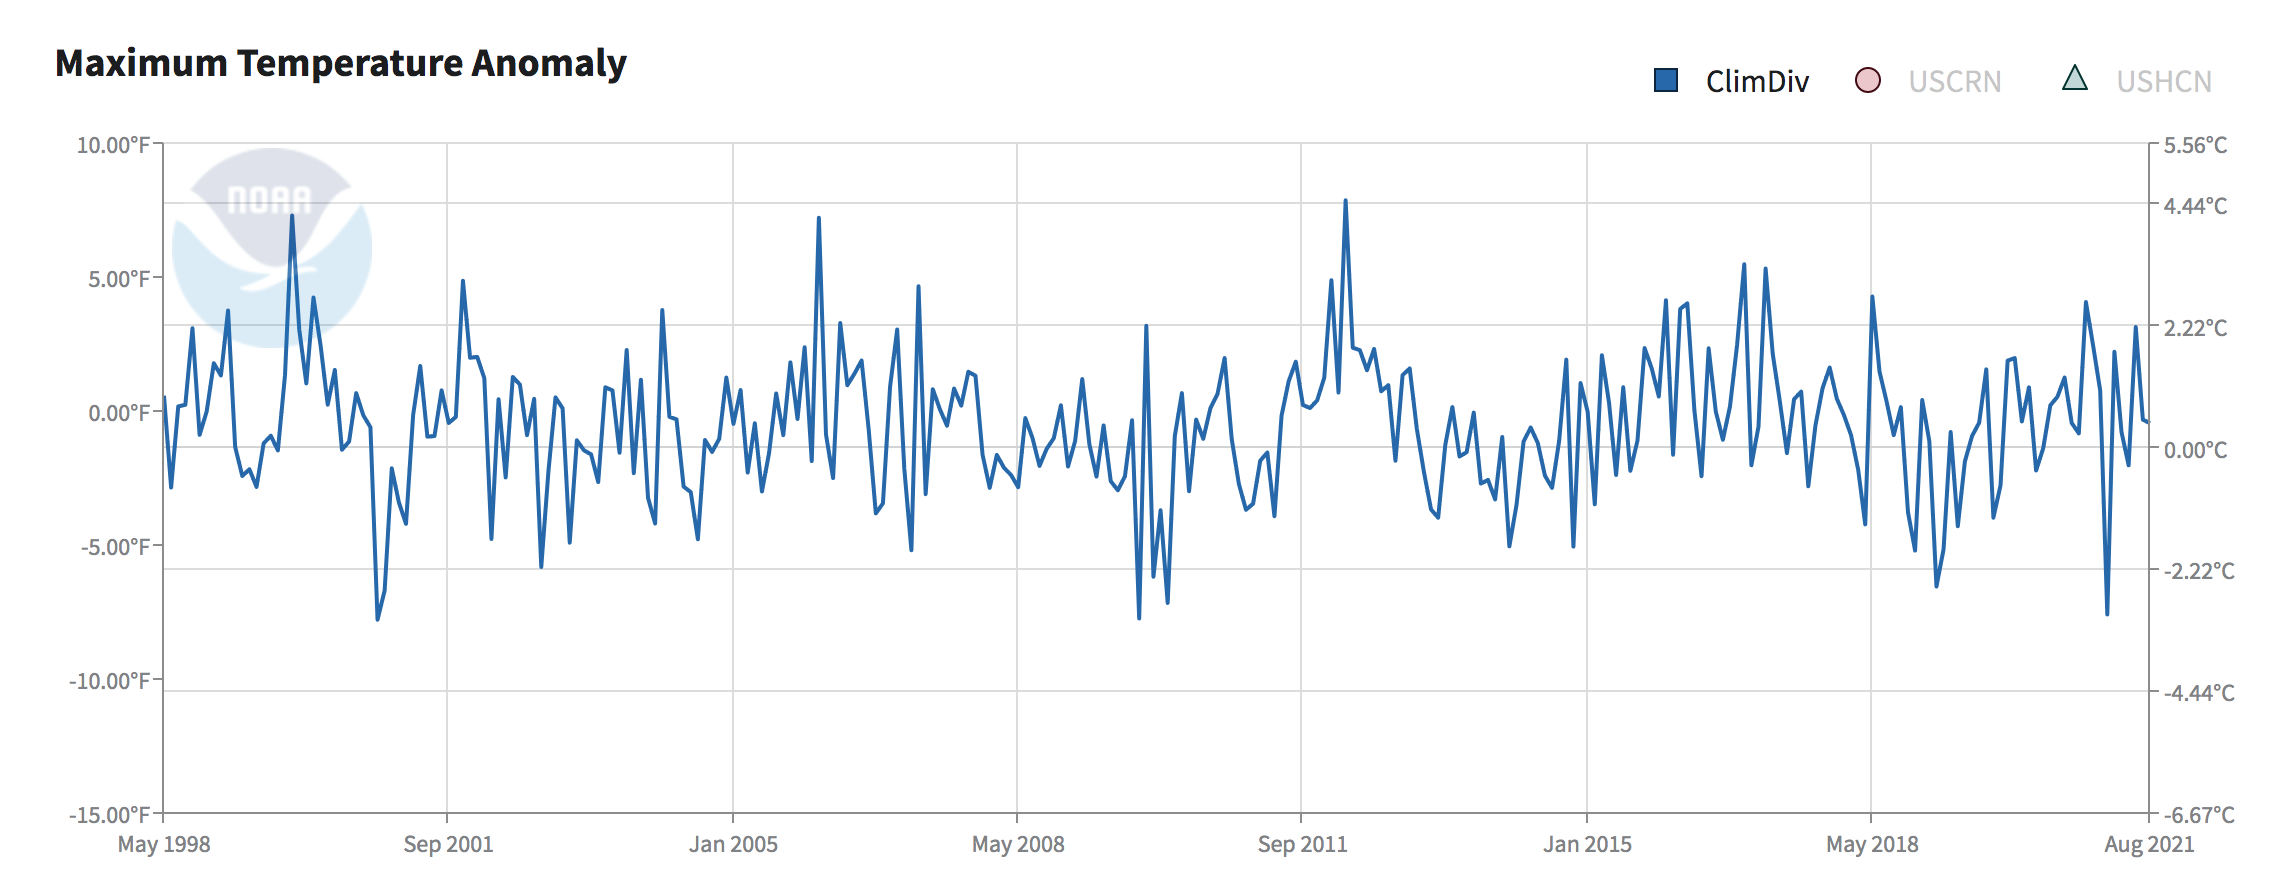
See the Climate Reference Network plot of Monthly Average US temperatures since inception in 2005 and the constructed data from the US climate divisions back to 1998’s super El Nino.
See much more detail on the true temperature story here.
Please share freely. Help us get the word out with a secure Paypal donation (left column home page).
------------
Roger Pielke condemns UN Secretary-General Guterres for wrongly and irresponsibly calling the latest IPCC report a “code red for humanity”. The report claims that heatwaves and extreme precipitation will be more frequent but not floods, hail, lightning, hurricanes, strong winds and droughts.
The Observer Research Foundation (an organization partnered by Apple, Bill Gates, Uber, Google, and Microsoft) says climate change threatens India’s food security. That assumes Indian agriculture is highly vulnerable to climate disasters. But India’s agricultural output is at record levels, and projected to grow due to increased rains from warming oceans.
Having called out “scientists” inventing a global warming-induced collapse of the Great Barrier Reef, Dr Peter Ridd was subsequently sacked from his James Cook University position for disloyalty. The High Court found provisions in university codes of conduct that seek to prohibit robust, aggressive and acrimonious debate are inconsistent with intellectual freedom. Ludicrously, the Court also concluded that Dr Ridd should have followed University’s confidentiality directions but to have done so would have made it impossible for him to contest the case. Parliament is to pass laws clarifying intellectual freedom.
Developments in climate change economics
In response to massive energy price hikes in Europe, Frans Timmermans, the EU’s climate chief, adopting the ostrich approach, says the solution is more renewables, not fewer. US Treasury Secretary Janet Yellen says the answer is storage but omitted to say what the cost would be. Eric Worrall has put a $50 trillion price tag on batteries that would allow just 5 days storage in a wind drought.
UK Energy Secretary, Mr Kwarteng claimed that despite the shift from coal to renewable energy in the last ten years “the costs haven’t gone up”. But the Office for Budget Responsibility (OBR) says subsidies to renewables now add 10 billion pounds a year to electricity consumer costs, even excluding all the increased system management and grid expansion costs. While Boris Johnson claims the UK will achieve net zero without “a hairshirt in sight” Treasury points to a cost of 60 billion pounds a year by the next decade and, as the Spectator notes, “Government estimates are notoriously inaccurate”. The Daily Mail described Johnson’s eco dream as “the longest suicide note in history”.
UK government has a gas crisis. In pursuing a greenhouse agenda, it has prevented new North Sea developments and has banned fracking of gas in the abundant onshore resources.
Norway’s new left-wing government is, however, not sacrificing its own coal and oil to global concerns as it steps up new drilling.
Ominous for the world, disastrous for Germany: Social Democrats, the Green Party and the Free Democrats join for a “fresh start” and pave the way for an ecologic modernization of the economy that complies with climate targets. Yet, one month after the September election the green coalition is not yet operational with the three parties focussed on higher energy prices.
Bucking the trend, French Presidential hopeful Marine Le Pen, the head of the National Rally (RN) party, has said she would take down France’s wind turbines and end subsidies for renewable energy if she was victorious in next year’s elections.
Edwards, Dobson and Owen estimate that to firm-up intermittent energy in the UK with 50 per cent wind supply and 10 windless days would require 5 TWh of battery storage at a cost 1.5 trillion pounds.


_thumb.png)
_thumb.png)

.png)
.png)