

NRDC REPORT TO SHOW HUGE NUMBER OF AMERICANS ARE SUFFERING THROUGH TOLL OF EXTREME HEAT DAYS
Experts to Outline Major Toll on Health; Worst-Off States Include AK, AZ, CA, CO, CT, DE, DC, FL, HI, KS, MA, MT, NV, NH, NC, OR, RI, TN, UT, WA & WY
WASHINGTON, D.C. NEWS ADVISORY - Yes, it is getting hotter out there. A new analysis to be released by the Natural Resources Defense Council (NRDC) Tuesday (October 24th) will show that a large share of Americans are now suffering due to more dangerous high heat days. NRDC’s interactive map analysis will show a greater-than-expected number of extremely hot summer days today than there were just a few decades ago, which can intensify a range of serious public health risks.
Some of the hardest-hit states include (in alphabetical order): Alaska, Arizona, California, Colorado, Connecticut, Delaware, the District of Columbia, Florida, Hawaii, Kansas, Massachusetts, Montana, Nevada, New Hampshire, North Carolina, Oregon, Rhode Island, Tennessee, Utah, Washington State and Wyoming. The report will detail the percentage of each state’s population which lives in areas experiencing more than nine additional extreme days of heat a year.
NRDC will release the new report during a telephone-based news conference on Tuesday, October 24, 2017 at 2 p.m. ET/1 p.m. CT/11 a.m. PT.
Speakers will include:
* Dr. Kim Knowlton, senior scientist and deputy director, Science Center, Natural Resources Defense Council;
* Dr. Linda Rudolph, MPH, director, Center for Climate Change and Health, Public Health Institute; and
* Dr. Samantha Ahdoot, assistant professor of Pediatrics at Virginia Commonwealth University School of Medicine and pediatrician with Pediatric Associates of Alexandria, Virginia.
TO PARTICIPATE: Reporters can join this live, phone-based news conference (with full, two-way Q&A) at 2 p.m. ET/1 p.m. CT/11 a.m. PT on Tuesday, October 24, 2017, by dialing 1 (877) 418-4267. Ask for the “NRDC Extreme Heat Report” news event.
MEDIA CONTACTS: Max Karlin, (703) 276-3255 or mkarlin@hastingsgroup.com.
Please feel free to call and challenge. To help you, here are the true facts.
CLAIM: HEAT WAVES ARE INCREASING
UPDATE: See Tony Heller’s analysis here.
----------------
There has been no increase in heat waves in the United States or elsewhere in the world, but you would never know it if you pay attention to environmental advocacy groups like NRDC and the full-time media which hypes every little hot spell for ratings and to support their ideological agenda.
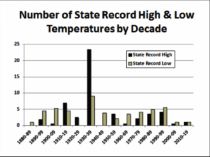
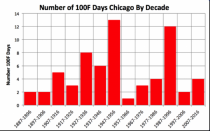
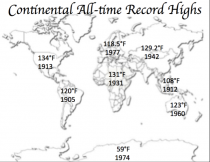
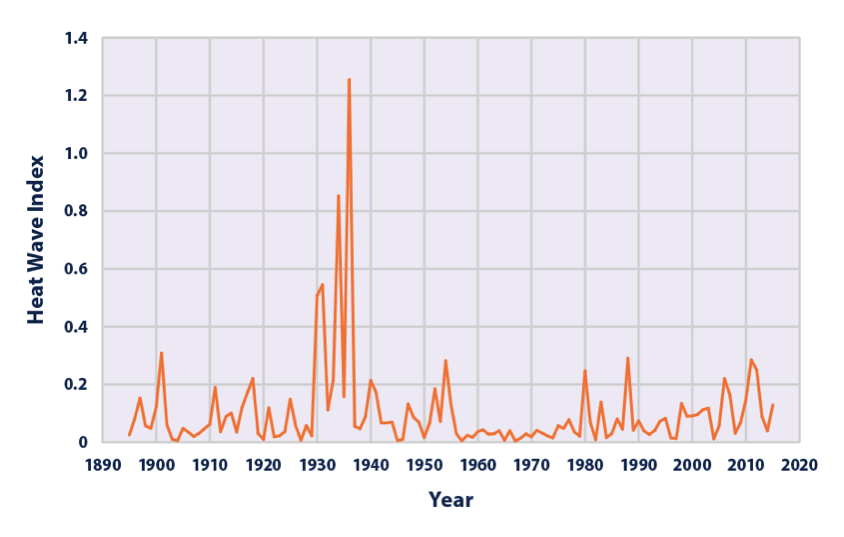
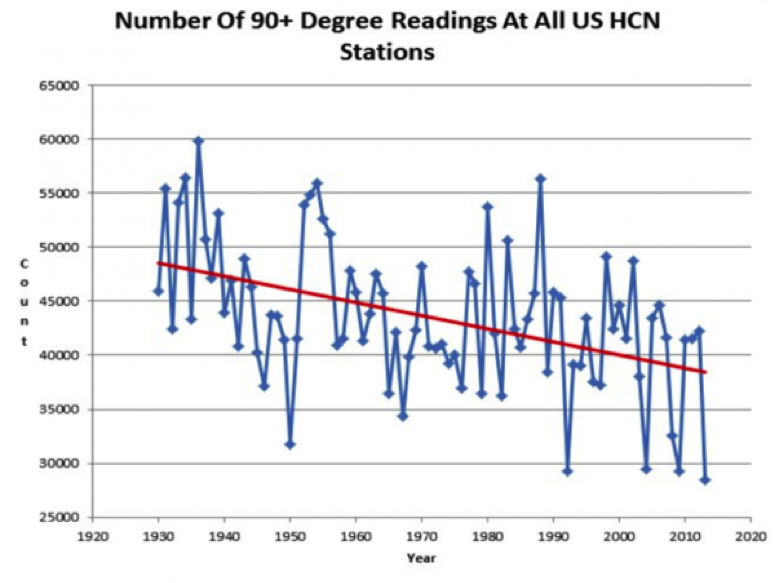
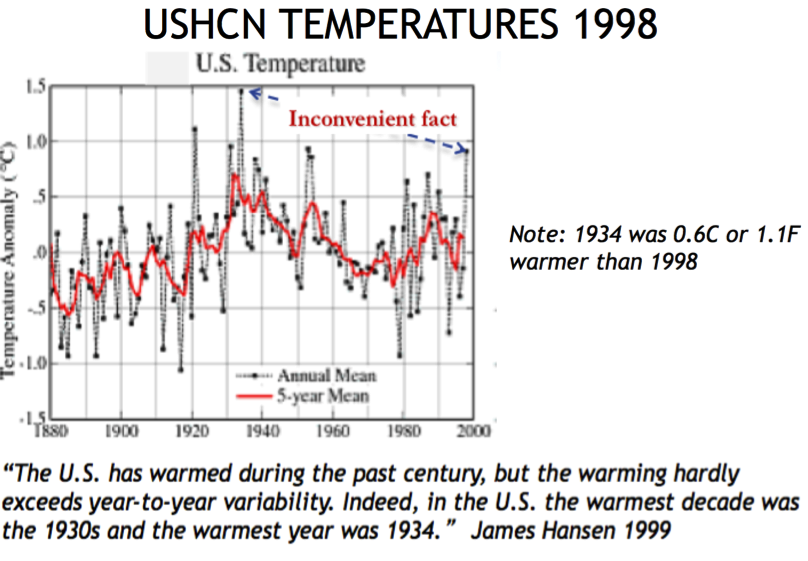
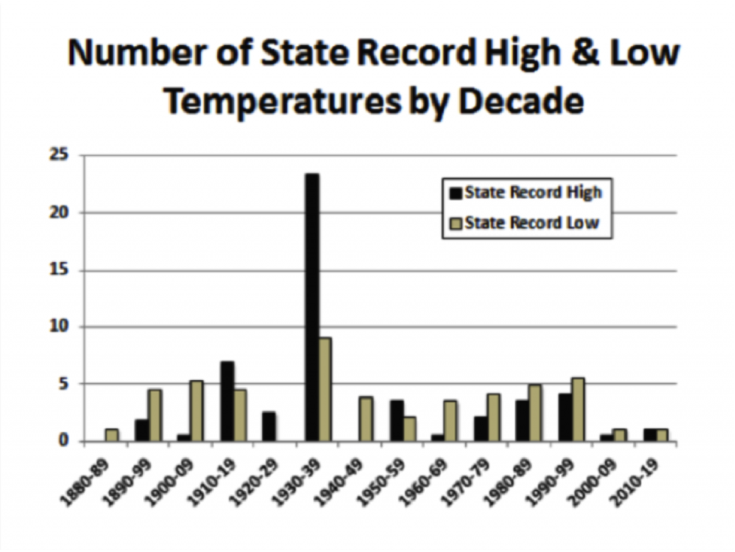
Most all-time record highs here in the U.S. happened many years ago, long before man-kind was using much fossil fuel. The Environmental Protection Agency Heat Wave Index confirms the 1930s as the hottest decade. James Hansen while at NASA in 1999 said about the U.S. temperature record “In the U.S. the warmest decade was the 1930s and the warmest year was 1934”. Thirty-eight states set their all-time record highs before 1960. Here in the United States, the number of 100F, 95F and 90F days per year has been steadily declining since the 1930s.
Christy 2017 Enlarged
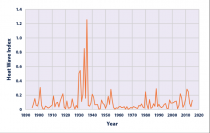
EPA Heat Wave Index (Kunkel 2016) Enlarged
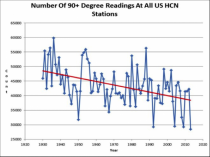
Source: NOAA USHN Heller Enlarged
There has been no increase in heat waves in the United States or elsewhere in the world, but you would never know it if you pay attention to environmental advocacy groups like NRDC and the fulltime media which hypes every little hot spell for ratings and to support their ideological agenda.
Most all-time record highs here in the U.S. happened many years ago, long before man-kind was using much fossil fuel. The Environmental Protection Agency Heat Wave Index confirms the 1930s as the hottest decade. James Hansen while at NASA in 1999 said about the U.S. temperature record “In the U.S. the warmest decade was the 1930s and the warmest year was 1934”. Thirty-eight states set their all-time record highs before 1960. Here in the United States, the number of 100F, 95F and 90F days per year has been steadily declining since the 1930s.
Christy 2017 Enlarged
EPA Heat Wave Index (Kunkel 2016) Enlarged
Enlarged
Source: NOAA USHN Heller
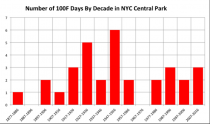
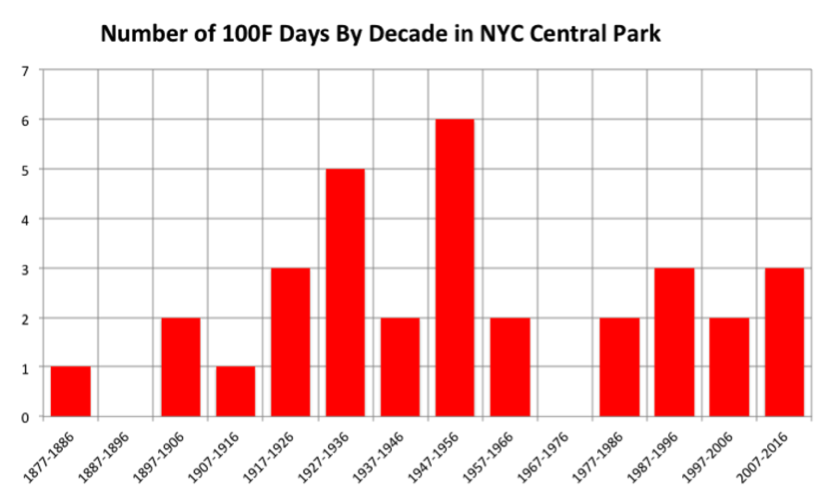
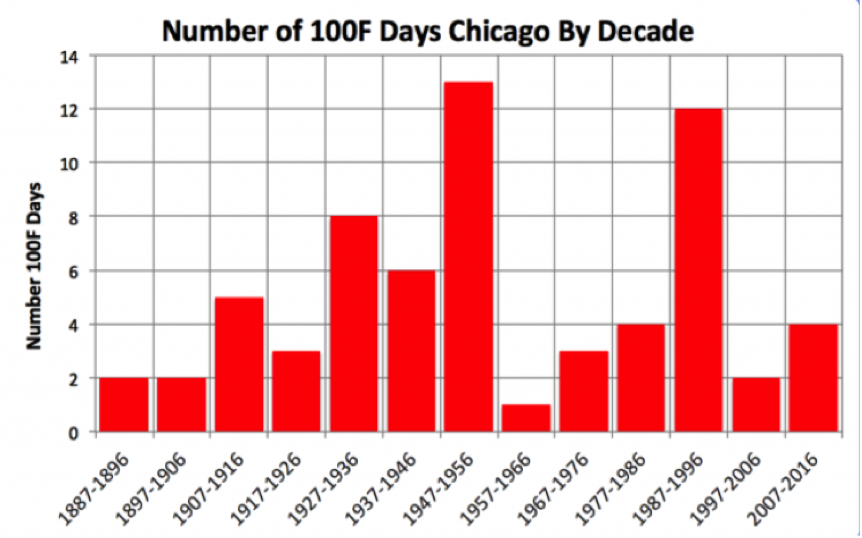
Many major cities show cyclical patterns but with the warmth greatest in the 1930s to 1950s.
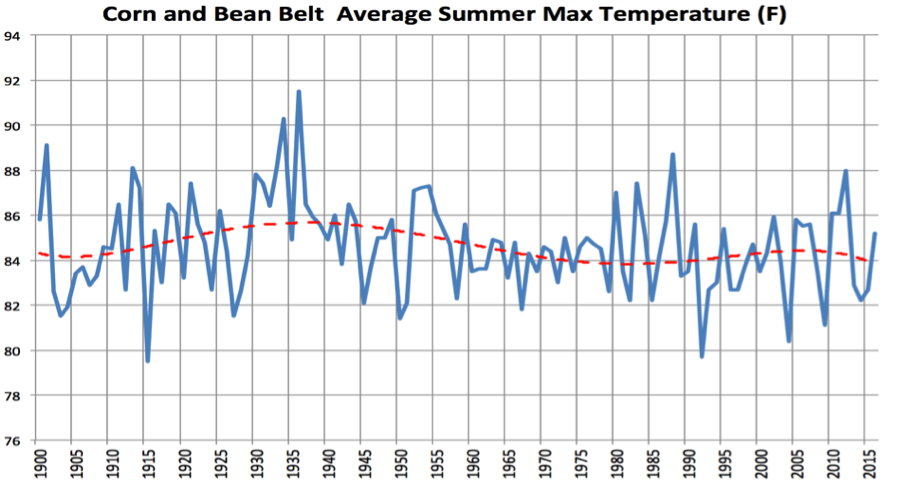
NOAA NCEI data show the average summer maximum temperatures in the Corn and Bean Belt peaked in the 1930s.
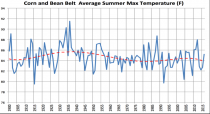
Iowa State University did a study of 90F days in the growing areas of the Midwest, comparing the three decades 1981 to 2010 to the prior three decades 1951 to 1980. They found in most areas of the heartland there was a decline, as many as 14 days.
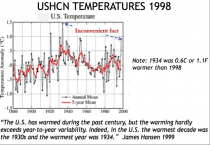
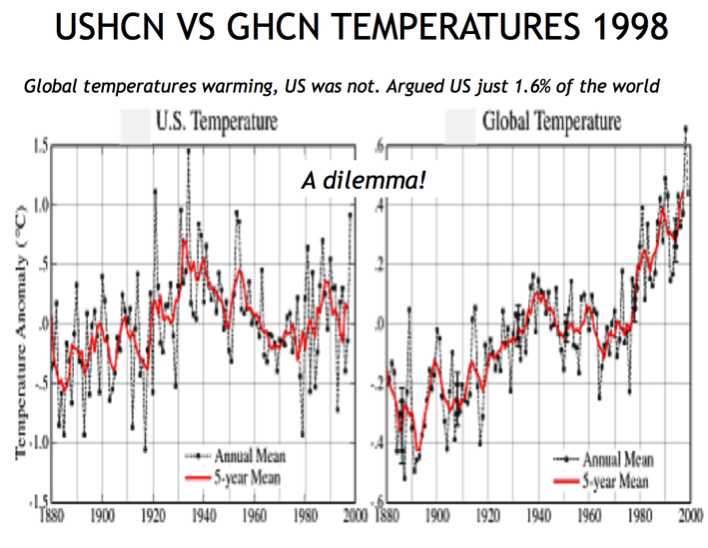
The original USHCN annual temperature plot in 1999 showed a cyclical change in temperatures but with no warming trend. it had the 1930s as the warmest decade and 1934 the warmest year (in the words of James Hansen). The original reply was a disclaimer on the GISS site (US is just 2% of the world).
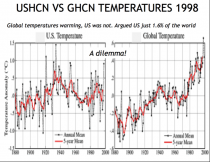
This was an Inconvenient truth when compared to global temperatures which looked like the desired hockey stick matching CO2.
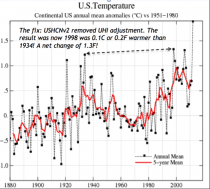
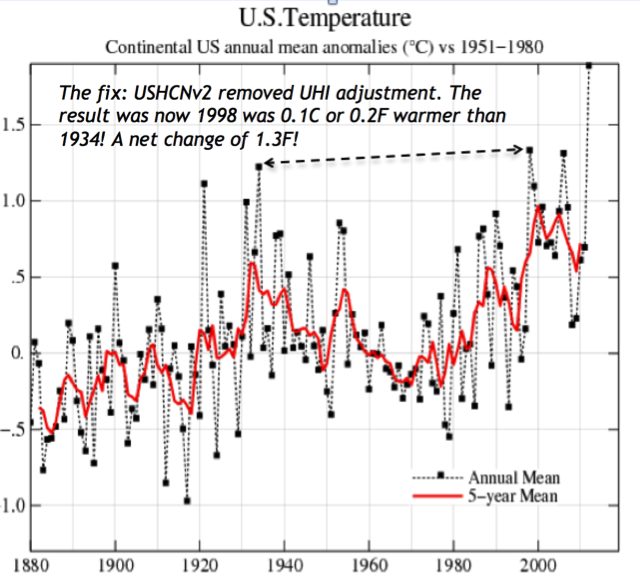
The NOAA solution was to remove the UHI and make other adjustments like homogenization to play whack-a-mole with what Wigley and others referred to as the ‘bothersome warm blip’ around 1940.
Despite the lack of real heat, government agencies have made changes to the weather records in recent years to be able to declare months and years among the warmest in the record, which are not at all supported by the un-manipulated data. The government agencies who managed these changes were on a politically driven mission to further the climate change frenzy and funding.
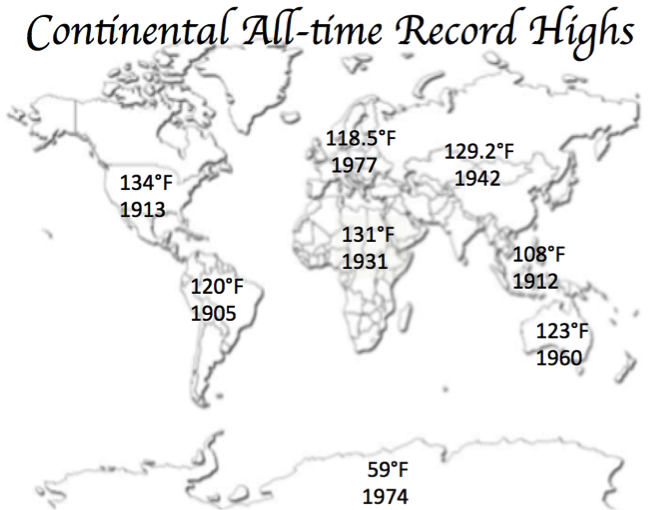
When challenged on the declining heat records in the U.S, the old reply that the U.S. is just 2% of the world reappeared. However, perversely, all 8 continents recorded their all-time record highs before 1980. Believe it or not, when I was challenged with the US is 2% of the world w/r to warming, and I presented this global fact, i was accused of cherry picking. You can’t win an argument with zealots.
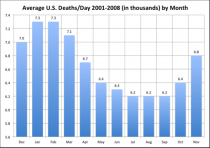
Interestingly while the media gives a great deal of coverage to even minor heat waves to support the case that man-made global warming is occurring, the media tends to ignore deadly cold waves. But in actual fact worldwide cold kills 20 times as many people as heat. This is documented in the “Excess Winter Mortality” which shows that the number of deaths in the 4 coldest winter months is much higher than the other 8 months of the year. The USA death rate in January and February is more than 1000 deaths per day greater than in it is July and August.
Clearly we don’t have a problem with increased Heat Waves because of Climate Change. We have an issue with a movement that has too much to lose to not perform in the media circus with models posing as data or corrupted data.
---------
Although well received and widely distributed, our recent press release and research paper hit a raw nerve with alarmists. The research sought to validate the current estimates of Global Average Surface Temperatures (GAST) using the best available relevant data. The conclusive findings were that the three GAST data sets are not a valid representation of reality. In fact, the magnitude of their historical data adjustments, which removed their cyclical temperature patterns, is totally inconsistent with published and credible U.S. and other temperature data.
Thus, despite current claims of record setting warming, it is impossible to conclude from the NOAA, NASA and UK Hadley CRU GAST data sets that recent years have been the warmest ever.
Finally, since GAST data set validity is a necessary condition for EPA’s CO2 Endangerment Finding, it too is invalidated by these research findings. This means that EPA’s 2009 claim that CO2 is a pollutant has been decisively invalidated by this research.
We had shown in prior research reports here and here how even if you ignore the adjustments, the changes observed can be explained entirely by natural factors (ocean cycles, solar cycles and volcanism). If one considers the urban heat island contamination of surface date, the idea that temperatures may actually be declining since the 1930s in cyclical fashion, very much in line with record highs.
The media fact checkers, which serve often as enforcers of orthodoxy, could not meaningfully question the data or science presented but challenged the claim that it was ‘peer reviewed’ (in the sense the peer review process has been defined today by the ‘advocacy’ journals’ (really ‘pal review’![]() .
.
Our research reports were rigorously peer reviewed by top scientists. The reports follow the approach long used in industry often for their own internal use. The reports were prepared by author teams with the requisite skills at proper data collection, a deep understanding of the scientific factors involved and statistical skills to evaluate what best explains the observed changes.
To abide by the scientific method, the work must be capable of being replicated. Our highly qualified reviewers who endorsed it are capable of evaluating the work scientifically and or statistically. They approval includes a willingness, even eagerness to endorse the work. The data and the methodology is available for others to replicate.
Our approach follows the long accepted application of the scientific method in a world where science is too politicized.