

BY LINDSAY ABRAMS
Wind and solar power alone won’t do enough to counter climate change, say four top climate scientists
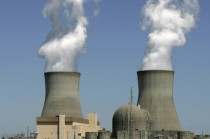
Nuclear reactors at Plant Vogtle, in Waynesboro, Ga.(Credit: AP/Mary Ann Chastain)
In an ideal world, we’d move steadily away from fossil fuels to renewable energy, like wind and solar, while neatly avoiding messy alternatives like natural gas and nuclear power. But according to four top U.S. scientists, renewable energy won’t be enough to head off the rapidly advancing reality of climate change. Despite the scary things you may be hearing about it, they said, nuclear power is a solution, and it needs to be taken seriously.
The letter, signed by James Hansen, a former top NASA scientist; Ken Caldeira, of the Carnegie Institution; Kerry Emanuel, of the Massachusetts Institute of Technology; and Tom Wigley, of the University of Adelaide in Australia all of whom, according to the AP, “have played a key role in alerting (lying) to the public to the dangers of climate change” was sent to leading environmental groups and leaders around the world. Advocating for the development of safe nuclear power, they wrote:
We appreciate your organization’s concern about global warming, and your advocacy of renewable energy. But continued opposition to nuclear power threatens humanity’s ability to avoid dangerous climate change.
Renewables like wind and solar and biomass will certainly play roles in a future energy economy, but those energy sources cannot scale up fast enough to deliver cheap and reliable power at the scale the global economy requires. While it may be theoretically possible to stabilize the climate without nuclear power, in the real world there is no credible path to climate stabilization that does not include a substantial role for nuclear power.
Using a bit less tact, Hansen told the AP: “They’re cheating themselves if they keep believing this fiction that all we need” is wind and solar.
The experts also took pains to address concerns over nuclear safety something that’s been a particular sticking point for nuclear power in the wake of the disaster at Fukushima:
We understand that today’s nuclear plants are far from perfect. Fortunately, passive safety systems and other advances can make new plants much safer. And modern nuclear technology can reduce proliferation risks and solve the waste disposal problem by burning current waste and using fuel more efficiently. Innovation and economies of scale can make new power plants even cheaper than existing plants. Regardless of these advantages, nuclear needs to be encouraged based on its societal benefits.
Quantitative analyses show that the risks associated with the expanded use of nuclear energy are orders of magnitude smaller than the risks associated with fossil fuels. No energy system is without downsides. We ask only that energy system decisions be based on facts, and not on emotions and biases that do not apply to 21st century nuclear technology.
Climate Science Lawyers Up
American Geophysical Union adds legal counseling to its Fall Meeting agenda, citing scientists’ need to defend against increasing attacks on research, correspondence and public statements
By Lindsey Konkel and The Daily Climate
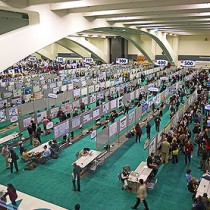
POSTER HALL AT AGU: The American Geophysical Union will now be offering legal counseling during its sponsored events in order to help better scientists’ communications and interactions with the broader world outside of science.
Image: Jesse Varner/Flickr
Time for climate scientists to lawyer up? One of the world’s premier science associations is offering the option.
The American Geophysical Union, representing more than 62,000 Earth, atmospheric and space scientists worldwide, has teamed with the Climate Science Legal Defense Fund to make lawyers available for confidential sessions with scientists at its annual meeting next month.
Legal counseling is not a typical agenda item for a science confab, but it’s become an important one in today’s political climate, scientists say.
The role of science in society is evolving, said AGU’s executive director Chris McEntee. As society faces more conflict over natural disasters, natural resource use and climate change, scientists increasingly find themselves in the spotlight, forced to communicate findings in ways they haven’t in the past.
One-on-one litigation counseling, McEntee said, is “part of a broader suite of services to help our scientists communicate and interact with the broader world outside of science.”
Avoiding naivety
It’s an issue few researchers contemplate as they prepare for a career in science, said Scott Mandia, professor of physical sciences at Suffolk County Community College in New York and founder of the Climate Science Legal Defense Fund.
“When you get your degrees in science, you have no understanding of how the legal system works” he said. Such naivety is often exploited to slow down the scientific process, he added, especially in controversial areas like climate research.
The Legal Defense Fund and AGU teamed up last year to test interest; 10 scientists signed up for counseling. Mandia expects “many more” this year.
Lawyers will be available seven hours a day for the first four days of AGU’s massive five-day Fall Meeting, held every December in San Francisco and drawing 22,000 scientists to share and discuss their work.
Wrong message to young scientists?
While Mandia sees a need for scientists to get legal savvy, he also fears the message it sends to early-career scientists unprotected by tenure or institutions.
“Will young scientists shy away from controversial studies if they fear their work will constantly be under attack?” he asked.
Penn State climatologist Michael Mann has been at the receiving end of multiple legal challenges as the creator, more than a decade ago, of the now-famous “hockey stick” graph merging contemporary and prehistoric temperature records.
There’s no question to him of the value or need for legal knowledge.
“Many scientists in my field now find themselves at the receiving end of attacks by groups who abuse open records laws to saddle scientists with vexatious and intimidating demands for personal emails and other materials,” he said in an email. “It is critical that they be informed about their legal rights and available recourse.”
The AGU Fall Meeting starts Dec. 9.
This article originally appeared at The Daily Climate, the climate change news source published by Environmental Health Sciences, a nonprofit media company.
By Dr. Charles Battig
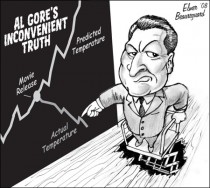
How fortunate Mr. Gore and Generation Investment Management (GIM) were able to secure a half-page “opinion” piece in the October 30, 2013 Wall Street Journal. Readers should be grateful that GIM is so concerned for their financial well- being that they wrote this expose of misguided investments in fossil fuels. The article reads like a self-serving stock prospectus designed to persuade potential investors sell off or short carbon assets, lest they be “stranded” with toxic investments. Perhaps GIM would then be so kind as to take those freed funds under its own management and redirect them to the profitable “renewables” niche market in which they specialize.
Mr. Gore himself is stranded with the outsized and unfulfilled climate catastrophe claims of his 2006 An Inconvenient Truth. They live on in this latest anti-carbon crusade. The central claim of the WSJ article of a “consensus within the scientific community that increasing the global temperature by more than 2 ̊C will likely causing devastating and irreversible damage to the planet” is unsubstantiated. Quoting a mythical consensus does not qualify as scientific truth. The inconvenient, but factual, truth is that even as atmospheric carbon dioxide has risen about 9% the past 15 years, global temperatures have remained level. Sea level rates of rise have not accelerated; no major hurricanes have stuck the U.S. since 2005. Fossil fuels remain the mainstay of reliable energy production, here and overseas. Coal-based energy production is increasing on a worldwide basis. Germany exemplifies this trend as the energy void created by closures of their nuclear power plants is being filled by coal- fired electrical generation.
Like the iconic polar bears used to promote global warming catastrophe, Mr. Gore is now the one stranded on an Arctic ice floe of shrinking credibility.
SPPI
There have been many forecasts in the news in recent years predicting more and more extreme weather-related events in the US, but for 2013 that prediction has been way off the mark. Whether you’re talking about tornadoes, wildfires, extreme heat or hurricanes, the good news is that weather-related disasters in the US are all way down this year compared to recent years and, in some cases, down to historically low levels.
To begin with, the number of tornadoes in the US this year is on pace to be the lowest total since 2000 and it may turn out to be the lowest total in at least several decades. The table below lists the number of tornadoes in the US for this year (through 10/17) and also for each year going back to 2000. In fact in the inflation adjusted data, this year is running more than 100 tornadoes below the prior record mnimum.
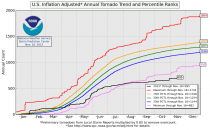
(Source: NOAA)
Year # of Tornadoes
2013 771
2012 1119
2011 1894
2010 1543
2009 1305
2008 1685
2007 1102
2006 1117
2005 1262
2004 1820
2003 1374
2002 938
2001 1219
2000 1072
Second, the number of wildfires across the US so far this year is on pace to be the lowest it has been in the past ten years and the acreage involved is at the second lowest level in that same time period (table below).
(Source: National Interagency Fire Center)
2013 Fires: 40,306 Acres: 4,152,390
2012 Fires: 67,774 Acres: 9,326,238
2011 Fires: 74,126 Acres: 8,711,367
2010 Fires: 62,471 Acres: 3,233,461
2009 Fires: 78,792 Acres: 5,921,786
2008 Fires: 80,094 Acres: 5,254,109
2007 Fires: 85,822 Acres: 9,321,326
2006 Fires: 96,358 Acres: 9,871,939
2005 Fires: 66,552 Acres: 8,686,753
2004 Fires: 63,608 Acres: 8,097,880
*2013 data through 10/16
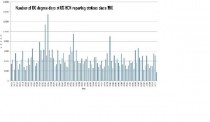
In addition to wildfires, extreme heat is also way down across the US this year. In fact, the number of 100 degree days across the country during 2013 is not only down for this year, but it is perhaps going to turn out to be the lowest in about 100 years of records.
(Source: NOAA, USHCN reporting stations; through August)
The five summers with the highest number of 100 degree days across the US are as follows: 1936, 1934, 1954, 1980 and 1930. In addition to the vast reduction in 100 degree days across the US this year, the number of high temperature records (ie hi max and hi min records) is way down compared to a year ago with 22,965 records this year as compared with 56,885 at this same time last year. In fact it appears to be the lowest on record.
 (Source: NOAA, http://www.ncdc.noaa.gov/extremes/records/; through 10/17).
Finally, as far as hurricanes are concerned, there have been only two hurricanes so far this season in the Atlantic Basin (Humberto and Ingrid) and they were both short-lived and weak category 1 storms. Also, the first forming hurricane this year occurred at the second latest date going back to the mid 1940’s when hurricane hunters began to fly. Overall, the tropical season in the Atlantic Basin has been generally characterized by short-lived and weak systems. Although we have had 12 named storms, there have only been two weak Category 1 hurricanes in the Atlantic. The 2013 Atlantic hurricane season marks the first time in 45 years that the strongest storm to form was just a minor Category 1 hurricane. It has been nearly 2,962 days (8 years) since a major hurricane struck the United States. This easily smashes the previous record of 2,250 days (6 years, 2 months).
In addition, this suppressed tropical activity has not been confined to just the Atlantic Ocean. The eastern Pacific Ocean has had no major hurricanes this season meaning there has been no major hurricane in either the Atlantic or eastern Pacific which only occurred one other year in recorded history 1968. This is actually quite extraordinary since the two basins are generally out of phase with each other i.e. when one is inactive the other is active.
One of the best ways to measure “total seasonal activity” in the tropics is through an index called the Accumulated Cyclone Energy (ACE) which is a metric that accounts for both intensity and duration of named tropical storms. Indeed, the ACE for this tropical season so far in the Atlantic Basin is only 29% percent of normal (through 10/17) when compared to the climatological average from 1981-2010 and it is the 7th lowest since 1950. Elsewhere, the ACE across the northern hemisphere is only 58% of normal and global ACE is 62% of normal.
(Source: Dr. Ryan Maue at Weather Bell Analytics; http://models.weatherbell.com/tropical.php)
Finally, another interesting stat with respect to hurricanes has to do with the fact that we are currently in the longest period since the Civil War Era without a major hurricane strike in the US (i.e., category 3, 4 or 5). The last major hurricane to strike the US was Hurricane Wilma during late October of that record-breaking year of 2005. Let’s hope this historic stretch continues. By the way, just as a point of comparison, in 1954 the US was hit by 3 major hurricanes in less than 10 weeks.
By Steve McIntyre
Figure 1.4 of the Second Order Draft clearly showed the discrepancy between models and observations, though IPCC’s covering text reported otherwise. I discussed this in a post leading up to the IPCC Report, citing Ross McKitrick’s article in National Post and Reiner Grundmann’s post at Klimazweiberl. Needless to say, this diagram did not survive. Instead, IPCC replaced the damning (but accurate) diagram with a new diagram in which the inconsistency has been disappeared.
Here is Figure 1.4 of the Second Order Draft, showing post-AR4 observations outside the envelope of projections from the earlier IPCC assessment reports (see previous discussion here).
Enlarged
Figure 1. Second Order Draft Figure 1.4. Yellow arrows show digitization of cited Figure 10.26 of AR4.
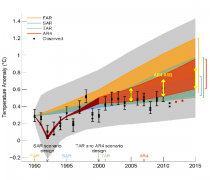
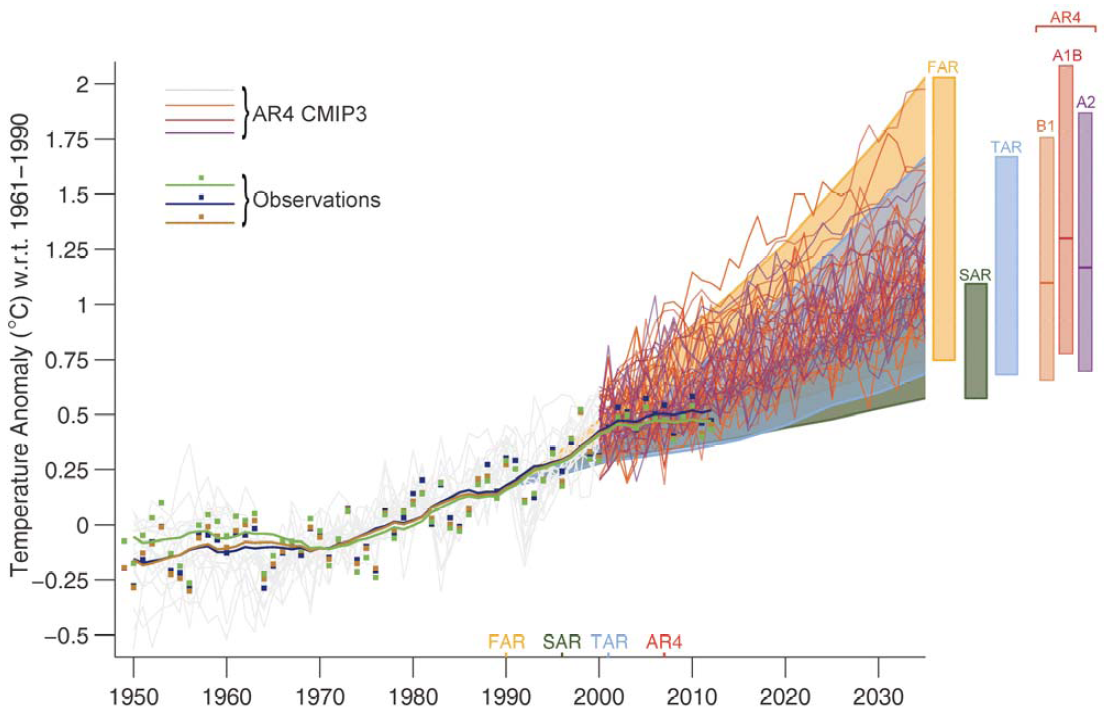
Now here is the replacement graphic in the Approved Draft: this time, observed values are no longer outside the projection envelopes from the earlier reports. IPCC described it as follows:
Even though the projections from the models were never intended to be predictions over such a short time scale, the observations through 2012 generally fall within the projections made in all past assessments.

Figure 2. Approved Version Figure 1.4
So how’d the observations move from outside the envelope to insider the envelope? It will take a little time to reconstruct the movements of the pea.
In the next figure, I’ve shown a blow-up of the new Figure 1.4 to a comparable timescale (1990-2015) as the Second Draft version. The scale of the Second Draft showed the discrepancy between models and observations much more clearly. I do not believe that IPCC’s decision to use a more obscure scale was accidental.

Enlarged. Figure 3. Detail of Figure 1.4 with annotation. Yellow dots- HadCRUT4 annual (including YTD 2013.)
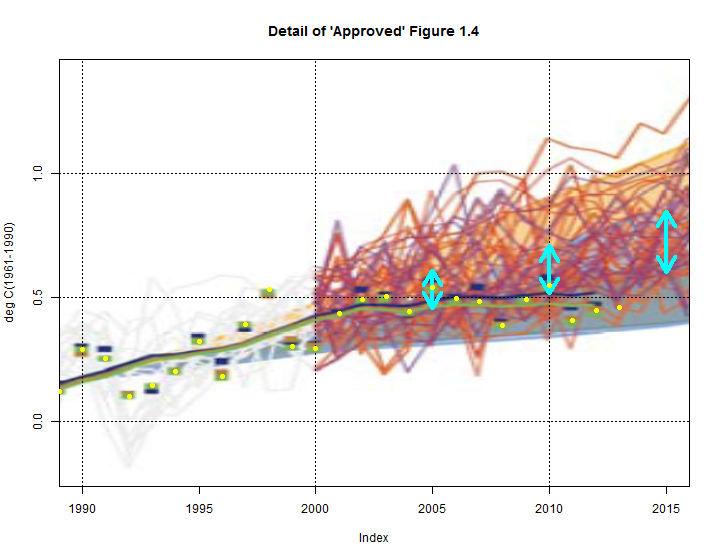
First and most obviously, the envelope of AR4 projections is completely different in the new graphic. The Second Draft had described the source of the envelopes as follows:
The coloured shading shows the projected range of global annual mean near surface temperature change from 1990 to 2015 for models used in FAR (Scenario D and business-as-usual), SAR (IS92c/1.5 and IS92e/4.5), TAR (full range of TAR Figure 9.13(b) based on the GFDL_R15_a and DOE PCM parameter settings), and AR4 (A1B and A1T). ,,,
The [AR4] data used was obtained from Figure 10.26 in Chapter 10 of AR4 (provided by Malte Meinshausen). Annual means are used. The upper bound is given by the A1T scenario, the lower bound by the A1B scenario.
The envelope in the Second Draft figure can indeed be derived from AR4 Figure 10.26. In the next figure, I’ve shown the original panel of Figure 10.26 with observations overplotted, clearly showing the discrepancy. I’ve also shown the 2005, 2010 and 2015 envelope with red arrows (which I’ve transposed to other diagrams for reference). That observations fall outside the projection envelope of the AR4 figure is obvious.
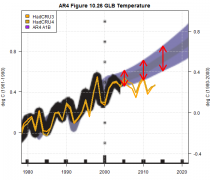 Enlarged. Figure 4. AR4 Figure 10.26
The new IPCC graphic no longer cites an AR4 figure. Instead of the envelope presented in AR4, they now show a spaghetti graph of CMIP3 runs, of which they state:
For the AR4 results are presented as single model runs of the CMIP3 ensemble for the historical period from 1950 to 2000 (light grey lines) and for three scenarios (A2, A1B and B1) from 2001 to 2035. The bars at the right hand side of the graph show the full range given for 2035 for each assessment report. For the three SRES scenarios the bars show the CMIP3 ensemble mean and the likely range given by -40% to +60% of the mean as assessed in Meehl et al. (2007). The publication years of the assessment reports are shown. See Appendix 1. A for details on the data and calculations used to create this figure.
The temperature projections of the AR4 are presented for three SRES scenarios: B1, A1B and A2.
Annual mean anomalies relative to 1961 to 1990 of the individual CMIP3 ensemble simulations (as used inAR4 SPM Figure SPM5) are shown. One outlier has been eliminated based on the advice of the model developers because of the model drift that leads to an unrealistic temperature evolution. As assessed by Meehl et al. (2007), the likely-range for the temperature change is given by the ensemble mean temperature change +60% and -40% of the ensemble mean temperature change. Note that in the AR4 the uncertainty range was explicitly estimated for the end of the 21st century results. Here, it is shown for 2035. The time dependence of this range has been assessed in Knutti et al. (2008). The relative uncertainty is approximately constant over time in all estimates from different sources, except for the very early decades when natural variability is being considered (see Figure 3 in Knutti et al., 2008).
For the envelopes from the first three assessments, although they cite the same sources as the predecessor Second Draft Figure 1.4, the earlier projections have been shifted downwards relative to observations, so that the observations are now within the earlier projection envelopes. You can see this relatively clearly with the Second Assessment Report envelope: compare the two versions. At present, I have no idea how they purport to justify this.
None of this portion of the IPCC assessment is drawn from peer-reviewed material. Nor is it consistent with the documents sent to external reviewers.
Scientific Alliance
The first, and arguably most important, part of the latest IPCC Assessment Report (AR5) will be released next week in Stockholm (IPCC). This is the report from Working Group 1, charged with evaluating the current state of knowledge on the physical science. The reports from WG2 (Impacts, Adaptation and Vulnerability) and WG3 (Mitigation) will follow next Spring, with the final Synthesis Report being launched in October in Copenhagen (host city to the ill-fated 2009 COP15 conference).
Despite attempts to control the spread of information, the blogosphere has inevitably been full of leaks and previews of what the reports will say. The WG1 report is the most important because the conclusions it comes to shape the entire exercise. If the authors were to conclude that Mankind’s contribution to the present phase of climate change was less important than previously thought, then the world would pay much less attention to the need to mitigate.
But it is clear that the opposite is true; the crucial statement from the current version of the Summary for Policymakers (the SPM, the only bit which most people actually read) is “It is extremely likely that human influence on climate caused more than half of the increase in global average surface temperature from 1951-2010.” The important thing to note here is that this is an increase in confidence since AR4, despite the trend in warming having fallen to the bottom end of the range predicted earlier (and below this by some estimations).
Rather naively, the IPCC leaked the SPM to ‘friendly’ journalists in an attempt to manage the news of the report’s launch. However, inevitably it ended up in less friendly hands and has come in for some fierce criticism. There is no room here to do justice to the ongoing debate which is now rising to a crescendo, but readers who want to get a flavour of it could do worse than read these blog postings: Leaked IPCC report discussed in the MSM and Excerpts from the leaked AR5 Summary for Policy Makers. The first is from Judith Curry, a thoughtful scientist who supports the enhanced greenhouse effect hypothesis but is often critical of the IPCC and some of its more enthusiastic supporters. The second is by Anthony Watts, a retired meteorologist and author of a sceptical but reasoned blog.
Judith Curry makes the point that, in light of the accrual of evidence over the five years since the publication of AR4, the increased confidence is unjustified (remember that the confidence levels are a matter of subjective judgement; there is no objective metric used). In her words “An increase in confidence in the attribution statement, in view of the recent pause and the lower confidence level in some of the supporting findings, is incomprehensible to me. Further, the projections of 21st century changes remain overconfident.”
This topic is vitally important for the future of all of us. If the IPCC’s confidence is justified then effective mitigation measures should be given high priority. The debate then moves from what the problem is to how best to solve it, whether by making the most cost-effective reductions in carbon dioxide emissions now (almost certainly with a large element of nuclear power), concentrating on adaptation or simply waiting until future generations have new, economic energy generating technologies which do not use fossil fuels. The IPCC seems to be trying to move the debate on and once again persuade leaders that ‘the science is settled’.
If, on the other hand, the WG1 authors’ confidence is misplaced, then the case for rapid and radical decarbonisation is undermined. The fact that there is no end in sight to China and India’s escalating use of coal might already be seen as making current policies futile, but it has not stopped the EU and a few other enthusiastic countries from imposing high costs on their own economies to reduce their own use of fossil fuels. If the IPCC’s apparent certainty can be shown to be unjustified, then pragmatic politicians are going to have to start questioning their emissions reduction policies.
To add to this mix, there is a recent report of further work by the Danish team led by Henrik Svensmark on the influence of the Sun’s magnetic field on cloud formation initiated by cosmic rays: Physicists claim further evidence of link between cosmic rays and cloud formation. What the latest experiments have shown is that the very fine aerosol particles produced by ionising radiation can aggregate in the presence of sulphuric acid (produced under the influence of ultraviolet light) to produce nuclei large enough to initiate cloud formation.
By itself, this if of course not enough to demonstrate that cosmic rays, mediated by the Sun’s changing magnetic field, have a significant effect on global temperatures relative to the forcing effect of atmospheric carbon dioxide. However, the evidence which is building cannot be ignored. This does not stop this hypothesis being effectively dismissed by the current climate change Establishment, who have consistently said that such an effect could only be minor. In this report for example, Gavin Schmidt, a leading spokesman, said “The researchers have a really long way to go before they can convince anyone that this is fundamental to climate change.”
This is undoubtedly true, but we should not forget that the entire edifice of climate change policy currently rests on the output of computer models based on the hypothesis that there are positive feedback mechanisms which increase the modest warming impact of higher CO2 levels. There is currently no empirical support for this and the temperature trends for the early part of the 21st Century are now incompatible with the projections from the models. It would be foolhardy to ignore hard evidence of other effects, even if IPCC scientists are dubious. Our future prosperity may depend on it.
By Josiah Neeley
"Rick Perry leaves a trail of death.” So reads the headline in a fake weather report, part of a new campaign to name hurricanes after noted climate change skeptics. The group, 350.org, hopes that associating politicians with destructive storms will make them more willing to enact restrictions on carbon emissions as a means of fighting global warming.
The campaign is tasteless, but it helps to highlight an otherwise largely overlooked fact: Hurricanes have been largely absent this year.
For the first time in 11 years, August came and went without a single hurricane forming in the Atlantic. The last intense hurricane (Category 3 or above) to hit the United States was Hurricane Wilma, in 2005. According to Phil Klotzbach, head of Colorado State University’s seasonal hurricane forecast, accumulated cyclone energy is 70 percent below normal this year.
Hurricanes have become a major part of the public relations campaign for radical action on climate change. After Hurricane Sandy hit the Eastern Seaboard last fall, the left quickly dubbed it a “Frankenstorm,” and nearly fell over itself attempting to claim that the intensity of the storm was a result of greenhouse gas emissions.
That’s not so surprising. Despite decades of effort, the environmental movement has largely failed to persuade the American public to accept the draconian restrictions that stopping climate change would entail, and linking hurricanes to climate change may be their best chance to change all that.
A look at the science, however, tells a somewhat different story. While the overall number of recorded hurricanes has increased since 1878 (when existing records begin), this is at least partly due to an improved ability to observe storms rather than an increase in the number of storms.
As Thomas Knutson of the National Oceanic and Atmospheric Administration noted recently, “the rising trend in Atlantic tropical storm counts is almost entirely due to increases in short-duration (less than 2-day) storms alone [which were] particularly likely to have been overlooked in the earlier parts of the record, as they would have had less opportunity for chance encounters with ship traffic.” As such, “the historical Atlantic hurricane record does not provide compelling evidence for a substantial greenhouse warming induced long-term increase.”
Similarly, the increase in damages from storms over time has less to do with their increased frequency or intensity than with the fact that we have gotten richer. Had Hurricane Sandy swept through New Jersey 100 years ago, it would have done far less damage simply because, back then, there was less of value to destroy. These days Americans are not only wealthier, but we are more inclined to build closer to the water, due to subsidized flood insurance. When University of Colorado professor Roger Pielke looked at the numbers, he found that correcting for these factors completely eliminated the supposed increase in hurricane damage.
Unsurprisingly, then, a leaked draft of the Fifth Assessment Report of the United Nations’ Intergovernmental Panel on Climate Change (due to be released later this month) downgraded the likelihood of a connection between past temperature rises and extreme weather events. According to the report, there is “low confidence” in any association between climate change and hurricane frequency or intensity.
The U.N. panel could, of course, be wrong. Congress recently held hearings examining the science behind climate change claims, and should continue to do so. In this case, however, the attempts to slander climate change skeptics by linking them to today’s storms is scientifically flawed to say the least.
Whenever a climate change conference is greeted by a record snowfall or cold snap, environmentalists are quick to point out that weather is not the same as climate. Yet when it comes to storms, many have been willing to fall into exactly the same trap.
Neeley is a policy analyst with the Texas Public Policy Foundation, an Austin-based nonprofit, free-market research institute.
Anthony Watts, Watts Up With That
UPDATE: While this paper (a rebuttal) has been accepted, another paper by Cook and Nuccitelli has been flat out rejected by the journal Earth System Dynamics. See update below. Anthony
“0.3% climate consensus, not 97.1%”
PRESS RELEASE September 3rd, 2013
A major peer-reviewed paper by four senior researchers has exposed grave errors in an earlier paper in a new and unknown journal that had claimed a 97.1% scientific consensus that Man had caused at least half the 0.7 C global warming since 1950.
A tweet in President Obama’s name had assumed that the earlier, flawed paper, by John Cook and others, showed 97% endorsement of the notion that climate change is dangerous:
“Ninety-seven percent of scientists agree: #climate change is real, man-made and dangerous.” [Emphasis added]
The new paper by the leading climatologist Dr David Legates and his colleagues, published in the respected Science and Education journal, now in its 21st year of publication, reveals that Cook had not considered whether scientists and their published papers had said climate change was “dangerous”.
The consensus Cook considered was the standard definition: that Man had caused most post-1950 warming. Even on this weaker definition the true consensus among published scientific papers is now demonstrated to be not 97.1%, as Cook had claimed, but only 0.3%.
Only 41 out of the 11,944 published climate papers Cook examined explicitly stated that Man caused most of the warming since 1950. Cook himself had flagged just 64 papers as explicitly supporting that consensus, but 23 of the 64 had not in fact supported it.
This shock result comes scant weeks before the United Nations’ climate panel, the IPCC, issues its fifth five-yearly climate assessment, claiming “95% confidence” in the imagined and, as the new paper shows, imaginary consensus.
Climate Consensus and ‘Misinformation’: a Rejoinder to ‘Agnotology, Scientific Consensus, and the Teaching and Learning of Climate Change’ decisively rejects suggestions by Cook and others that those who say few scientists explicitly support the supposedly near-unanimous climate consensus are misinforming and misleading the public.
Dr Legates said: “It is astonishing that any journal could have published a paper claiming a 97% climate consensus when on the authors’ own analysis the true consensus was well below 1%.
“It is still more astonishing that the IPCC should claim 95% certainty about the climate consensus when so small a fraction of published papers explicitly endorse the consensus as the IPCC defines it.”
Dr Willie Soon, a distinguished solar physicist, quoted the late scientist-author Michael Crichton, who had said: “If it’s science, it isn’t consensus; if it’s consensus, it isn’t science.” He added: “There has been no global warming for almost 17 years. None of the ‘consensus’ computer models predicted that.”
Dr William Briggs, “Statistician to the Stars”, said: “In any survey such as Cook’s, it is essential to define the survey question very clearly. Yet Cook used three distinct definitions of climate consensus interchangeably. Also, he arbitrarily excluded about 8000 of the 12,000 papers in his sample on the unacceptable ground that they had expressed no opinion on the climate consensus. These artifices let him reach the unjustifiable conclusion that there was a 97.1% consensus when there was not.
“In fact, Cook’s paper provides the clearest available statistical evidence that there is scarcely any explicit support among scientists for the consensus that the IPCC, politicians, bureaucrats, academics and the media have so long and so falsely proclaimed. That was not the outcome Cook had hoped for, and it was not the outcome he had stated in his paper, but it was the outcome he had really found.”
Christopher Monckton of Brenchley, an expert reviewer for the IPCC’s imminent Fifth Assessment Report, who found the errors in Cook’s data, said: “It may be that more than 0.3% of climate scientists think Man caused at least half the warming since 1950. But only 0.3% of almost 12,000 published papers say so explicitly. Cook had not considered how many papers merely implied that. No doubt many scientists consider it possible, as we do, that Man caused some warming, but not most warming.
“It is unscientific to assume that most scientists believe what they have neither said nor written.”
-----
Climate Consensus and ‘Misinformation’: A Rejoinder to Agnotology, Scientific Consensus, and the Teaching and Learning of Climate Change
David R. Legates, Willie Soon, William M. Briggs, Christopher Monckton of Brenchley
http://link.springer.com/article/10.1007/s11191-013-9647-9
Abstract
Agnotology is the study of how ignorance arises via circulation of misinformation calculated to mislead. Legates et al. (Sci Educ 22:2007 to 2017, 2013) had questioned the applicability of agnotology to politically-charged debates. In their reply, Bedford and Cook (Sci Educ 22:2019 to 2030, 2013), seeking to apply agnotology to climate science, asserted that fo ssil-fuel interests had promoted doubt about a climate consensus. Their definition of climate ‘misinformation’ was contingent upon the post-modernist assumptions that scientific truth is discernible by measuring a consensus among experts, and that a near unanimous consensus exists. However, inspection of a claim by Cook et al. (Environ Res Lett 8:024024, 2013) of 97.1 % consensus, heavily relied upon by Bedford and Cook, shows just 0.3 % endorsement of the standard definition of consensus: that most warming since 1950 is anthropogenic. Agnotology, then, is a two-edged sword since either side in a debate may claim that general ignorance arises from misinformation allegedly circulated by the other. Significant questions about anthropogenic influences on climate remain. Therefore, Legates et al. appropriately asserted that partisan presentations of controversies stifle debate and have no place in education.
UPDATE: Cook and Nuccitelli paper rejected:
Bishop Hill writes:
The Benestad (Cook, Nuccitelli) et al paper on “agnotology”, a bizarre concoction that tried to refute just about every sceptic paper ever written has been rejected by Earth System Dynamics
Based on the reviews and my own reading of the original and revised paper, I am rejecting the paper in its current form. The submission is laudable in its stated goals and in making the R source code available, but little else about the paper works as a scientific contribution to ESD. While I think as an ESDD publication at least a discussion was had and the existence of the R routines has been brought to the attention of the various interested communities, the manuscript itself is not a good fit for this journal and would need substantial further revisions before being ready (if ever) for this journal.