

By James Taylor
While Harold Camping spends this week trying to wipe egg off his face after real-world events spectacularly falsified his prediction that the Christian rapture would occur on May 21, global warming alarmists are similarly trying to wipe egg off their faces after real-world events spectacularly falsified their predictions of an imminent polar ice rapture.
This week, a 1979 Palm Beach Post article resurfaced in which Steven Schneider, who for the past 30 years was one of the most prominent global warming alarmists, claimed the west Antarctic ice sheet could melt before the year 2000 and inundate American coastlines with up to 25 feet of sea level rise. Obviously, the west Antarctic ice sheet was not raptured away last century, and New Yorkers can still drive rather than swim to work.
If Steven Schneider was the only alarmist making spectacular - and spectacularly wrong - predictions about global warming and polar ice melt, then perhaps we could simply write it off as a single person who walked a little too far off the deep end. But spectacularly wrong global warming predictions, about polar ice and many other global warming-related issues, is par for the course for global warming alarmists.
Mark Serreze, a researcher with the federally funded National Snow and Ice Data Center, frightened the masses in June 2008 by claiming there was a 50-50 chance the North Pole would be ice-free in the upcoming summer. The media reported Serreze’s prediction with a frenzy rarely equaled even among media-created global warming scares. Adding fuel to the fire, global warming alarmists lined up in droves to add their John Hancock to Serreze’s claim. Many prominent alarmists even claimed Serreze was too conservative with his prediction.
For example, Peter Wadhams, head of the Polar Ocean Physics Group at England’s Cambridge University, told the June 27, 2008, London Independent, “People are expecting this [Arctic ice melt] to continue this year and it is likely to extend over the North Pole. It is quite likely that the North Pole will be exposed this summer - it’s not happened before.”
As it turned out, the North Pole never came close to melting, with the Arctic Ocean containing 1.65 million square miles of sea ice at its 2008 minimum.
Much like Camping is now claiming his May 21 Christian rapture prediction was essentially accurate, but that he was merely a few months off regarding the timetable (news alert: beware October 21, 2011!), the alarmists are now claiming their failed North Pole predictions were essentially accurate, but merely a few years off regarding the timetable. They now claim the Arctic Ocean will be essentially ice free by the year 2020 or 2030. Don’t bet on it.
Speaking of bets, I have contacted some of the people making such claims about an imminent polar ice rapture, asking them if they would like to place a wager with me regarding their prediction. It’s funny how they all seem to have misplaced their wallets.
The alarmists, moreover, have not confined their rapture predictions to polar ice.
The Star Chamber of global warming cartels, the United Nations Intergovernmental Panel on Climate Change (IPCC), claimed in its most recent report that global warming is likely to rapture away the Himalayan glaciers by 2035. When investigators discovered there was no scientific evidence to support the claim, and a good deal of scientific evidence countering the claim, the rapture prediction was canceled.
The media spent much of the past decade parroting alarmist claims that global warming was shutting down the Gulf Stream and the Atlantic Ocean Conveyor Belt. That rapture alarm has been canceled, too.
David Viner, a researcher at the University of East Anglia (UK) climatic research unit claimed in the year 2000 that within just a few years, “children just aren’t going to know what snow is” and snowfall will be “a very rare and exciting event.” Here on this side of the pond, prominent alarmist Robert F. Kennedy Jr. said essentially the same thing in 2008. The past two winters, however, were two of the snowiest in history. Real-world climate data, moreover, show annual snow extent is trending up, rather than down, in recent decades. So much for that predicted rapture, too.
The list of failed predictions regarding global warming raptures is no less extensive than the list of failed predictions regarding Christian church raptures. There is one important difference, however. The Harold Campings of the world reside outside the Christian mainstream. Among global warming alarmists, the serially wrong rapturists define the mainstream.
James M. Taylor is senior fellow for environment policy at The Heartland Institute and managing editor of Environment & Climate News.
By Steve McIntyre, Climate Audit
On Oct 21, 2010, Dan Vergano submitted an FOI request to George Mason University for email records of Edward Wegman and Yasmin Said under the Virginia FOI, requesting both expedited treatment and waiver of fees. On November 4, 2010, GMU sent him a flash-drive with the requested information, which included Wegman’s correspondence with a journal about Said et al 2008.
Vergano’s original request was as follows:
Oct 21, 2010 ATI
FOIA REQUEST
Fee benefit requested
Fee waiver requested
Expedited processing requeste
Dear Mr. Hunt:
Pursuant to the Virginia Freedom oflnformation Act (FOIA), located§ 2.2-3700 et seq. of the
Code of Virginia, I request access to and copies of information and documentary materials,
including electronic mail and other communication, made by Dr. Edward J. Wegman and his
associates, Yasmin J. Said and Walid Sharabati, in connection with I or related to the following grants:
1. National Institutes on Alcohol Abuse and Alcoholism grant 1 F32 A A015876-01A1
2. Army Research Office contract W911 NF-04-1-0447
3. Army Research Laboratory under contract W911 NF-07-1-0059
As well as in connection with I or related to the following reports created by some or all of these authors at George Mason University:
1. Computational Statistics & Data Analysis 52 (2008) 2177 - 2184, Said, Y. et al
2. COMPST AT 2008 - Proceedings in Computational Statistics: 18th Symposium Held in Porto, Portugal, 2008 Wegman, E. et al, pp. 173-189
Please note that Dr. Wegman uses the e-mail address: ewegman@gmail.com and Dr. Said uses the email address: yasid99@yahoo.com to conduct university business as seen in 2008 study’s author information, which cites their university affiliations. Please restrict the search to Sept. 1, 2005 to the present ..
If the university employees included in this request inform you that any ofthis material is not available, I am requesting a copy of their communications to that effect. I would like to receive the information in electronic format.
Through this request, I am gathering information on a news story that is of current interest to the public because recently-emerged analysis suggesting scientific misconduct by these state and federally-funded researchers. This information is being sought on behalf of USA TODAY for dissemination to the general public.
Please waive any applicable fees. Release of the information is in the public interest because it will contribute significantly to public understanding of government operations and activities. I am requesting a waiver of fee’s because I am acting to bring this information of conduct that has shaped public perception of a high-profile environmental issue and was used to shape Congressional testimony made by Dr. Wegman. I request that you estimate in advance the charges for supplying the records that I have requested.
If my request is denied in whole or part, I ask that you justify all deletions by reference to
specific exemptions of the act. I will also expect you to release all segregable portions of
otherwise exempt material. I, of course, reserve the right to appeal your decision to withhold any information or to deny a waiver of fees.
As I am making this request as a journalist and this information is of timely value, I would
appreciate your communicating with me by telephone, rather than by mail, if you have questions regarding this request.
Please provide expedited processing of this request which concerns a matter of urgency. As a journalist break for laughter, I am primarily engaged in disseminating information. The public has an urgent need for information about scientific misconduct affecting federally-funded research. I certify that my statements concerning the need for expedited processing are true and correct to the best of my knowledge and belief.
I look forward to your reply within 5 business days, as the statute requires.
Dan Vergano
On October 26, 2010, the University responded as follows:
Dan Vergano
USA TODAY
7950 Jones Branch Drive
McLean, VA 221 08
Dear Mr. Vergano:
I am responding to your email dated October 21, 2010 and as received by this office for
records under the Virginia Freedom of Information Act (§2.2-3 700, et seq.).
Please be advised that, due to the expansive nature of your request, it is practically
impossible to respond to your request within five working days. Therefore, we are invoking
subsection B.4. of §2.2-3704 to provide us with seven additional working days to respond to
your request.
In the meantime, I am
Sincerely yours,
Philip Hunt
On November 4, 2010, the University provided the requested data as follows:
Dan Vergano
USA Today
7950 Jones Branch Drive
McLean, VA 22108
Mr. Vergano,
In accordance with the Virginia Freedom oflnformation Act (§2.2-3700, et seq.) and per your request on October 21, 2010, for “information and documentary materials, including electronic mail and other communication, made by Dr. Edward J. Wegman and his associates, Yasmin J. Said and Walid Sharabati, in connection with I or related to the following grants”:
1. National Institutes on Alcohol Abuse and Alcoholism grant 1 F32 AA015876-01Al
2. Army Research Office contract W911NF-04-1-0447
3. Army Research Laboratory under contract W911NF-07-1-0059
As well as in connection with I or related to the following reports created by some or all of these authors at George Mason University:
1. Computational Statistics & Data Analysis 52 (2008) 2177 - 2184, Said, Y. et al
2. COMPST AT 2008 - Proceedings in Computational Statistics: 18th Symposium Held in Porto, Portugal, 2008 Wegman, E. et al, pp. 173-189
Please find the requested information as electronically copied on the enclosed CD. Further, note that there are no fees associated with your request. If you have any further questions or concerns, please contact me at 7031993-7081.
With Kind Regards,
Philip Hunt
The above information was obtained by ATI through their own recent FOI request to George Mason, who will be forwarding them a CD as well.
According to Mashey, the README included by George Mason stated the “documents may not be forwarded to a third party”. It also included the GMU policy on academic misconduct, stating Bradley had violated the confidentiality terms - a point not reported by USA Today:
The materials in this USB are being provided in compliance with the Virginia FOIA. Many of the documents are published research papers that are copyrighted by their respective publishers. All other documents are copyrighted by Edward J. Wegman and Yasmin H. Said or by their respective authors. All rights are reserved. These documents may not be forwarded to a third party. Also included in this USB is the George Mason University policy document 4007 on academic misconduct. This policy requires confidentiality for all parties including complainants, in this case Professor Raymond Bradley. This confidentiality requirement was violated by Professor Bradley.
The difference in how academic institutions have responded to the seemingly similar requests in respect to Wegman and Mann is quite startling. George Mason gave expedited service to a request for Wegman’s emails; the U of Virginia has done the opposite. George Mason turned over Wegman’s correspondence with an academic journal without litigation; the University of Virginia has spent hundreds of thousands of dollars on litigation. Multiple academic lobby groups protested the production of Mann’s emails as a matter of principle; the same organizations were and remain silent in respect to Wegman.
World Climate Report
Long-debated has been whether or not there is a long-term trend in the number of Atlantic tropical storms and hurricanes.
The answer to this seemingly straightforward question turns out to be complicated because there have been changes in the observing practices over time -including changes in the spatial coverage of observing systems as well as the technologies employed. Therefore, teasing out the real climate signal from the noise induced by the changing nature of the observations has proved challenging and lends itself to a variety of methodologies producing a variety of results.
Of top of this less than perfect solution is the desire (for some at least) to want to try to involve anthropogenic global warming, hoping to find that anthropogenic climate change is leading to more tropical storms and hurricanes. But thus far, the evidence for this is scant, to say the least.
And now, it just got scanter. (We know the word is “scantier” but the one we concocted rhymes with our pugilistic friend in climate hyperbole, Ben Santer).
A just-published paper in the Journal of Geophysical Research authored by a team of leading hurricane researchers has once again examined the historical record of tropical storm observations from the Atlantic Ocean this time focusing on the number of tropical storms whose entire lifetime was less than two days. The authors’ termed these very minor storms “shorties.” The identification of shorties is one element of the tropical cyclone record that could be very impacted by changing observational methodologies and technologies. Short-duration storms are presently identified much more readily than they were, say, prior to the satellite era.
If the Atlantic tropical cyclone history is divided up into “shorties” and, we guess, “longies,” something very interesting pops out. Over the entire record, there is a big upward trend in the number of “shorties” but there is no trend in the annual number of “longies” (Figure 1).

Figure 1. Time series (enlarged) of the number of North Atlantic tropical storms lasting (top) 2 days or less (shorties) and (bottom) more than 2 days (longies) (from Villarini et al., 2011).
Obviously, lumping the two together would produce an apparent upward trend in the total annual number of tropical storms and hurricanes - and give fuel for the fire which burns for those trying to develop a link to anthropogenic global warming.
This situation is akin to the observed record of tornadoes in the U.S. - the number of weak tornadoes has increased markedly in the last half century, while the number of strong tornadoes shows no such behavior. For tornadoes, this is because better observing technologies (and a lot more people looking) have increasingly identified small storms which were previously overlooked. But the big storms cause such damage that they can’t go unnoticed. The positive trend in total annual number of tornadoes is driven not by climate change (as some would have you believe), but instead by changing observational methods.
The authors of the current study, Gabriele Villarini, Gabriel Vecchi, Thomas Knutson, and James Smith, wanted to more closely examine the record of shorties to see if they could determine the reasons behind the large upward trend in the number of shorties.
They did this through combining statistical methods together with their understanding of the physical processes involved in tropical storm formation in the Atlantic basin (a topic that the authors are well versed in).
What they found was a lack of evidence for a detectable climate change signal in the century-long record of shorties. Instead, they concluded that non-climatic signals (i.e. data quality issues) were contaminating the record and making it impossible to isolate a climate signal from the raw data, if such a signal even existed at all (a possibility which the authors think as unlikely, at least as far as there being a significant positive trend over the 20th century).
What’s more, the authors warn that all approaches to identifying a secular trend in Atlantic tropical cyclone counts which do not explicitly account for the non-climatic influences of shorties are likely to be in error, as are statistical models of Atlantic tropical cyclone activity that include shorties in their datasets. We add that there are quite a few published studies that do just what Villarini et al. have warned against.
Here is how Villarini et al. conclude their paper:
[B]ased on our results, it appears that the long-term record of the basin-wide shorties is sufficiently contaminated by spurious components to mask any climatically induced variation within the raw data. Moreover, based on these results and those of Vecchi and Knutson [2008] it is unlikely that a homogeneous record of Atlantic tropical storm counts would contain a statistically significant positive trend since the late 1800s. Our results provide a context for interpreting studies exploring trend behavior in the North Atlantic tropical storm activity starting prior to the 1940s. In particular, the conclusions of certain studies reporting large secular increases in North Atlantic tropical storm activity in which shorties are included [e.g., Holland and Webster, 2007; Mann et al., 2007] could be affected by what we interpret as likely spurious nonphysical trends unless an alternative physical explanation can be uncovered for the pronounced increase in shorties starting from the middle of the 20th century. Further, statistical models of tropical storm activity built using century‐scale records that include shorties [e.g., Mann et al., 2007; Sabbatelli and Mann, 2007; Mann et al., 2009] likely include an element reflecting the spurious shorties in the record.
[Yes, there are more references to Michael Mann here than you might find in a UVa FOIA! - eds.]
Villarini et al.’s findings will require a reassessment of the existing assessments concerning the long-term temporal behavior of Atlantic tropical cyclones and their potential linkages to anthropogenic climate change.
Reference:
Reference: Villarini, G., et al., 2011. Is the recorded increase in short-duration North Atlantic tropical storms spurious? Journal of Geophysical Research, 116, D10114, doi:10.1029/2010JD015493.
By Joanne Nova
After I wrote Wasting money on climate change betrays sick in The Weekend Australian, Fiona Armstrong of the Climate and Health Alliance replied with Climate action has clear public health dividend. Here’s why she’s missing the main point (saving lives)’
Fiona Armstrong claims that there are substantial health gains possible from climate action, and waved the banner of scientific integrity and “fact”. Unfortunately for Armstrong, the mortal facts from countries all over the world show that more people die in colder weather. Any statistic that suggests climate change is killing people only survives as long as we ignore the number of people saved.
Medical studies rarely show such unanimity. The results stand whether you look at seasonal or daily temperatures, extremes or averages, cold locations versus warm ones, or the trend in flood deaths and droughts. No matter where you live, whether you ail in your heart, or your lungs: You’re less likely to die in warmer weather.
If we could control the planet’s thermostat, medical groups would surely suggest we ought warm things up.
Armstrong cites a NGO report that guesstimates 300,000 people die each year of climate change, but she doesn’t mention that most of those unnamed people were not struck down by floods, droughts, fires or heatstroke. Instead 95% of them were killed by starvation, diarrhoea or malaria, and a certain percentage of the global death tally in each condition was arbitrarily filed under “climate change”. Curiously in 2003 the death toll was “calculated” as 150,000 assumed deaths, but by 2009 the assigned percentages were recalculated to get 300,000 deaths pa with a tap of the keyboard. Prof Roger Pielke Jnr summed up the 2009 report as “a methodological embarrassment and poster child for how to lie with statistics”.
First do no harm?
Speaking of starvation, while nearly half a million people die from a lack of food each year, some 6.5% of the world’s grains, and 8% of the vegetable oils are now fed to cars instead of people. Arguably action against climate change is a net killer, and we’d save people by doing nothing at all to stop carbon dioxide emissions.
The big perspective
Clearly, if we want to save lives, medical research on our vascular system would save more people than buying solar panels in Sydney and hoping they’ll protect people in Cairns from nasty storms.
If Armstrong and the Climate and Health Action (CAHA) were more concerned about health rather than climate, they would know that the largest killer around the world is cardiovascular disease, which is responsible for some 17 million deaths every year. That’s nearly 30% of all deaths, and 500 times larger than the number who die from extreme weather events (which cause about 0.06%). Clearly, if we want to save lives, medical research on our vascular system would save more people than buying solar panels in Sydney and hoping they’ll protect people in Cairns from nasty storms.
The statistics on cardiovascular disease make it clear that cold weather is deadly. In Russia, ischemic stroke is 32% more likely on colder days; in Norway, cardiovascular deaths are 15% higher in winter months; in Israel, cardiovascular deaths were 50% higher in winter, even though Israeli winters are not exactly cold. Likewise in California heart disease mortality in 220,000 deaths was 33% higher in winter. A study in Brazil found that deaths were 2.6% more likely for every degree the temperature fell below 20C. Need I go on?
Respiratory diseases kill one hundreds times as many people as extreme weather events, and are not called “colds” for nothing. A Norwegian study found that respiratory deaths were fully 47% more likely in winter. There were 5 major population contractions in China in the last 1000 years and all of them occurred in periods with a cold climate.
What about all the disasters this summer?
When it comes to droughts and floods, the news is bad for the Climate Commission but good for the human race. A report published in the American Journal of Physicians and Surgeons by Indur Goklany in 2009 (so not including the last summer) points out that deaths due to droughts peaked in the 1920s and have since declined by a whopping 99%. Likewise, deaths due to floods peaked in the 1930s and have fallen by 98%. The rate per capita figures are even more impressive. Eighty percent of man made emissions of CO2 have been produced since 1940, and deaths from floods and droughts is lower than ever.
And when it comes to Malaria, the IPCC assumes that it will be worse as the world warms, but history tells us otherwise. One of the largest malaria outbreaks was in Siberia early last century, and then there is that awkward point that malaria deaths in England, of all places, were more common, during - by crickey - the little ice age 300 years ago. Paul Reiter reminds us that the entire area under the British Parliamentary Houses was once a notorious malarial swamp.
Possibly the most disturbing aspect of cold related deaths is not just that they kill so many more people than heat related deaths, but that they increase deaths for up to a month after the cold spell. When a heatwave strikes, the death rate increases, but then it’s often followed by lower death rates. Researchers surmise that while cold weather weakens otherwise healthy people, heat waves speed up the deaths of people who were close to dying anyway.
Atmospheric CO2 is handy for growing crops, in the same sense that breathing is handy for your health. In order to feed billions of people without destroying more forests to create farmland, there is no better yield multiplier than CO2. Indeed it’s so good, it is pumped into commercial greenhouses to enhance yields.
It’s like a form of pagan witchcraft to pretend that adding windfarms is the best way to reduce malaria.
And while Armstrong points out that the coal industry has health issues, she forgets that windfarms have their own depressing toll. (Even installing pink batts can be deadly!) Coal provides 80% of our electricity. Sure we can give it up, but every alternative costs at least twice as much. Coal mining is dangerous, but the obvious answer is to make mining safer, not to slap on a carbon tax.
Likewise if we are concerned about deaths (and who isn’t?) the answer is to research the causes and look for cures. It’s like a form of pagan witchcraft to pretend that adding windfarms is the best way to reduce malaria.
The Climate and Health Alliance is clearly not that interested in health per se. They’ve declared their top priority and don’t even bother to disguise their real aim: “1/ Health: Advocate for a strong emissions reduction scheme...”. A health advocacy group would surely list “longer lives” or “less disease”, but not CAHA. They judge their success not by whether they save anyone, but by whether they get legislation about a trace gas passed. CAHA is just another climate propaganda group.
By Marlowe Hood
The pace at which humans are driving animal and plant species toward extinction through habitat destruction is at least twice as slow as previously thought, according to a study released Wednesday.
Earth’s biodiversity continues to dwindle due to deforestation, climate change, over-exploitation and chemical runoff into rivers and oceans, said the study, published in Nature.
“The evidence is in—humans really are causing extreme extinction rates,” said co-author Stephen Hubbell, a professor of ecology and evolutionary biology at the University of California at Los Angeles.
But key measures of species loss in the 2005 UN Millennium Ecosystem Assessment and the 2007 Intergovernmental Panel on Climate Change (IPCC) report are based on “fundamentally flawed” methods that exaggerate the threat of extinction, the researchers said.
The International Union for the Conservation of Nature (IUCN) “Red List” of endangered species—likewise a benchmark for policy makers—is now also subject to review, they said.
“Based on a mathematical proof and empirical data, we show that previous estimates should be divided roughly by 2.5,” Hubbell told journalists by phone. This is welcome news in that we have bought a little time for saving species. But it is unwelcome news because we have to redo a whole lot of research that was done incorrectly.”
Up to now, scientists have asserted that species are currently dying out at 100 to 1,000 times the so-called “background rate,” the average pace of extinctions over the history of life on Earth.
UN reports have predicted these rates will accelerate tenfold in the coming centuries.
The new study challenges these estimates. “The method has got to be revised. It is not right,” said Hubbell.
How did science get it wrong for so long?
Because it is difficult to directly measure extinction rates, scientists used an indirect approach called a “species-area relationship.”
This method starts with the number of species found in a given area and then estimates how that number grows as the area expands.
To figure out how many species will remain when the amount of land decreases due to habitat loss, researchers simply reversed the calculations.
But the study, co-authored by Fangliang He of Sun Yat-sen University in Guangzhou, shows that the area required to remove the entire population is always larger—usually much larger—than the area needed to make contact with a species for the first time.
“You can’t just turn it around to calculate how many species should be left when the area is reduced,” said Hubbell.
That, however, is precisely what scientists have done for nearly three decades, giving rise to a glaring discrepancy between what models predicted and what was observed on the ground or in the sea.
Dire forecasts in the early 1980s said that as many as half of species on Earth would disappear by 2000. “Obviously that didn’t happen,” Hubbell said.
But rather than question the methods, scientists developed a concept called “extinction debt” to explain the gap.
Species in decline, according to this logic, are doomed to disappear even if it takes decades or longer for the last individuals to die out.
But extinction debt, it turns out, almost certainly does not exist.
“It is kind of shocking” that no one spotted the error earlier, said Hubbell. “What this shows is that many scientists can be led away from the right answer by thinking about the problem in the wrong way.”
Human encroachment is the main driver of species extinction. Only 20 percent of forests are still in a wild state, and nearly 40 percent of the planet’s ice-free land is now given over to agriculture. Some three-quarters of all species are thought to live in rain forests, which are disappearing at the rate of about half-a-percent per year.
Physics arXiv Blog
Geologists have long puzzled over anecdotal reports of strange atmospheric phenomena in the days before big earthquakes. But good data to back up these stories has been hard to come by.
In recent years, however, various teams have set up atmospheric monitoring stations in earthquake zones and a number of satellites are capable of sending back data about the state of the upper atmosphere and the ionosphere during an earthquake.
Last year, we looked at some fascinating data from the DEMETER spacecraft showing a significant increase in ultra-low frequency radio signals before the magnitude 7 Haiti earthquake in January 2010

Enlarged.
Today, Dimitar Ouzounov at the NASA Goddard Space Flight Centre in Maryland and a few buddies present the data from the Great Tohoku earthquake which devastated Japan on 11 March. Their results, although preliminary, are eye-opening.
They say that before the M9 earthquake, the total electron content of the ionosphere increased dramatically over the epicentre, reaching a maximum three days before the quake struck.
At the same time, satellite observations showed a big increase in infrared emissions from above the epicentre, which peaked in the hours before the quake. In other words, the atmosphere was heating up.
These kinds of observations are consistent with an idea called the Lithosphere-Atmosphere-Ionosphere Coupling mechanism. The thinking is that in the days before an earthquake, the great stresses in a fault as it is about to give cause the releases large amounts of radon.
The radioactivity from this gas ionises the air on a large scale and this has a number of knock on effects. Since water molecules are attracted to ions in the air, ionisation triggers the large scale condensation of water.
But the process of condensation also releases heat and it is this that causes infrared emissions. “Our first results show that on March 8th a rapid increase of emitted infrared radiation was observed from the satellite data,” say Ouzounov and co.
These emissions go on to effect the ionosphere and its total electron content.
It certainly makes sense that the lithosphere, atmosphere and ionosphere are coupled in a way that can be measured when one of them is perturbed. The question is to what extent the new evidence backs up this idea.
The Japan earthquake is the largest to have struck the island in modern times and will certainly turn out to be among the best studied. If good evidence of this relationship doesn’t emerge from this data, other opportunities will be few and far between.
Ref: arxiv.org/abs/1105.2841: Atmosphere-Ionosphere Response to the M9 Tohoku Earthquake Revealed by Joined Satellite and Ground Observations. Preliminary Results.
By James Delingpole
How the IPCC’s predictions are increasingly at odds with reality (see note below)

Following yesterday’s story about David Cameron’s depressing plans to bomb the UK economy back to the dark ages and wipe out the British countryside, here’s a wistful reminder of how things might have been if only we weren’t run by imbeciles.
It’s a briefing paper called The Really Inconvenient Truth - or It Ain’t Necessarily So produced for the Global Warming Policy Foundation by Lord Turnbull, the former Cabinet Secretary and head of the Home Civil Service (2002 to 2005). His arguments against unilateral action by Britain to “combat Climate Change” are clear and powerful. In a nutshell, he says: “Don’t let the deeply untrustworthy IPCC decide the fate of the UK economy.”
Lord Turnbull doesn’t mince his words:
The feed-in tariff mechanism is fast becoming a scandal. Those lucky enough to own buildings large enough on which to install solar panels or enough land for a wind farm have been receiving 30-40p per kwh, for electricity, which is retailed at only 11p. The loss is paid for by a levy on businesses and households. It is astonishing that the Liberals who attach such importance to fairness turn a blind eye to this transfer from poor to rich running to billion pounds a year. If you live in a council tower block in Lambeth you don’t have much opportunity to get your nose into this trough.
and:
It is regrettable that the UK Parliament has proved so trusting and uncritical of the IPCC narrative, and so reluctant to question the economic costs being imposed in pursuit of decarbonisation. It verges on the unconstitutional that the payments being made under the renewables obligation and feed-in tariffs and the levies being raised to pay for them are routed invisibly through the accounts of the electricity industry rather than being voted in Estimates or the Finance Bill. I am also disappointed that so many of my former colleagues in the Civil Service seem so ready to go along unquestioningly with the consensus.”
You can read the report in full here.
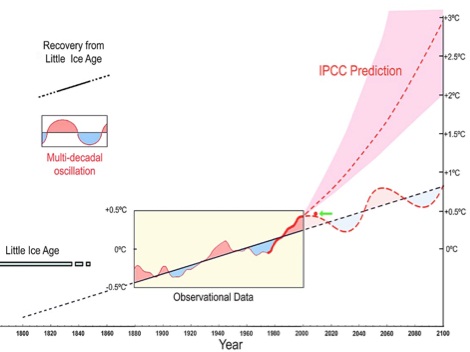
The graph, as explained in the Turnbull report:
The figure shows that the linear trend between 1880 and 2000 is a continuation of the recovery from the Little Ice Age (LIA) together with the superposed multi-decadal oscillation. It is assumed that the recovery from the LIA would continue to 2100, together with the superposed multi-decadal oscillation. This view could explain the halting of the warming after 2000. The observed temperature in 2008 is shown by a red dot with a green arrow. It also shows the temperature rise after 2000 predicted by the IPCC. It has been suggested by the IPCC that the thick red line portion was caused mostly by the greenhouse effect, so the IPCC’s future prediction is a sort of extension of the red line. For detail, see Syun-Ichi Akasofu: On the recovery from the Little Ice Age. Natural Science, 2:11 (2010)
ATI
Listen to Chris Horner radio interview on this issue here.
FOR IMMEDIATE RELEASE
Monday, May 16, 2011
Contacts:
Christopher Horner, chris.horner@atinstitute.org
Paul Chesser, paul.chesser@atinstitute.org
Today the American Tradition Institute’s Environmental Law Center and Virginia Delegate Robert Marshall asked a Prince William County judge, under the Commonwealth’s Freedom of Information Act, to expedite the release of documents withheld by the University of Virginia that pertain to the work of its former environmental sciences assistant professor Dr. Michael Mann.
The legal action follows a delay by UVA of more than four months since ATI and Del. Marshall made their original request on Jan. 6. Since then UVA officials have demanded an unjustified and unsupportable sum of $8,500 from ATI to produce the documents, despite its admission that it knows precisely where the records exist on a specific University computer server. Still, ATI made a down payment of $2,000 for UVA to begin its search and delivery of Mann’s records - and also a second payment, for a total paid of $4,000.00 - but University officials still have not provided any documents, nor offered a schedule of its intentions to respond to ATI’s information request.
“More than one month ago, on April 6, 2011, the University informed us in writing that it expected to begin producing responsive records ‘shortly,’” said Christopher Horner, the senior director of litigation for ATI’s Environmental Law Center. “Then came a pressure campaign in which groups including People for the American Way and ACLU sought political intervention in the process. On May 2, 2011, UVA promised they would send some documents three days later. As of May 13, 2011, ATI had not received a single document under their request.”
The emails and other documents ATI seeks relate to claims made by Dr. Mann to obtain, and claim payment under, certain taxpayer-funded grants. Mann, currently at Pennsylvania State University, worked at the UVA’s Department of Environmental Sciences when he produced what was hailed at the time as the ‘smoking gun’ affirming the theory of catastrophic man-made global warming, and the policy agenda demanded by its proponents. After a persistent cloud of controversy - much of which was affirmed by the “ClimateGate” leak of 2009 - this notorious ‘Hockey Stick’ graph disappeared from the UN’s Intergovernmental Panel on Climate Change (IPCC) Assessment Reports, the perch that launched it.
UVA, with approximately $500,000 in support from private donors, has resisted an earlier records request under a Civil Investigative Demand by Virginia Attorney General Kenneth Cuccinelli, which he initiated pursuant to the Commonwealth’s Fraud Against Taxpayers Act (FATA). That case is now before the state Supreme Court. Press reports indicate the University decided not to cooperate after a similar pressure campaign was launched, also seeking to bar the taxpayer (or law enforcement) from seeing records the taxpayer underwrote.
ATI has requested the same records under Virginia’s FOIA law. UVA has informed ATI it might withhold many of the records sought by ATI under a “proprietary research” exclusion in the law. However, that exemption only applies to research that “has not been publicly released, published, copyrighted or patented” and is otherwise of actual value to UVA. Clearly that exception does not apply to Dr. Mann’s emails a la ClimateGate, sought in ATI’s request, or to his research records given the work in question has been in the public domain for over a decade, was published in academic journals Nature and Geophysical Research Letters, by the IPCC, and elsewhere. Meanwhile the source records for his research have been buried on a back-up computer for many years, inaccessible to anyone.
“The University has been uneven in its response to information requests,” said Dr. David Schnare, director of ATI’s Environmental Law Center. “In this case, they wish to hide behind their ivy covered walls. Our petition to the court will be the first step in looking behind the façade. There will likely be more to come.”
See ATI Environmental Law Center’s Petition for Relief in court in its Freedom of Information Act case against the University of Virginia (PDF).
For an interview with American Tradition Institute senior director of litigation Christopher Horner, email chris.horner@atinstitute.org or call (202)670-2680