

By Paul Chesser
Progress Energy CEO Bill Johnson, whose company will (pending approval) be swallowed by larger electric utility Duke Energy, has been making the media rounds. He has discussed the planned merger, which he says is necessary because of looming capital projects that will be needed to meet electricity demand, but he also warned regulators in Washington of the dangers posed by the heightened government regulatory environment:
“Call this regulatory picture what you will - “a train wreck” ... “a tsunami” ... or an overdue change that’s ultimately do-able,” Johnson said. “It’s not hard to imagine the customer pushback that will occur because of the resulting increase in the price of electricity. This pushback will come from industrial customers struggling to be competitive, and from residential customers and small businesses struggling to make ends meet. As indicated, I’m especially sensitive to the households of modest means, where energy represents a disproportionately large share of disposable income.”
This is what many groups who represent low-income, minority, small businesses and senior citizens have been saying for years. What is ironic is that Progress would form its partnership with Duke, which as a member of the U.S. Climate Action Partnership has lobbied for policies (especially cap-and-trade) that dramatically increase those regulations that Johnson criticizes. Duke’s Jim Rogers is known as one of the top rent-seeking CEOs in the country (perhaps second only to Government Electric’s Jeffrey Immelt).
Specifically Johnson spoke of his concern over a “daunting convergence of new federal rules and aggressive deadlines coming at us on multiple fronts” - pending changes on air, water and land rules under the Environmental Protection Agency (EPA), changing rules on nuclear safety from the Nuclear Regulatory Commission (NRC) and the new grid reliability rules from the North American Electric Reliability Corporation (NERC). Also from his remarks:
What’s worrisome is the insufficient attention to the cumulative effects on utilities and our customers. I’m not suggesting we face a doomsday scenario, but I do believe the current fragmented approach, coupled with rapid-compliance deadlines, is a recipe for inefficiency, system reliability challenges and unnecessarily high cost.
Johnson pointed out a study by the Edison Electrical Institute which reported, among other things, that utilities will be forced to retire up to one-fourth of coal-fired power plants earlier than planned; that those plants are heavily concentrated in the Southeast, Midwest and Mid-Atlantic states, where the cost impacts will be felt more strongly; and the incremental capital expenditures due to the requirements could reach $247 billion by 2020.
“These costs are real,” Johnson told the regulators, “and whether through rate cases or energy markets, they ultimately will be borne by utility customers - homes, churches, schools, small businesses and large industries.”
Answering the charge that utilities have always been able to meet past environmental regulations, Johnson added:
According to this argument, the industry is overstating the challenge - “crying wolf.” But the last significant wave of new environmental rules was driven by the Clean Air Act Amendments of 1990. And, in that case, the industry had a decade to identify and implement the most cost-effective solutions.
This new wave of EPA rules is on a much broader front - SO2, NOx, mercury, coal ash, water, greenhouse gases - and a much faster track. We’re being required to execute much more change in a much smaller window of time.
The bottom line is the coming effect on our electric bills will be painful, all in pursuit of a dubious-at-best global warming problem. And now Johnson is marrying one of the practitioners of alarmism, as he complains about his new spouse’s habits.
Paul Chesser is an associate fellow for the National Legal and Policy Center and is executive director for the American Tradition Institute.
By Anthony Watts and WUWT reader Steve Rosser
The Central England Temperature Record has been getting some inconvenient attention as of late. Joe D’Aleo at ICECAP pointed out recently:
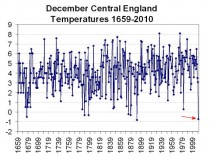
The Central England Temperature record is one of the longest continuous temperature record in the world extending back to the Little Ice age in 1659. December 2010 was the coldest December in 120 years with an average of -0.7C just short of the record of -0.8C recorded in December 1890 and the Second Coldest December Temperature in the entire record (352 years).
I don’t know if it is simply sloppy webkeeping or related to the fact that the CET isn’t cooperating with the AGW expectations, but the Met Office seems to be burying the data from easy public access. They haven’t eliminated it, but it is now harder to find, and what was once a direct link now points to a general purpose climate change page.
WUWT reader Steve Rosser writes:
...the UK Met Office website, it’s undergoing a refresh at the moment and the CET link seems to have been mysteriously cut. It used to be readily accessible via the UK Climate summaries page, see below, however this link now redirects you to a global temperature page instead.
Thinking it may be a genuine mistake I e-mailed an enquiry and received a very polite response redirecting me to find it via the obscure link. It’s hard to argue that this location provides a sufficiently high profile for such an august dataset.
It may be that the original link will reinstated over the next few days in which case this is a non story. However, it looks suspicously like they are taking the focus away from the CET as after 2010 it’s showing an embarrasing disinclination to follow the AGW orthodoxy (+0.4 deg C since 1780). To do so would be a betrayal of their lack of impartiality which I’d personally find very disappointing. It would also send a message that rather than face-up and make the case for 2010 being a rogue year for UK temperatures they’d rather brush the whole thing under the carpet. I hope I’m wrong.
Read more here.
Another great catch by Hockey Schtick
A new peer-reviewed paper published in the journal Atmospheric Chemistry and Physics finds that measurements of solar irradiance at ground level at the South Pole show variations of up to 24 times more than would be expected over the course of a solar cycle. While satellite measurements find that total solar irradiance only varies 0.1% from a solar minimum to solar maximum, the ground-level measurements analyzed by the authors show a change of 1.8 plus/minus 1.0% in the UV-A (320-400 nm) spectrum and 2.4 plus/minus 1.9% in the visible (400 - 600 nm) spectrum over the course of a solar cycle.
Regressions based on all 17 solstice periods indicate approximate 1.8% and 2.4% decreases in ground-level irradiance for the wavelength regions 320 - 400 nm and 400 - 600 nm, respectively, from solar maximum to solar minimum. The associated uncertainty ranges are approximately 0.8 -2.7% for the UV-A and 0.5% - 4.3% for the visible.
Changes in extraterrestrial irradiance over the solar cycle surely contribute a portion of the variability deduced at the polar surface for the 320-400 nm region, although the magnitude of this contribution is uncertain. However, the inferred solar cycle dependence in the 400-600 nm visible band is too large to be of extraterrestrial origin unless one adopts values at the lowest end of the error range.
The UV-A and visible portions are the most energetic and significant portions of the solar spectrum heating the Earth. While the authors are uncertain of the origin of this variability at the surface, they note that it is “too large to be of extraterrestrial origin.” Climate models assume that the solar irradiance reaching the Earth’s surface only varies 0.1% over solar cycles in accordance with satellite measurements, but as shown by this paper, that may be an incorrect assumption. Another recent study has shown that solar UV activity has increased almost 50% over the past 400 years. The antiquated assumption in climate science that the effect of the Sun upon the Earth’s climate is a constant (they even call it “the solar constant") is in dire need of reassessment. The IPCC, however, is only mandated to assess anthropogenic climate change and only pays lip service to the role of the Sun.
Full paperAtmos. Chem. Phys., 11, 1177-1189, 2011 www.atmos-chem-phys.net/11/1177/2011/ doi:10.5194/acp-11-1177-2011
Solar irradiance at the earth’s surface: long-term behavior observed at the South Pole
J. E. Frederick and A. L. Hodge
Department of the Geophysical Sciences, University of Chicago, Chicago, Illinois, USA
Abstract. This research examines a 17-year database of UV-A (320-400 nm) and visible (400-600 nm) solar irradiance obtained by a scanning spectroradiometer located at the South Pole. The goal is to define the variability in solar irradiance reaching the polar surface, with emphasis on the influence of cloudiness and on identifying systematic trends and possible links to the solar cycle. To eliminate changes associated with the varying solar elevation, the analysis focuses on data averaged over 30–35 day periods centered on each year’s austral summer solstice. The long-term average effect of South Polar clouds is a small attenuation, with the mean measured irradiances being about 5-6% less than the clear-sky values, although at any specific time clouds may reduce or enhance the signal that reaches the sensor. The instantaneous fractional attenuation or enhancement is wavelength dependent, where the percent deviation from the clear-sky irradiance at 400-600 nm is typically 2.5 times that at 320-340 nm. When averaged over the period near each year’s summer solstice, significant correlations appear between irradiances at all wavelengths and the solar cycle as measured by the 10.7 cm solar radio flux. An approximate 1.8 plus/minus 1.0% decrease in ground-level irradiance occurs from solar maximum to solar minimum for the wavelength band 320-400 nm. The corresponding decrease for 400-600 nm is 2.4 plus/minus 1.9%. The best-estimate declines appear too large to originate in the sun. If the correlations have a geophysical origin, they suggest a small variation in atmospheric attenuation with the solar cycle over the period of observation, with the greatest attenuation occurring at solar minimum.
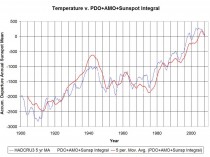
Related: A very simple climate model incorporating only “sunspot integral” and ocean oscillations has a correlation factor of .96 to global temperature, as compared to a correlation factor of .44 for CO2
Hockey Schtick
Largest US food distributor declares force majeure on fresh fruit and vegetables due to “devastating” freeze of “unprecedented magnitude”
Sysco, the largest wholesale food distributor in the US and primary supplier to most supermarket chains, has declared force majeure (the “act of God” clause) that allows suspension of contracted prices and supply of fresh fruit and vegetables due to the “unprecedented magnitude” of “devastating” and “extreme freezing temperatures” in a “very broad section of major growing regions in Mexico.”
Sysco also reports “Florida is normally a major supplier for these items as well, but they have already been struck with severe freeze damage in December and January and up until now have had to purchase product out of Mexico to fill their commitments, that is no longer an option.”
Release from Sysco to supermarket buyers (bold added):
ALL OF OUR GROWERS HAVE INVOKED THE ACT OF GOD CLAUSE ON OUR CONTRACTS DUE TO THE FOLLOWING RELEASE. WE WILL BE CONTACTING YOU PERSONALLY TO REVIEW HOW THIS WILL AFFECT OUR CONTRACTED ITEMS WITH YOU GOING FORWARD.
THE DEVASTATING FREEZE IN MEXICO IS WORST FREEZE IN OVER 50 YEARS…
THE EXTREME FREEZING TEMPERATURES HIT A VERY BROAD SECTION OF MAJOR GROWING REGIONS IN MEXICO, FROM HERMOSILLO IN THE NORTH ALL THE WAY SOUTH TO LOS MOCHIS AND EVEN SOUTH OF CULIACAN. THE EARLY REPORTS ARE STILL COMING IN BUT MOST ARE SHOWING LOSSES OF CROPS IN THE RANGE OF 80 TO 100%. EVEN SHADE HOUSE PRODUCT WAS HIT BY THE EXTREMELY COLD TEMPS. IT WILL TAKE 7-10 DAYS TO HAVE A CLEARER PICTURE FROM GROWERS AND FIELD SUPERVISORS, BUT THESE GROWING REGIONS HAVEN’T HAD COLD LIKE THIS IN OVER A HALF CENTURY. THIS TIME OF YEAR, MEXICO SUPPLIES A SIGNIFICANT PERCENT OF NORTH AMERICA’S ROW CROP VEGETABLES SUCH AS: GREEN BEANS, EGGPLANT, CUCUMBERS, SQUASH, PEPPERS, ASPARAGUS, AND ROUND AND ROMA TOMATOES. FLORIDA NORMALLY IS A MAJOR SUPPLIER FOR THESE ITEMS AS WELL BUT THEY HAVE ALREADY BEEN STRUCK WITH SEVERE FREEZE DAMAGE IN DECEMBER AND JANUARY AND UP UNTIL NOW HAVE HAD TO PURCHASE PRODUCT OUT OF MEXICO TO FILL THEIR COMMITMENTS, THAT IS NO LONGER AND OPTION.
WITH THE SERIES OF WEATHER DISASTERS THAT HAS OCCURRED IN BOTH OF THESE MAJOR GROWING AREAS WE WILL EXPERIENCE IMMEDIATE VOLATILE PRICES, EXPECTED LIMITED AVAILABLITITY, AND MEDIOCRE QUALITY AT BEST. THIS WILL NOT ONLY HAVE AN IMMEDIATE IMPACT ON SUPPLIES, BUT BECAUSE OF VERY STRONG BLOSSOM DROPS, THIS WILL ALSO IMPACT SUPPLIES 30 – 60 DAYS FROM NOW. SOME GROWERS ARE MEETING WITH THEIR BOARDS RIGHT NOW TO DETERMINE WHETHER THEY SHOULD IMMEDIATELY RE-PLANT, HOPING FOR A HARVEST BY LATE-MARCH-TO- EARLY-APRIL, OR WHETHER THEY SHOULD DISC THE FIELDS UNDER AND WAIT FOR ANOTHER SEASON.
We are doing everything we can with our growers to minimize the effect of this disaster on you. With the unprecedented magnitude of this event we wanted to immediately make you aware of the conditions. We will continue to send out communications as our people on the ground report back to us. We thank you and we appreciate your understanding during this time.
Sherman, D.J., Li, B., Quiring, S.M. and Farrell, E.J. 2010. Benchmarking the war against global warming. Annals of the Association of American Geographers 100: 1013-1024.
The four academics from Texas A & M University’s Department of Geography who authored this study began by using the HadCRUT3 reconstruction of the instrumental global temperature record for the period 1850 through 2008, in order to derive the rate of global atmospheric temperature change over the last 30 years—which they refer to as the earth’s thermal “baseline condition”—after which they derived “empirical estimates of annual variability (noise) for every 30-year trend (signal) of that record.” And then, after selecting seven model-based temperature trend simulations through the end of the 21st century, which had been produced for different anthropogenic CO2 emission scenarios by different research groups using different climate models, they finally estimated “how long it might be before those trends become statistically distinct from the current trend.”
In performing these operations, Sherman et al. (2010) determined that “it will probably be decades before distinct changes from the current [30-year baseline] warming rate become apparent,” and they stated, therefore, that “we should expect decades to pass before impacts of the war against global warming become apparent.”
So what are the implications they derive from this result? First of all, as they say in one place, the war against global warming “will require a sustained commitment to stringent climate control policies for periods of decades or longer.” And as they say in another place, that war “will require unprecedented social, political, and economic commitments.”
Think about these statements. Without obtaining any empirical evidence—over a period of decades or longer—that the planet is even inching towards the catastrophic climatic future the world’s climate alarmists are predicting, we will be asked to endorse—or, perhaps more accurately, ordered to obey—a host of rules and regulations that pertain to a number of unprecedented “social, political, and economic” commitments, which will be imposed on the planet’s global population, but with an emphasis placed upon those people living in countries with the economic and technical capacity to produce and use greater amounts of fossil fuel-derived energy.
Yes, the world’s climate alarmists desire all mankind to place blind faith in the predictions of their climate models, and to do so for generations to come, and without any empirical evidence for the validity of their predictions, forcing us to adhere to liberty-destroying edicts, without any means of ever calling them into question.
Does that sound wise to you?
By Anne Jolis, The Wall Street Journal
Global-warming alarmists insist that economic activity is the problem, when the available evidence show it to be part of the solution. We may not be able to do anything about the weather, extreme or otherwise. But we can make sure we have the resources to deal with it when it comes.
Last week a severe storm froze Dallas under a sheet of ice, just in time to disrupt the plans of the tens of thousands of (American) football fans descending on the city for the Super Bowl. On the other side of the globe, Cyclone Yasi slammed northeastern Australia, destroying homes and crops and displacing hundreds of thousands of people.
Some climate alarmists would have us believe that these storms are yet another baleful consequence of man-made CO2 emissions. In addition to the latest weather events, they also point to recent cyclones in Burma, last winter’s fatal chills in Nepal and Bangladesh, December’s blizzards in Britain, and every other drought, typhoon and unseasonable heat wave around the world.
But is it true? To answer that question, you need to understand whether recent weather trends are extreme by historical standards. The Twentieth Century Reanalysis Project is the latest attempt to find out, using super-computers to generate a dataset of global atmospheric circulation from 1871 to the present.
As it happens, the project’s initial findings, published last month, show no evidence of an intensifying weather trend. “In the climate models, the extremes get more extreme as we move into a doubled CO2 world in 100 years,” atmospheric scientist Gilbert Compo, one of the researchers on the project, tells me from his office at the University of Colorado, Boulder. “So we were surprised that none of the three major indices of climate variability that we used show a trend of increased circulation going back to 1871.”
In other words, researchers have yet to find evidence of more-extreme weather patterns over the period, contrary to what the models predict. “There’s no data-driven answer yet to the question of how human activity has affected extreme weather,” adds Roger Pielke Jr., another University of Colorado climate researcher.
Some climate alarmists claim that cyclones, such as Cyclone Yasi, are a result of man-made CO2 emissions.
We do know that carbon dioxide and other gases trap and re-radiate heat. We also know that humans have emitted ever-more of these gases since the Industrial Revolution. What we don’t know is exactly how sensitive the climate is to increases in these gases versus other possible factors-solar variability, oceanic currents, Pacific heating and cooling cycles, planets’ gravitational and magnetic oscillations, and so on.
Given the unknowns, it’s possible that even if we spend trillions of dollars, and forgo trillions more in future economic growth, to cut carbon emissions to pre-industrial levels, the climate will continue to change - as it always has.
That’s not to say we’re helpless. There is at least one climate lesson that we can draw from the recent weather: Whatever happens, prosperity and preparedness help. North Texas’s ice storm wreaked havoc and left hundreds of football fans stranded, cold, and angry. But thanks to modern infrastructure, 21st century health care, and stockpiles of magnesium chloride and snow plows, the storm caused no reported deaths and Dallas managed to host the big game on Sunday.
Compare that outcome to the 55 people who reportedly died of pneumonia, respiratory problems and other cold-related illnesses in Bangladesh and Nepal when temperatures dropped to just above freezing last winter. Even rich countries can be caught off guard: Witness the thousands stranded when Heathrow skimped on de-icing supplies and let five inches of snow ground flights for two days before Christmas. Britain’s GDP shrank by 0.5% in the fourth quarter of 2010, for which the Office of National Statistics mostly blames “the bad weather.”
Arguably, global warming was a factor in that case. Or at least the idea of global warming was. The London-based Global Warming Policy Foundation charges that British authorities are so committed to the notion that Britain’s future will be warmer that they have failed to plan for winter storms that have hit the country three years running.
A sliver of the billions that British taxpayers spend on trying to control their climes could have bought them more of the supplies that helped Dallas recover more quickly. And, with a fraction of that sliver of prosperity, more Bangladeshis and Nepalis could have acquired the antibiotics and respirators to survive their cold spell.
A comparison of cyclones Yasi and Nargis tells a similar story: As devastating as Yasi has been, Australia’s infrastructure, medicine, and emergency protocols meant the Category 5 storm has killed only one person so far. Australians are now mulling all the ways they could have better protected their property and economy.
But if they feel like counting their blessings, they need only look to the similar cyclone that hit the Irrawaddy Delta in 2008. Burma’s military regime hadn’t allowed for much of an economy before the cyclone, but Nargis destroyed nearly all the Delta had. Afterwards, the junta blocked foreign aid workers from delivering needed water purification and medical supplies. In the end, Rangoon let Nargis kill more than 130,000 people.
Global-warming alarmists insist that economic activity is the problem, when the available evidence show it to be part of the solution. We may not be able to do anything about the weather, extreme or otherwise. But we can make sure we have the resources to deal with it when it comes.
Miss Jolis is an editorial page writer for The Wall Street Journal Europe.
By Roger Pielke Sr.
Last Fall, Josh Willis of the Jet Propulsion Laboratory at Cal Tech informed us he would provide an update of the upper ocean heat data; see E-mail Exchange With Joshua Willis On The Diagnosis Of Global Warming From Ocean Heat Content Changes
This past week Josh contacted me and has permitted me to post his preliminary analysis along with his e-mail that summarizes the current assessment. He has emphasized that the analysis is preliminary.
The new preliminary analysis is plotted below in the same format as used in
Pielke Sr., R.A., 2008: A broader view of the role of humans in the climate system. Physics Today, 61, Vol. 11, 54-55.
As he wrote in his e-mail, the analysis should not be used in a scientific publication until he reports on a final version.
An Unpublished Update By Josh Willis
This estimate only goes back to 2005. The reason for this is that Argo still has a number of floats for which no PI has responsibility for quality control of the data. For early incarnations of these floats, this could mean that significant (albeit correctable) biases still exist in the pressure data. Normally, these biases are corrected by the PI, but since these floats are sort of homeless, they have not yet been corrected. It is also difficult (or in many cases impossible) for the end user to correct these pressure data themselves. Argo is still trying to figure out how to deal with these data and I sure they will receive bias corrections eventually, but for the moment we need to exclude them. So, for this reason I am still not comfortable with the pre-2005 estimates of heat content.
Anyway, the consequence of this is that we still do not have a good estimate of ocean heat content changes from about 2002 to 2005, when the dominant data source for ocean heat content went from XBTs to Argo floats. For this reason, I remain a bit skeptical of any heat content estimates during that period. That said, however, I do think that longer-term estimates like those of Levitus et al., Domingues et al., and Lyman et al. are robust with respect to the long-term heat content increases. The issue with the 2002-2005 period is that the uncertainty during this period is still much larger than any year-to-year fluctuations that may exist....
My Conclusions
1. First, and most importantly, this data is such an essential climate metric that it should be widely available to everyone in near real time. It is the most robust metric we have to diagnose annual average global warming.
2. The analysis that Josh has provided extends only a relatively small part of the way through 2010. It will be enlightning to see how the recent change to a La Nina pattern effects the ocean heat content.
3. IF the diagnosed radiative forcing of +0.16 Watts per meter squared in the upper ocean plus the 0.07 Watts per meter squared below that level are robust in the final analysis, the total of 0.23 Watts per meter squared is significantly below the 0.6 Watts per meter squared predicted by Jim Hansen from the GISS model for the time period 1993 to 2003 (see).
4. The analysis, however, shows that the climate system (as represented by the oceans) did warm in the annual average since 2005 until mid 2010.
5. The analysis, when ready for the remainder of 2010 and into 2011 will be quite informative. With the onset of the La Nina, the lower atmosphere has cooled rapidly (e.g. see). Whether or not the upper ocean retains its large positive heat anomaly, as clearly evident in Josh’s analysis. will be an important in further testing the GISS and other IPCC model predictions. The deeper ocean heat change on the same time scale will inform us if heat is being transfered downwards and stored at those levels or, if the heat change is small, this will indicate the heat anomaly was radiated into space. Post.
By Michael Graham
Michael Graham has an excellent post in today’s Boston Herald. He takes on the mainstream media crackpots and environmentalists and rent seeking scientists who are changing their description of what global warming means. Here are some excerpts:
Meet the global weirdos. They’re the ones telling you that all the snow outside is proof that it’s getting warmer. Only, they don’t call it “warming” anymore....
Since 1998, temperatures have been relatively flat. We’ve got more polar bears than ever, and Manhattan is buried under snow. For a planet-roasting crisis that threatened the human race with extinction, there doesn’t seem to be much actual warming.
So then the mantra became “climate change.” The liberals formerly known as “warmists” began predicting that we would experience fundamental changes in our weather. Scientists at the University of East Anglia - the Harvard of climate change - said snow would be “a very rare and exciting event.” Children wouldn’t know what it was.
As for summers, in the wake of Katrina “change-ist” groups like realclimate.org predicted “global warming will make hurricanes even worse in the future.”
What happened? Nothing. Europe has had three winters in a row of snow and cold temperatures. In the Atlantic, “there has been a dramatic decrease in the number of hurricanes in the last five years,” according to meteorologist Art Horn. “The total energy in all hurricanes around the world has plunged since 1993. The opposite of what was predicted.”
So the new fall back is “global weirding.”
.......
Global warming - is there anything it can’t do?
Well, the one thing it apparently doesn’t do is help predict the weather. The UK’s Met Office stopped giving seasonal forecasts last year after mis-predicting warmer winters three years in a row. Meteorologists without a warmist agenda like Piers Corbyn and AccuWeather’s Joe Bastardi, on the other hand, continue to pay the bills by making predictions directly contrary to the “weirdos.” Oddly, they don’t have degrees in politics.
For a theory to be scientific, it must be fallible - capable of being proven false. If every weather condition can be used to “prove” global warming simply by being declared “weird,” then it’s not science. It’s a joke.
Which is exactly what the environmental movement has become.