

GWPF Press Release
London, 21 December 2010: The Global Warming Policy Foundation has called on the Government to set up an independent inquiry into the winter advice it received by the Met Office and the renewed failure to prepare the UK for the third severe winter in a row (see here).
“The current winter fiasco is no longer a joke as the economic damage to the British economy as a result of the country’s ill-preparedness is running at 1bn pounds a day and could reach more than 15 billion pounds,” said Dr Benny Peiser, the GWPF’s Director.
“It would appear that the Met Office provided government with rather poor if not misleading advice and we need to find out what went wrong. Lessons have to be learned well in advance of the start of next year’s winter so that we are much better prepared if it is severe again,” Dr Peiser said.
Last summer, the Department of Transport carried out a study of the resilience of Britain’s transport infra structure in the light of the two previous severe winters.
The Met Office informed the government that the chance of a severe winter would be relatively small and that the effect of climate change had further reduced the probability of severe winters in the UK.
The transport minister Philip Hammond said yesterday that he has asked the government’s chief scientific adviser whether the three winters was a ‘step change’ in weather in the UK.
“The Met Office appears to deny this possibility. But the key question is: if there was a ‘step change’ in the UK weather, what would it look like? The answer is, of course, it would look like what we have seen in recent years. Hence there is no logical case to say there hasn’t been a step change - we will have to wait and see but it cannot be ruled out,” said Dr David Whitehouse, the GWPF’s science editor.
In light of the renewed failure to prepare the UK for a prolonged and harsh winter, the following questions need to be addressed in order to avoid future debacles:
1. Why did the Met Office publish estimates in late October showing a 60 per cent to 80 per cent chance of warmer-than-average temperatures this winter? What was the scientific basis of this probabilistic estimate?
2. Has the October prediction by the Met Office that this winter would be mild affected planning for this winter? If so, what is the best estimate of how much this has cost the country?
3. Last year, the Met Office predicted a 65% chance that winter will be milder than normal. Has the Met Office subsequently explained what went wrong with its computer modelling?
4. What is the statistical and scientific basis for the Met Office’s estimate of a 1-in-20 chance of a severe winter?
5. Has the Met Office changed its view, or its calculations, following the harsh winters of 2008, 2009 and 2010?
6. Is the Met Office right to claim that the severe winters of the last three years are not related?
7. Which severe weather alerts were issued by the Met Office and when?
8. Although the Met Office stopped sending its 3-month forecasts to the media, it would appear that this service is still available to paying customers, the Government and Local Authorities for winter planning. What was their advice, in September/October, for the start of winter 2010?
9. Has the Met Office been the subject of any complaints from its paying customers regarding the quality of its advice?
10. Is it appropriate that the chairman of the Met Office is a member, or a former member of climate pressure groups or carbon trading groups?
11. Should senior Met Office staff (technically employed by the MoD) make public comments advocating political action they see necessary to tackle climate change?
12. Has the government evaluated different meteorological service providers and has it ensured that it is using the most accurate forecaster?
13. What plans has the government to privatise the Met Office?
Read post here. Read here how the Met Office advised against investment in snow clearing equipment as a cluster of cold winters was unlikely and thus this one would be warm in cotrast to the prior two brutal Dickensian winters. Wrong again.
GWPF Special Report
Met Office 2008 Forecast: Trend of Mild Winters Continues
Met Office, 25 September 2008: The Met Office forecast for the coming winter suggests it is, once again, likely to be milder than average. It is also likely that the coming winter will be drier than last year.
Reality Check: Winter of 2008/09 Coldest Winter For A Decade
Met Office, March 2009: Mean temperatures over the UK were 1.1 C below the 1971-2000 average during December, 0.5 C below average during January and 0.2C above average during February. The UK mean temperature for the winter was 3.2 C, which is 0.5C below average, making it the coldest winter since 1996/97 (also 3.2C).
Met Office 2009 Forecast: Trend To Milder Winters To Continue, Snow And Frost Becoming Less Of A Feature
Met Office, 25 February 2009: Peter Stott, Climate Scientist at the Met Office, said: “Despite the cold winter this year, the trend to milder and wetter winters is expected to continue, with snow and frost becoming less of a feature in the future.”
“The famously cold winter of 1962/63 is now expected to occur about once every 1,000 years or more, compared with approximately every 100 to 200 years before 1850.”
Reality Check: Winter Of 2009/10 Coldest Winter For Over 30 Years
Met Office, 1 March 2010: Provisional figures from the Met Office show that the UK winter has been the coldest since 1978/79. The mean UK temperature was 1.5 C, the lowest since 1978/79 when it was 1.2 C.
Met Office July 2010: Climate Change Gradually But Steadily Reducing Probability Of Severe Winters In The UK
Ross Clark, Daily Express, 3 December 2010: ONE of the first tasks for the team conducting the Department for Transport’s “urgent review” into the inability of our transport system to cope with snow and ice will be to interview the cocky public figure who assured breakfast TV viewers last month that “I am pretty confident we will be OK” at keeping Britain moving this winter. They were uttered by Transport secretary Philip Hammond himself, who just a fortnight later is already being forced to eat humble pie… If you want a laugh I recommend reading the Resilience Of England’s Transport Systems In Winter, an interim report by the DfT published last July. It is shockingly complacent. Rather than look for solutions to snow-induced gridlock the authors seem intent on avoiding the issue. The Met Office assured them “the effect of climate change is to gradually but steadily reduce the probability of severe winters in the UK”.
Met Office 2010 Forecast: Winter To Be Mild Predicts Met Office
Daily Express, 28 October 2010: IT’S a prediction that means this may be time to dig out the snow chains and thermal underwear. The Met Office, using data generated by a 33million pound supercomputer, claims Britain can stop worrying about a big freeze this year because we could be in for a milder winter than in past years… The new figures, which show a 60 per cent to 80 per cent chance of warmer-than-average temperatures this winter, were ridiculed last night by independent forecasters. The latest data comes in the form of a December to February temperature map on the Met Office’s website.
Reality Check: December 2010 “Almost Certain” To Be Coldest Since Records Began
The Independent, 18 December 2010: December 2010 is “almost certain” to be the coldest since records began in 1910, according to the Met Office.
Met Office Predicted A Warm Winter. Cheers Guys
John Walsh, The Independent, 19 January 2010: Some climatologists hint that the Office’s problem is political; its computer model of future weather behaviour habitually feeds in government-backed assumptions about climate change that aren’t borne out by the facts. To the Met Office, the weather’s always warmer than it really is, because it’s expecting it to be, because it expects climate change to wreak its stealthy havoc. If it really has had its thumb on the scales for the last decade, I’m afraid it deserves to be shown the door.
A Frozen Britain Turns The Heat Up On The Met Office
Paul Hudson, BBC Weather, 9 January 2010: Which begs other, rather important questions. Could the model, seemingly with an inability to predict colder seasons, have developed a warm bias, after such a long period of milder than average years? Experts I have spoken to tell me that this certainly is possible with such computer models. And if this is the case, what are the implications for the Hadley centre’s predictions for future global temperatures? Could they be affected by such a warm bias? If global temperatures were to fall in years to come would the computer model be capable of forecasting this?
A Period Of Humility And Silence Would Be Best For Met Office
Dominic Lawson, The Sunday Times, 10 January 2010: A period of humility and even silence would be particularly welcome from the Met Office, our leading institutional advocate of the perils of man-made global warming, which had promised a “barbecue summer” in 2009 and one of the “warmest winters on record”. In fact, the Met still asserts we are in the midst of an unusually warm winter - as one of its staffers sniffily protested in an internet posting to a newspaper last week: “This will be the warmest winter in living memory, the data has already been recorded. For your information, we take the highest 15 readings between November and March and then produce an average. As November was a very seasonally warm month, then all the data will come from those readings.”
Icecap Note: Please go to the GWPF website for full story and links here. Also see this morning’s Telegraph story on Piers Corbyn, the man who warned in advance it would likely (80%) be the coldest December on record with blizzards and 90% one of the top 3 Decembers for cold. Piers uses solar activity. Unlike the UKMO, he has nailed the last three winters, even correctly calling for storms and extremes in advance. He won a bet about a white Chistmas. Piers also warns of a multi decadal cold period like the early 1800s as we have here. The weather of Dickens age has returned as forecast.
Dr B Basil Beamish
Senior Lecturer in Mining Engineering, School of Mechanical and Mining Engineering, The University of Queensland, Brisbane Qld 4072
On Friday 29 October 2010, The Cairns Post reported on the recently released Climate Change Report with respect to impacts on the Far North Queensland region. One of the statements contained in the article was:
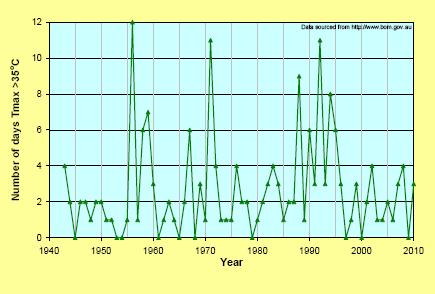
“The number of days over 35C in Cairns is expected to triple and the Gulf and Cape can expect longer drier spells interrupted by more intense rainfall.” If we just focus on the number of days over 35C statement, then how is this qualified? The words “expected to triple” are with respect to what baseline? How is this expectation derived, from historical data or models? The historical data can easily be checked by downloading the records for Cairns from the BOM website. The results are shown in Figure 1.

Figure 1 Temperatures for Cairns above 35C from 1943 to present (enlarged here)
The long term average number of days above 35C is 3 per year. There have been four years in the past (1956, 1971, 1988 and 1992) when the number of days has trebled or more above the long term yearly average. It can therefore be expected that this may occur again in the future as part of the natural variation; in fact looking at the frequency of these events, Cairns is overdue for another one of these above average years. The interesting question is should this not occur for say the next 10 years, does this refute the expectation being reported in this newspaper article?
Does this graph in fact support the concept that there has been a lack of evidence for warming in the Cairns region since 1996 and is the natural climate cycle in this region still operating within an historical range? Is there justification for an alternative view that the climate in Cairns may be moving into a cooling phase? As usual only time will tell.
Returning to the use of the unqualified word such as “expected”, what does this mean? There is no probability assigned to this descriptor. Yet based on the historical data a probability can be assigned to the hypothesis of a trebling of the number of days with temperatures above 35C from the long term average for Cairns. According to the records this value is 0.06 (or a 6% chance). Ironically there is twice as much chance (14.7%) that there will be no days above 35C.
The warmest period for Cairns shown in Figure 1 is from 1988 to 1995, and currently 2010 has reached the long term average of 3 days above 35C. With the current La Nina pattern in effect it will be interesting to see what maximum temperatures are recorded for November and December of 2010. At this stage it is clear that the 2000’s have not shown any unprecedented warming in the Cairns region based on this maximum temperature parameter.
The Indepedent
How’s this for upbeat reporting? “The breakthrough - which Britain and the Prime Minister did much to bring about - came amid unprecedented scenes of enthusiasm and emotion in the early hours of Saturday morning, when tears flowed and thunderous ovations from almost all the representatives of the 194 nations gathered in the resort’s sprawling Moon Palace hotel complex drowned out the last resistance.”
Thus, in The Daily Telegraph, the doyen of environment correspondents, Geoffrey Lean, gave David Cameron star billing for negotiating the saving of the planet at the Cancun UN climate change summit. Amazing, really, considering that our Prime Minister, in common with almost every other head of government, chose to stay away from unseasonably cool Cancun. He obviously has a wonderful telephone manner.
Yet what is this deal that had the delegates, by Lean’s on-the-spot account, shedding copious tears of happiness and relief? As far as I can tell, there was no advance on the vapid pledges made a year ago in Copenhagen, and which were deemed at the time to be retrograde and almost worthless. The UN member states agreed in Cancun that they “shall aim to complete” further commitments by developed nations to cut greenhouse gas emissions “as early as possible”. The agreement dropped the earlier text that called on the world to cut emissions by 50 per cent and richer countries by over 80 per cent by 2050; in its place, all concerned agreed to “work towards identifying a global goal for substantially reduced global emissions by 2050”. Yada, yada.
Oh, and the delegates repeated their Copenhagen commitment to set up a Green Climate Fund of $100bn to “address the needs of developing countries”. We are given no clear idea of how this money is to be raised, delivered or allocated.
In short, every decision which would actually involve invigilated action by identifiable countries has been kicked down the road to Durban, the venue for the final UN climate summit to renew the Kyoto Protocol before it lapses in 2012. Strikingly, it was the country which hosted that agreement, Japan (generally seen as the good guy in these circles), which declared at the outset of the Cancun summit that it now had no intention of agreeing any further cuts in emissions, unless China and America agreed to be bound by the 1997 Kyoto targets - which neither of the two biggest emitters have shown any inclination to do in the intervening period.
That they have not, owes more to reason than those nation’s critics are often prepared to allow. Even on the calculations of the Intergovernmental Panel on Climate Change (IPCC), full implementation of the Kyoto Accord would have cost hundreds of billions of dollars in lost economic growth, while helping to reduce global temperatures by less than one third of one degree Fahrenheit in 100 years. It is hardly any wonder that there are no serious economists to be found who think that the best way to relieve global poverty, in the developing world or anywhere else, is in fighting the good fight against carbon emissions.
Had the boom years of the late 1990s and early 2000s continued, then their arguments might have gained much less traction; but at a time of deep fiscal retrenchment and with a steep rise in families affected by fuel poverty (that is, those who need to spend over 10 per cent of their income on fuel) such critiques have become much more compelling. No wonder the developed nations were studiously unspecific in Cancun about the sources and method of collection of the $100bn Green Climate Fund for poorer countries. Just a cursory examination of the fiscal state of most Western European exchequers, not to mention the truly colossal budget deficit in the United States, and the inevitably harsh measures which will be imposed by those governments on their own citizenry, should be enough to make the poorer countries deeply cynical about their prospects of collecting said $100bn - as indeed they are.
Incidentally, it is one of the paradoxical aspects of this whole business that the most scary planetary overheating forecasts from the IPCC are predicated on a massive expansion of the economies of the developing world, as they embrace the path to growth from cheap electricity and motor travel which the West underwent (to our great advantage); on this basis, the developing world itself has a choice between warmer and richer, or less warmth and more poverty. Not surprisingly, it wants the former - which is why a year ago the World Bank was asked to approve a multibillion-dollar loan for South Africa to build what would be one of the largest coal-fired power stations in the world. While countries such as Britain and the US refused to vote for the loan, it was carried by the united support of the Bank’s board members from developing countries.
Nothing daunted, the British Government continues to insist that it will be “the greenest ever”, and presses ahead with plans to cover our countryside with grotesquely subsidised wind turbines and solar panels, almost as if unaware that other European nations, such as Germany, Spain and France, are rapidly reining back their bankrolling of landowners who have raked in billions of consumers’ and taxpayers’ money under the great green energy boondoggle.
The past freezing fortnight in the United Kingdom shed an especially illuminating light on the dottiness of relying on wind power. Because winds are frequently very low during the coldest weather, our shiny new green energy source was able only to supply one 500th of the exceptionally large demand, as much of the country experienced unprecedentedly low early winter temperatures. It is for similar reasons that Germany, despite its vast investment in wind power, has not been able to decommission a single one of its conventional power stations.
Geoffrey Lean tells us that “green technologies provide plenty of jobs ... they provide several times as much work per dollar invested than fossil fuels”. Yes, indeed, but it is only in the Alice-through-the-looking-glass world of “green economics” that nations are believed to benefit from a deliberate and dramatic loss of productivity and increase in costs per unit of energy generated. In the real world, it is a recipe for the import of carbon and the export of jobs. This, in part, is why the Bremen Energy Institute argues that “wind energy macroeconomically has a negative employment impact”.
As Jeremy Nicholson, the director of the Energy Intensive Users Group, which represents such industries as steel and aluminium, points out: “Outsourcing our emissions is not a solution to a global problem. Politicians need to understand that unilateral action will come at a terrible cost in terms of UK manufacturing jobs, investment and export revenue, for no discernible environmental gain. Is that what they really want?”
No, they surely don’t. On the other hand this Conservative-Liberal Coalition Government, like its Labour predecessor, sets great store by the almost imperial idea that the UK is a “world leader in the fight against climate change”, which, in legislative terms, means becoming an outlier in mandatory carbon emission reductions. This means that they get adulatory write-ups by environment correspondents attending UN summits, with the Prime Minister hailed as a saviour of the climate: on the other hand, it’s the rest of us who will have to pay the bill.
By Joseph D’Aleo, CCM, AMS Fellow
Summary: Have heat records increased and record low temperatures decreased as suggested by the IPCC greenhouse driven models?
Reference
Meehl, G.A., Byun, H.R., Tebaldi, C., Walton, G., Easterling, T., McDaniel, L., 2009, The relative increase of record high maximum temperatures compared to record low minimum temperatures in the U.S., Geophysical Research Letters, 36, L23701, doi:10.1029/2009GL040736
The authors note “The current observed value of the ratio of daily record high maximum temperatures to record low minimum temperatures averaged across the U.S. is about two to one. This is because records that were declining uniformly earlier in the 20th century following a decay proportional to 1/n (n being the number of years since the beginning of record keeping) have been declining less slowly for record highs than record lows since the late 1970s. Model simulations of U.S. 20th century climate show a greater ratio of about four to one due to more uniform warming across the U.S. than in observations.
Following an A1B emission scenario for the 21st century, the U.S. ratio of record high maximum to record low minimum temperatures is projected to continue to increase, with ratios of about 20 to 1 by mid-century, and roughly 50 to 1 by the end of the century.
Spurred by a warming climate, daily record high temperatures occurred twice as often as record lows over the last decade across the continental United States, new research shows. The ratio of record highs to lows is likely to increase dramatically in coming decades if emissions of greenhouse gases continue to climb.”
“Climate change is making itself felt in terms of day-to-day weather in the United States,” says Gerald Meehl, the lead author and a senior scientist at the National Center for Atmospheric Research (NCAR). “The ways these records are being broken show how our climate is already shifting.”
Enlarged here.
This graphic shows the ratio of record daily highs to record daily lows observed at about 1,800 weather stations in the 48 contiguous United States from January 1950 through September 2009. Each bar shows the proportion of record highs (red) to record lows (blue) for each decade. The 1960s and 1970s saw slightly more record daily lows than highs, but in the last 30 years record highs have increasingly predominated, with the ratio now about two-to-one for the 48 states as a whole.
The authors note “If temperatures were not warming, the number of record daily highs and lows being set each year would be approximately even. Instead, for the period from January 1, 2000, to September 30, 2009, the continental United States set 291,237 record highs and 142,420 record lows, as the country experienced unusually mild winter weather and intense summer heat waves.”
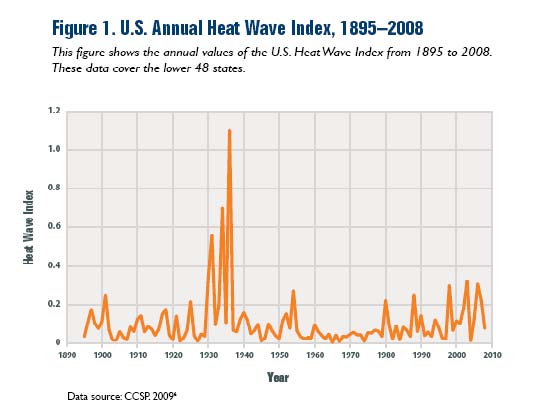
Comments: This study is flawed in a number of ways. First it starts after the heat wave spike in the 1930s and 1940s as shown by NOAA in the CCSP report here. That report developed a heat wave index and remarked about the 1930s super max and a steady rise after the 1960s.
Enlarged here.
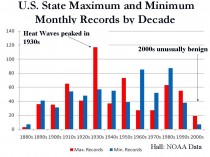
Bruce Hall showed using NCAR historical data for state record highs and lows the 1930s peak and a second minor peak in the 1990s but a decline in heat records after. It also shows record lows peaking in the 1960s and 1980s with a decline after.
Also we should note with increased urbanization, we would expect fewer overnight low records since nighttime temperatures are most affected by urban heat island.
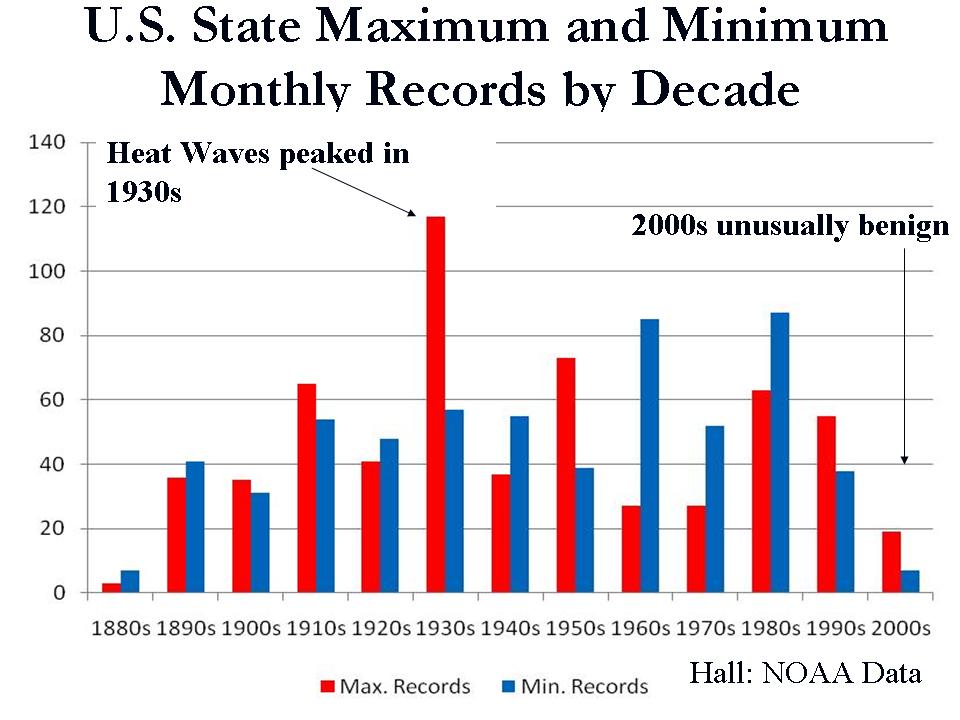
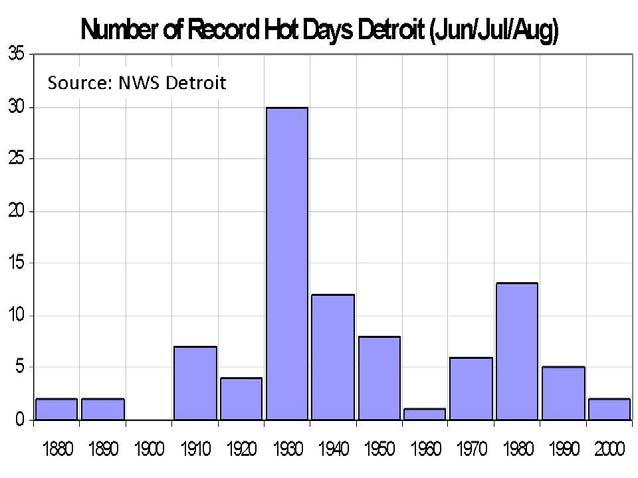
The same heat wave pattern can be seen in city decadal records all over the country as in Detroit and Boston summer heat records below (taken from NOAA city records).
Enlarged here.

Enlarged here.
Enlarged here.
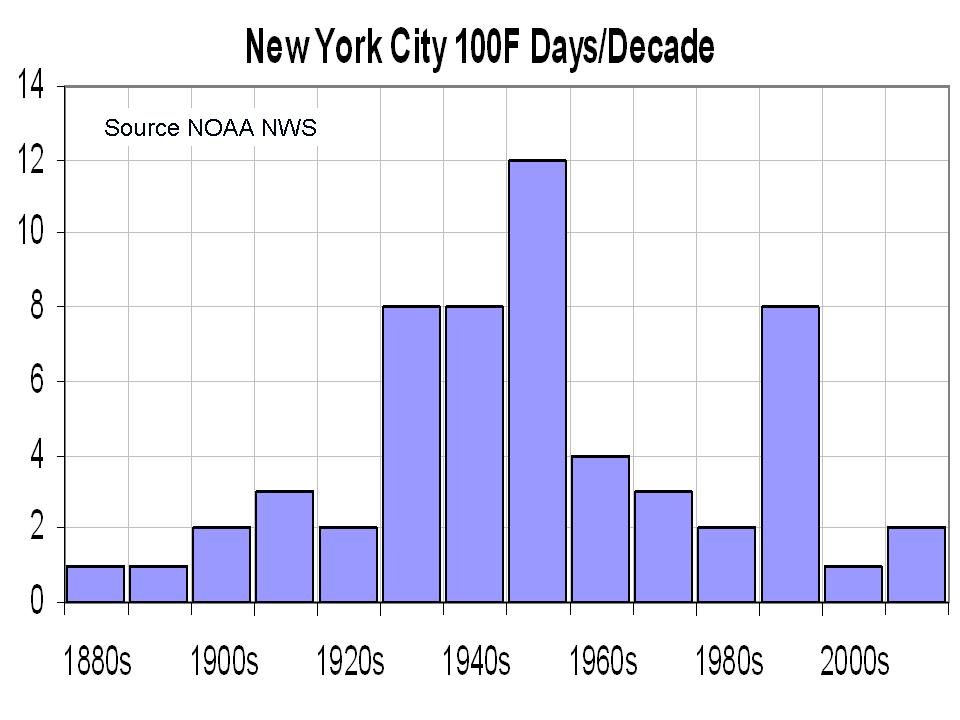
New York City experienced two 100F days this past summer a year after June and July averaged the third coldest in the entire record. There was only 1 such day in the 2000s. In a similar sine wave like oscillation, one can see the 1930s to 1950s peak with a second peak in the hot days of two 1980 summers. The frequency the last two decades is the lowest since the early record in the 1880s though the 1920s.

Enlarged here.
In viewing the data above, it is clear that any increases in heat records are unremarkable compared to the early 20th century, most notably the 1930s. The changes in the ratios of heat to cold records computed by the authors was primarily due to the diminished cold record the last two decades, consistent with the urban heat island expansion. The number of records, both low and high have diminished in recent years. Indeed the last decade was unusually benign and by this measure certainly not increasingly extreme. See PDF here. See more from Steve Goddard here.
See also Dr. Richard Keen’s post on the NCAR study here.
Though we focused on record summer highs, which the alarmists like to point to as health threats (winter record highs don’t kill, record lows often can) the winters have not for the United States followed the model forecast trend this last decade as Steve Goddard has shown.

Enlarged here.
By Paul Driessen, Canada Free Press
Average annual global temperatures have risen a degree or two since the Little Ice Age ended some 150 years ago. Thank goodness. The LIA was not a particularly pleasant time.
Prolonged winters, advancing glaciers, colder summers, more frequent storms and extended cloudiness reduced arable land, shortened growing seasons, rotted grain in wet fields, and brought famine, disease and death. Coming after the prosperous Medieval Warm Period - when farmers grew wine grapes in England and Vikings raised crops and cattle in Greenland - it must have been quite a shock.
The LIA underscored how much better a warmer planet is than a colder one. Moderate warming above today’s norm would likely bring expanded cultivation during longer growing seasons in northern latitudes, fewer people dying from hypothermia during frigid winters, and many other benefits.
What caused the Medieval Warm Period to end, and the Little Ice Age to come and go, is still debated. Even the best scientists don’t fully understand what alignments of solar, cosmic, oceanic, atmospheric and planetary forces control this millennial warm-cool rhythm.
In any event, the initial warming of 1850-1900 was followed by perhaps an additional overall 1.3 degrees Fahrenheit (0.8 degrees Celsius) of warming during the twentieth century. However, it was not a steady rise in temperatures, proportionate to increasing atmospheric carbon dioxide levels, as “manmade climate disaster” themes suggest. Instead, Earth warmed noticeably 1900-1940, cooled slightly 1940-1975 ("most scientists” worried about another little ice age), warmed again 1975-1995 ("most scientists” feared global warming), and exhibited little change from then to the present.
The 20-year late twentieth century warming supposedly justifies demands that we stop using hydrocarbon fuels, halt US economic growth, hold back Third World development, ban incandescent light bulbs, blanket the planet with unreliable wind turbines and solar panels, make recompense to poor nations for emitting CO2 and “causing global climate disruption,” and even consider “geo-engineering” (putting dust particles or tiny mirrors into space to block the sun’s rays) to prevent warming that stopped in 1995. Even though no reliable or factual evidence shows that this recent warming was (primarily) human-caused!
These are important issues for the next Congress (and others) to grapple with. But an even more fundamental question is rarely raised, and almost never addressed.
How much credence can we give any claim that average global temperatures have risen or fallen X degrees over a certain period, or that this year or decade is “the warmest ever,” or “since record-keeping began” - especially when the alleged difference is measured in tenths or hundredths of a degree?
The answer: Not much. The truth is, we cannot trust the hype and numbers that routinely come out of the IPCC, NOAA, NASA, CRU, White House and other branches of the climate crisis industry.
Certainly, satellites have gathered arguably reliable atmospheric temperature data since 1980. However, they obviously provide no insights into pre-1980 warming and cooling trends. And for 1850 to 1930, we must rely on scattered land and oceanic thermometer measurements; historic anecdotes, diary entries and paintings that give only general descriptions of climate, heat waves, floods and blizzards; and “proxy” records like tree rings. Even together, this evidence is so sparse, scattered and of uneven quality that it cannot and must not be used to drive major energy, economic and environmental policy decisions.
Calibrated thermometers were invented in 1724, but they provide only random measurements for vast continental land masses until well into the twentieth century - and across much of Africa, Asia and South America even today. No one can calculate 1850-1950 average global temperatures from that. To fill in the huge gaps, scientists often utilize tree rings. However, annual tree growth is determined as much by rainfall as by temperature. Far worse, researchers have been caught selecting twelve trees out of hundreds from Siberia, to generate desired “warming trends,” and splicing thermometer measurements onto tree ring data that suddenly showed inconvenient “cooling” trends.
Temperature data from the 71% of Planet Earth covered by oceans is even more sporadic. Today, buoys and satellites cover large expanses that previously were measured only by ships traveling different routes, during favorable times of the year, using a variety of methods to measure seawater and air temperatures. But even today only a small portion of Earth’s oceans are measured regularly or accurately.
Compounding these problems, 55% of the 12,000 surface temperature stations operating in 1990 have been closed down ‘ and many of the now missing stations were in Siberia and other cold regions. This alone has created a significant 20-year “warming” bias, notes former University of Winnipeg climatology professor Tim Ball.
Today, nearly half of the world’s remaining stations are located in the United States, on 1.9% of the Earth’s surface. The vast majority are in the Lower 48 States. And as meteorologist Anthony Watts has documented, most of those stations are near parking lots, air conditioning exhaust ports, highways, airport tarmac and other artificial heat sources - all of which skew the recorded temperatures upward. His report, “Is the US surface temperature record reliable?” is a real eye-opener.
However, none of this sobering reality deters climate chaos alarmists, who consistently show a penchant for distributing dire news releases on the eve of important global warming votes and conferences.
2000-2010 was “the hottest decade ever,” and 2010 “is shaping up to be the hottest year on record,” NASA and NOAA breathlessly announced...on July 28, prior to hoped-for Senate votes and the Cancun summit. “World temperatures in 2010 may be the warmest on record. 2010 will be one of the two warmest years, going back to 1850,” Britain’s Meteorology Office intoned...in late November.
“This year will be the third warmest year on record, since 1850,” the World Meteorological Organization declaimed...on December 3. Other organizations issued similar headline-grabbing alarums.
But before you say kaddish or “requiescat in pace” for Mother Earth, keep the previous caveats in mind and note a few other realities. One, only a few hundredths of a degree separate the 2010 decade from the similarly very warm 1930s - and NASA and other researchers refuse to release their raw temperature data and analytical methods, so that independent researchers can examine their calculations and claims.
Two, most of 2010 was marked by El Nino, the warming phase of the periodic climate pattern across the tropical Pacific Ocean that typically makes summer months warmer than usual. Three, the pre-Cancun pronouncements were based on January-through-October temperatures, and an assumption that November and December will be “average.”
Four, the climate and record books are not cooperating with that assumption or the hype, headlines and summit on Climate Armageddon. South Florida just had its coldest night in 169 years, Wales its coldest since recordkeeping began; and in the middle of its global warming gabfest, Cancun set four record low temperatures in a row. Other local cold records are falling all over the Northern Hemisphere, hot on the heels of record cold and snow during the 2009-2010 winter in both hemispheres.
But then “climate policy has almost nothing to do anymore with environmental protection,” IPCC Working Group III co-chair Ottmar Edenhofer reminded us recently. In fact, “the world climate summit in Cancun is actually an economy summit, during which the distribution of the world’s resources will be negotiated.” [emphasis added] Keep that in mind, too, next time someone says we have a climate crisis.
Magic is delightful when it’s Criss Angel or Harry Potter. Magic temperature numbers - pulled out of hats, computers and fertile imaginations - are a lousy, fraudulent, redistributionist way to set public policy.
Read more here.
Rasmussen Reports
Most U.S. voters continue to be concerned about global warming but still are more inclined to think it’s caused by planetary trends rather than human activity.
A new Rasmussen Reports telephone survey of Likely Voters finds that 41% think global warming is caused primarily by human activity, while 47% say long-term planetary trends are to blame. (To see survey question wording, click here.)
This is consistent with findings for nearly two years. A higher percentage of voters have consistently blamed global warming on planetary trends rather than human activity since early February 2009 despite the insistence of President Obama, the United Nations and a large part of the world scientific community that humans are the bigger culprits.
Regardless of what’s to blame, voters take global warming seriously. Fifty-nine percent (59%) say it is at least a somewhat serious problem, including 32% who see it as Very Serious. But this concern has fallen since last November when the so-called ‘Climategate’ scandal broke, raising questions about the reliability of pro-global warming research. Thirty-eight percent (38%) now do not see global warming as a serious problem, including 16% who say it’s Not At All Serious.
Read more here.
By Robin Bravender, Politico
The Obama administration scored a legal victory Friday when a federal appeals court refused to block federal climate regulations slated to kick in next month.
State and industry challengers opposing the Environmental Protection Agency’s climate regulations had asked the U.S. Circuit Court of Appeals for the District of Columbia to halt the rules while the massive court battle plays out, but the court wasn’t convinced.
A host of states, industry groups and free-market groups are suing EPA over its regulations aimed at curbing greenhouse gases from automobiles and large industrial sources like power plants and oil refineries, as well as the so-called endangerment finding underpinning the rules.
David Doniger, a Natural Resources Defense Council attorney representing environmental groups in the case, said the decision is a sign that the “industry and state case against the regulations is pretty flimsy.”
In order to persuade the court to stall the rules, he said, “they had to show that they had some significant likelihood of winning the case on the merits and they also had to show that they would be irreparably harmed and they have failed. And the court has said, ‘We’re not going to block the rules, any of them.’”
Doniger said the court’s decision should also send a powerful signal to lawmakers on Capitol Hill who want to hamstring EPA’s climate rules. “This should tell the Congress something, too, namely that the court having looked at everything was completely unpersuaded,” he said.
But Patrick Day, an attorney at Holland & Hart representing industry opposing EPA, said it isn’t appropriate to read anything into the merits of the case. “The order doesn’t address the merits argument at all,” he said.
Without a court order to block the rules, he warned of dire economic consequences. “Those who oppose the rule believe that EPA is essentially grabbing hold of the entire economy of the country essentially, and that’s troublesome to many,” Day added.
Read more here.