

By Jeremy Lovell, Reuters
British climate and energy policy is incoherent and needs an overhaul, dumping carbon targets and building more coal and nuclear power stations to stop the lights going out, a pro-nuclear scientist said. A report entitled ”A Pragmatic Energy Policy for the UK”, by Professor Ian Fells and Candida Whitmill, said renewables would not fill the impending energy gap so old nuclear and coal plants had to be kept going while new ones were built urgently.
“Current UK energy policy is not fit for purpose. Something has to be done about it if we are not going to run into serious problems around about the middle of the next decade,” Fells, an advocate of nuclear power, told reporters. The government should guarantee a minimum electricity price to the power companies for the next 30 years to give them a secure investment outlook to finance the 4 billion pounds each nuclear power plant is likely to cost, he added.
“We are looking at something that looks like a slow motion train crash,” Fells said, accusing the government of vacillating over climate change and energy policy, starving the power industry of direction and reducing investment to a minimum. The same held true across Europe where nuclear power was resurgent as governments woke up to the fact that they had delayed important baseload energy investment decisions for too long and placed too much reliance on intermittent renewables.
Environmentalists were outraged at the recommendations in the report, issued on Wednesday. “Professor Fells has a long standing love affair with the technologies of the 20th century, but as time goes by his fetish for coal and nuclear power looks increasingly naive,” said Greenpeace chief scientist Doug Parr.
The report, commissioned by industrialist Andrew Cook, who told the news conference he feared a complete societal breakdown if there were widespread power cuts, said energy security had now to be given absolute priority over climate change policies. It was a view echoed by Whitmill: “Today’s credit crunch is a head cold compared with the double pneumonia this country will suffer if we don’t implement an energy policy urgently.” Read more here.
By Alan Caruba
There’s a wonderful irony in the fact that, back in the 1970s, the Greens were issuing warnings and even writing books about the coming Ice Age. They would abandon this issue, based in well-known and accepted solar science, in favor of a vast international hoax alleging man-made global warming. As the global warming hoax begins to lose its power to influence public opinion and policy, the Greens are not likely to be heeded for a long time to come because they were right about an Ice Age and lying through their teeth about global warming.
Scientists and laymen who follow the Ice Age cycles have been warning that, if not a full-fledged Ice Age, at the very least a Little Ice Age comparable to one that lasted from 1300 to around 1850 is on its way. Amidst all the media coverage of Hurricane Gustav and the Republican Convention, a report in DailyTech.com was not likely to get much attention, but it forecast a very cold world in the years to come. The Earth has already started to cool and scientists date the change from 1998. Headlined, “Drop in solar activity has potential effect for climate on Earth”, the news is that, for the first time in 100 years, “an entire month has passed without a single visible sunspot being noted.” The author, Michael Asher, noted that “The event is significant as many climatologists now believe solar magnetic activity - which determines the number of sunspots - is an influencing factor for climate on Earth.”
As the DailyTech report notes, “In the past 1000 years, three previous such events, the Dalton, Maunder, and Sporer Minimums,” of reduced sunspot activity, “have all led to rapid cooling,” adding that, “For a society dependent on agriculture, cold is more damaging than heat. The growing season shortens, yields drop, and the occurrence of crop-destroying frosts increases.”
An article by William Livingston and Matthew Penn of the National Solar Observatory in Tucson, Arizona, “Sunspots May Vanish by 2015”, predicts that sunspots will disappear completely. “Such an event would not be unprecedented, since during a famous episode from 1645-1715, known as the Maunder Minimum”. That solar cycle “was shown to correspond with the reduced average global temperatures on the Earth.” In other words, it’s going to get COLD.
The Little Ice Age had an effect on history as you might imagine. The French Revolution is attributed to it insofar as the cost of bread rose as wheat crops failed. Riots followed. Similarly, Napoleon’s invasion of Russia met with defeat thanks to a winter that killed thousands of his troops. In America, it was reflected in the travails of Valley Forge.
Over at IceAgeNow.com, Robert Felix posts the latest news from around the world that tells of anomalous events ranging from freak early snow storms to expanding glaciers. Soon enough, those living in the northern hemisphere will become more aware as winters lengthen and become more severe. After that, the scenarios grow quite serious.
Even the venerable Old Farmers Almanac is making news these days forecasting a far cooler winter and suggesting that the Earth is already in a cooling cycle. No doubt some diehard Greens like Al Gore will continue to spout nonsense that the cold weather is due to global warming, but it has to do with the Sun that’s gone quiet. It’s not myth. It’s reality. Read full post here.
By Robert S. Boyd, McClatchy Newspapers, Miami Herald
Scientists are raising alarms about yet another threat to Earth’s climate and human well-being. This time it’s nitrogen, a common element essential to all life.
For years, people have been bombarded with warnings about the harmful effects of carbon - especially in the form of carbon dioxide (CO2), a greenhouse gas widely blamed for global warming. Now, it’s becoming clear that human activities, such as driving cars and raising crops, also are boosting nitrogen to dangerous levels - polluting air and water and damaging human health.
An expanding flock of international scientists is concentrating on the nitrogen threat. There’s a reactive nitrogen conference somewhere in the world almost every month. “The public has learned a lot about carbon and its contribution to global change,” said James Galloway, an authority on nitrogen at the University of Virginia. “However, they know less about nitrogen and its numerous impacts on environmental issues, including global change.” “It’s crucial for people to become aware of the nitrogen problem,” said Cheryl Palm, an expert on tropical agriculture at Columbia University.
Pure nitrogen is a colorless, odorless gas and the largest single component of Earth’s atmosphere. Every breath you take is almost 80 percent nitrogen. However, about 1 percent of the stuff is so-called “reactive nitrogen.” It combines with other elements, such as oxygen and hydrogen, to form hundreds of thousands of chemical compounds - some beneficial, some harmful. Many of these compounds are valuable in industry and agriculture. They preserve foods and wine, enhance oil production, make plastics and explosives, and fill automobile airbags. They form the building blocks of life: DNA, genes and proteins. Their biggest use is in synthetic fertilizers.
“We estimate that nitrogen fertilizers are currently responsible for feeding 48 percent of the world’s population,” Galloway said. On the other hand, reactive nitrogen has many negative effects. Its compounds create smog, cause cancer and respiratory disease, and befoul rivers, lakes and coastal waters. They create “dead zones” in the ocean, corrode roads and bridges, weaken the ozone shield and add another greenhouse gas to the already overburdened atmosphere.
“Human activity has doubled the rate of formation of reactive nitrogen over natural rates on the land surfaces of the Earth,” said Alan Townsend, director of the North American Nitrogen Center at the University of Colorado in Boulder. “The change is recent and rapid, making accelerated nitrogen cycling one of the most immediate and consequential facets of global change.”
Some environmental scientists worry that raising alarms about the danger of nitrogen - at the same time as carbon dioxide - may overwhelm government agencies and private citizens. “It has taken some of the public and the government quite some time to be aware of the CO2 problem,” Palm said. “Adding another ‘element’ to their concerns could cause confusion.” Read more of this story here.
Looks like some environmental scientists are beginning to hedge against the world finally recognizing that CO2 for what it is, a harmless, beneficial gas that acts as a free plant fertilizer.
By Geoffrey Lawrence
Residents of New Hampshire could soon have their ability to choose how they live, how they travel and what they buy taken away from them. The New Hampshire Department of Environmental Services (DES) is currently considering a large basket of costly new taxes, subsidies and regulations designed to reduce emissions of greenhouse gases. They include statewide restrictions on zoning, housing development, energy use, industrial processes and transportation.
Last December, Gov. John Lynch created the New Hampshire Climate Change Policy Task Force to work in conjunction with DES to develop policy options designed to address global warming. The DES, in turn, hired a global warming alarmist group called Carbon Solutions New England (CSNE) to serve as a technical consultant to the task force on scientific and policy issues related to global warming.
CSNE writes on its Web site that “we must achieve an urgent and unprecedented level of carbon dioxide emission reduction over the next decade addressing the interdependent issues of energy and climate requires a transformational response.” This transformation envisions the state restricting personal freedom in an effort to coerce individuals into making the “right” decisions as interpreted by the state.
Even more distressing is that Cameron Wake, who represents multiple organizations and is CSNE’s director, has monopolized the information that is presented to the task force. Wake has also presented material in conjunction with a related organization called Clean Air-Cool Planet (where he is identified as “chief scientist") and on behalf of the University of New Hampshire’s Climate Change Research Center, where he holds a full-time position.
The task force has neither heard testimony nor been presented any evidence that contradicts the viewpoints held by CSNE. As one official document states, CSNE is to “inform and support the development of technical and policy consensus.” Allowing for open and honest debate before the task force would certainly not generate the consensus sought by these alarmist advocates, as CSNE has been allowed to set the agenda and control the process. The executive branch has effectively given them carte blanche to develop their own policies that are designed to address their foregone conclusions.
Other policies under consideration include: taxing individuals for each pound of trash they produce; imposing higher automotive registration and insurance rates on individuals who drive more; increasing gasoline taxes; reducing the availability of parking; and establishing “Residential Behavior Change Programs” that would employ community networks to intimidate individuals into “making sustained, socially beneficial changes at the household level.”
What benefit might Granite Staters reasonably expect to receive in exchange for their freedom? Realistically, they should expect these policies to have no effect at all on global warming. Thomas Wigley, a well-known climatologist who served as an adviser to Al Gore, has concluded that a major reduction in greenhouse gas emissions on a global scale (in line with the Kyoto Protocol) would have no measurable effect on temperature over the next century. If the entire world could have no measurable effect, it is absurd to presume that New Hampshire could have any effect on temperature by acting alone. Read more here. See this analysis on NH climate in answer to this ridiculous effort in my home state here.
Wall Street Journal On-Line
Congress is usually scrambling for revenue to spend, not rejecting it out of hand. Which makes it all the more strange that Democrats have resisted the windfall they stand to collect if they drop their ban on offshore oil-and-gas development.
Allowing drilling isn’t the giveaway to industry that Speaker Nancy Pelosi and environmentalist dead-enders claim. In fact, liberating publicly owned resources could net the Treasury as much as $2.6 trillion in lease payments, royalties and corporate taxes, according to one estimate currently knocking around Capitol Hill. The returns wouldn’t roll in overnight, but that’s almost a full year of spending even for this spendthrift Congress.
Already, with the ban in place, offshore development is one of the federal government’s greatest sources of nontax revenue, amounting to $7 billion and change in 2007. Energy companies bid competitively to acquire leases upfront, then pay rents. The feds are also entitled to a royalty on the market value of oil and gas when sold. Corporate income taxes on producer profits add to the bank.
All told, studies (some industry-funded, some independent) estimate that the total government take from leases in the Gulf of Mexico ranges from 37% to 51%, depending on the location of the lease. The take is somewhat higher is Alaska. If the ban were lifted, how much Congress might rake in depends on how much oil and gas is recovered, as well as energy prices, royalty rates and taxes at any given time. A 2007 study by University of California economists Matthew Kotchen and Nicholas Burger concludes that opening up a small portion of the coastal plain of the Arctic National Wildlife Refuge would generate $251 billion in government and state revenue, with oil at its 2005 price of $53 per barrel. Prices are now double that.
And that’s just for a patch in Alaska. The $2.6 trillion estimate, prepared by John Peterson (R., Pa.) and Neil Abercrombie (D., Hi.), is a back-of-the-envelope calculation from exploiting the 86 billion barrels of oil and 420 trillion cubic feet of natural gas that the Department of the Interior determines are undiscovered but “recoverable” on the Outer Continental Shelf. And these volumes are almost certainly too conservative.
We don’t know what’s actually out there because analysis with modern equipment has been forbidden by Congress in many areas for 26 years. Exploration technology is considerably more advanced today.
In other words, Congress can expect buckets of revenue if it gets out of the way of an ocean of oil. Since fossil fuels are expected to provide nearly the same share of total energy supply in 2030 as they do today—even with major growth in alternative energy—Washington might as well make a few bucks. See story and more here.
By Shawn Whelan, Comment on Climate Audit
The ice level in the 1920’s, 30’s and early 40’s was at a similar low level. The St. Roch went easily through the Northern route of the NW passage which is closed this year and that was in 1944. The HBC had many other boats freely navigating the southern route of the NW Passage.
Gjoa Haven(1930) and Cambridge Bay(1929) pictures showing low ice level. A lot more info in that link.

Hudson’s Bay Co. ship Baymaud, Cambridge Bay, south of Victoria Island, April 30, 1929. (L.T. Burwash/National Archives of Canada/PA 99698)
This little boat the Aklavik also made it through the NW Passage in 1937. Navigating the Northwest Passage in 1937 was a feat still unknown to most Canadians. The more publicized trip of the St. Roch, the RCMP ship, in 1942, is generally regarded as the first Canadian transit through the Passage. However, Scotty Gall piloted the HBC ship Akluvik through the Passage in the course of dropping supplies to HBC posts in 1937. He admits his trip was not publicized because individuals with the Bay at the time did not see that it was in their interest to publicize anything in the North.
Nascopie and Aklavik meet from East and West in 1937. The Nascopie commonly travelled through the passage in the 30’s. This evidence is ignored by science, and it shows the conditions in the Arctic in the thirties were similar to today. And then in the late 40’s the Arctic froze up and the HBC shut some of their posts due to the increased ice. What is called science has become an embarassment.
Icecap Note: The Northwest Passage was not finally conquered by sea until 1906, when the Norwegian explorer Roald Amundsen, who had sailed secretly to escape creditors seeking to stop the expedition, completed an arduous three-year voyage in the converted 47-ton herring boat Gjöa. The first single-season transit was achieved in 1944, when Sergeant Henry A. Larsen, of the Royal Canadian Mounted Police, made it through in a schooner. Interest in the Northwest Passage slackened until the 1960s, when oil was discovered in North Alaska and there was a desire for a short water route to transport oil to the east coast of the United States.
Dr. Gary Sharp has written about arctic explorer and scientist Joe Fletcher, recently deceased “About arctic passages “Joe pointed out several times to me in his B/W movies that there were seasons of nearshore ice-free situations - and others when skis or overflights were the only way in or out. Unfortunately - not enough years of observations - or guys with the right questions out there. Between 1956 and 1989 there were 33 passages. They are listed in the book Northwest Passage by Edward Struzik published in 1991. One was by K. Horie aboard the Japanese sloop Mermaid, who made an east to west passage in 1981-83. Another was by W. De Roos in a 42 foot ketch named Williwaw, who made the first single handed Passage in 1977 when the Northern Hemisphere was rather cold. Then, of course, there were all those US and Russian submarines cruising under the polar ice in the late 1950-90 Cold War period - that would occasionally find a hole - and pop up for a look-see.”
By Phil Brennan, Newsmax
The global warming theory is going into the freezer, some climate experts say. The first half of this year was the coolest in at least five years, according to the World Meteorological Organization (WMO). And the global warming that has taken place during the past 30 years is over, says geologist Don J. Easterbrook, a professor emeritus at Western Washington University.
Easterbrook, who has written eight books and 150 journal publications, predicts that global temperatures at the end of the century will be less than 1 degree cooler than now. This is in contrast to other theories saying that temperatures will warm by as much as 10 degrees by 2100. In March, Easterbrook said he was putting his “reputation on the line” by predicting global cooling.
“The average of the four main temperature measuring methods is slightly cooler since 2002 [except for a brief El Nino interruption] and record breaking cooling this winter. The argument that this is too short a time period to be meaningful would be valid were it not for the fact that this cooling exactly fits the pattern of timing of warm/cool cycles over the past 400 years,” Easterbrook wrote on March 1.
Added to his assertion was the WMO revelation that the first half of 2008 was the coolest for at least five years and that the rest of the year almost will certainly be cooler than recent years, although temperatures remain above the historical average. The global mean temperature to the end of July was 0.28 degrees Celsius above the 1961-1990 average, Britain’s Met Office Hadley Centre for climate change research said Wednesday. That would make the first half of 2008 the coolest since 2000. Chillier weather this year is partly because of a global weather pattern called La Nina that follows a periodic warming effect called El Nino. “We can expect with high probability this year will be cooler than the previous five years,” said Omar Baddour, responsible for climate data and monitoring at the WMO. “Definitely the La Nina should have had an effect, how much we cannot say. Up to July 2008, this year has been cooler than the previous five years at least. It still looks like it’s warmer than average.”
Ivy League geologist Robert Giegengack, a professor of Earth and environmental science at the University of Pennsylvania, told phillymag.com that the history over the last 1 billion years on the planet reveals “only about 5 percent of that time has been characterized by conditions on Earth that were so cold that the poles could support masses of permanent ice.” Giegengack also noted that, “for most of Earth’s history, the globe has been warmer than it has been for the last 200 years. It has rarely been cooler.” Further ammunition for global warming skeptics came from south of the border, where a Mexican scientist warns that Earth will enter a “little ice age” for up to 80 years because of a decrease in solar activity. Victor Manuel Velasco Herrera, a researcher at the Institute of Geophysics at Mexico’s National Autonomous University, predicts that the ice period will begin in about 10 years. Predictions of a gradual increase in temperatures called global warming are erroneous, Velasco Herrera told a conference at the Centre for Applied Sciences and Technological Development regarding predictions of the Intergovernmental Panel on Climate Change (IPCC). The IPCC models and forecasts are wrong because they are based only on “mathematical models and presented results at scenarios that do not include, for example, solar activity,” he said. The phenomenon of climate change should include other kinds of factors, both internal, such as volcanoes and human activity, and external, such as solar activity, he said. “In this century, glaciers are growing,” as seen on the Perito Moreno mountain in the Andes; on Mount Logan, the highest mountain in Canada; and on Franz-Josef Glacier, New Zealand, Velasco Herrera said. Read more here.
By Climate Statistician Dr. William M. Briggs
The advice which forms the title of this post would be how Don Rickles, if he were a statistician, would explain how not to conduct times series analysis. Judging by the methods I regularly see applied to data of this sort, Don’s rebuke is sorely needed.
The advice is particularly relevant now because there is a new hockey stick controversy brewing. Mann and others have published a new study melding together lots of data and they claim to have again shown that the here and now is hotter than the then and there. Go to climateaudit.org and read all about it. I can’t do a better job than Steve, so I won’t try. What I can do is to show you what not to do. I’m going to shout it, too, because I want to be sure you hear.
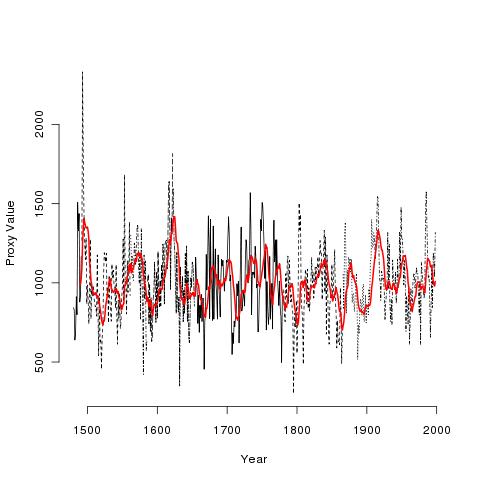
Mann includes at this site a large number of temperature proxy data series. Here is one of them called wy026.ppd (I just grabbed one out of the bunch). Here is the picture of this data:

See larger image here.
The various black lines are the actual data! The red-line is a 10-year running mean smoother! I will call the black data the real data, and I will call the smoothed data the fictional data. Mann used a “low pass filter” different than the running mean to produce his fictional data, but a smoother is a smoother and what I’m about to say changes not one whit depending on what smoother you use.
Now I’m going to tell you the great truth of time series analysis. Ready? Unless the data is measured with error, you never, ever, for no reason, under no threat, SMOOTH the series! And if for some bizarre reason you do smooth it, you absolutely on pain of death do NOT use the smoothed series as input for other analyses! If the data is measured with error, you might attempt to model it (which means smooth it) in an attempt to estimate the measurement error, but even in these rare cases you have to have an outside (the learned word is “exogenous") estimate of that error, that is, one not based on your current data.
If, in a moment of insanity, you do smooth time series data and you do use it as input to other analyses, you dramatically increase the probability of fooling yourself! This is because smoothing induces spurious signals - signals that look real to other analytical methods. No matter what you will be too certain of your final results! Mann et al. first dramatically smoothed their series, then analyzed them separately. Regardless of whether their thesis is true - whether there really is a dramatic increase in temperature lately - it is guaranteed that they are now too certain of their conclusion.
There. Sorry for shouting, but I just had to get this off my chest.
Climate statistician Dr. William M. Briggs, who specializes in the statistics of forecast evaluation, serves on the American Meteorological Society’s Probability and Statistics Committee and is an Associate Editor of Monthly Weather Review.