

CO2 Coalition, Gordon Fulks, Tony Heller
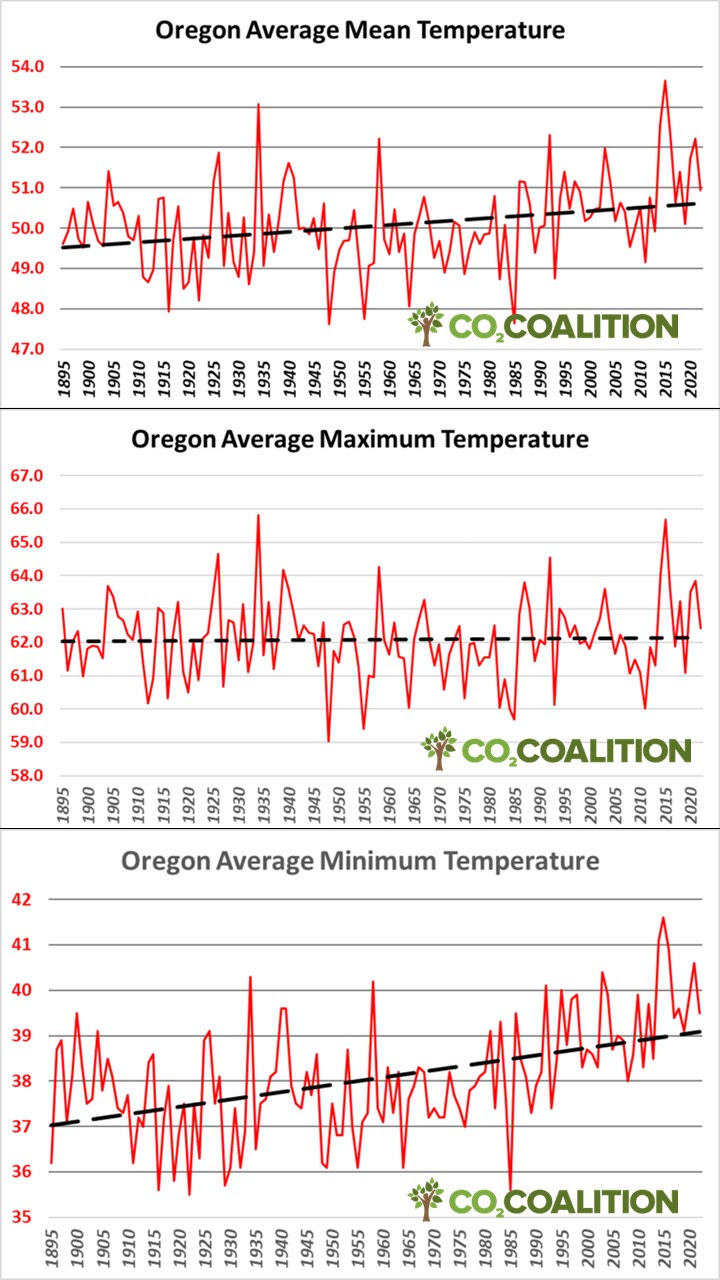
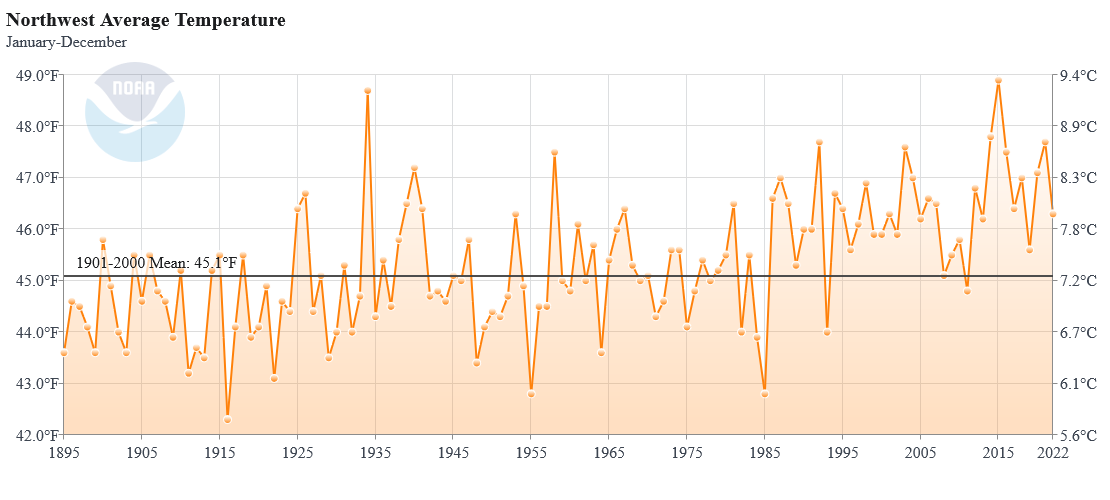
I traveled to Oregon last week at the invitation of a CO2 Coalition supporter. Besides being completely off the grid at a lodge on the scenic Rogue River, I gave a presentation to about 50 people from southern Oregon after returning from the wilderness. As you can imagine, the climate zealots are in full-on crisis mode in the Beaver State. For my talk, I examined Oregon-specific temperature data. The top image shows Annual Mean Temperature that reveals about a 1-degree Fahrenheit (F) increase since 1895 which is hardly a crisis.
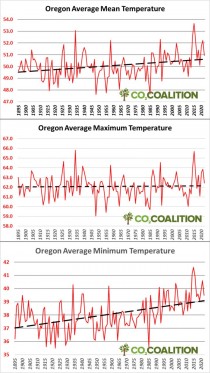
Interestingly, maximum temperatures were basically flat going back 125 years, while the low temperature readings had increased by 2.0 degrees F. Increasing night-time low temperatures benefits agriculture by extending growing seasons. Sleep well, Oregonians. There is no climate crisis.
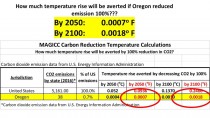
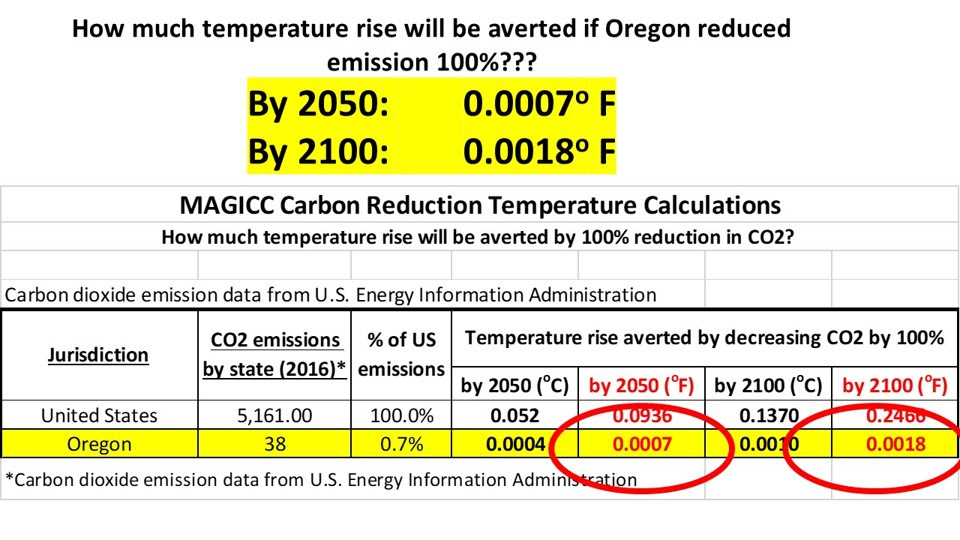
So, what will the citizens of Oregon get for going to net zero? Analysis using the MAGICC simulator indicates that, had the state attained zero emissions in 2010, the warming averted in 2050 and 2100 would be 0.0007 and 0.0018 degrees Fahrenheit, respectively. These are theoretical effects that could not be measured and would make no difference.
Oregonian scientist Dr. Gordon Fulks commented.
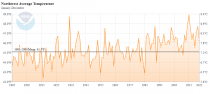
“About ten years ago, I downloaded this chart from NOAA ‘Climate at a Glance:’”
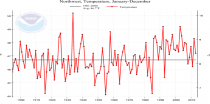
“Then a few years later I went back to get the latest version. Low and behold, NOAA had cooked the results:”
Actually, NOAA had cooled the past to create an upward trend and make the spike in 1934 slightly lower than the spike in 2015.
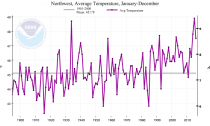
The version that I retrieved today appears to be just an updated version of the 2016 chart above, namely suspect:
-----------------
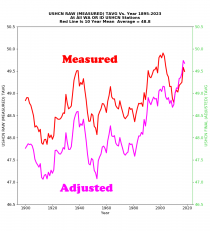
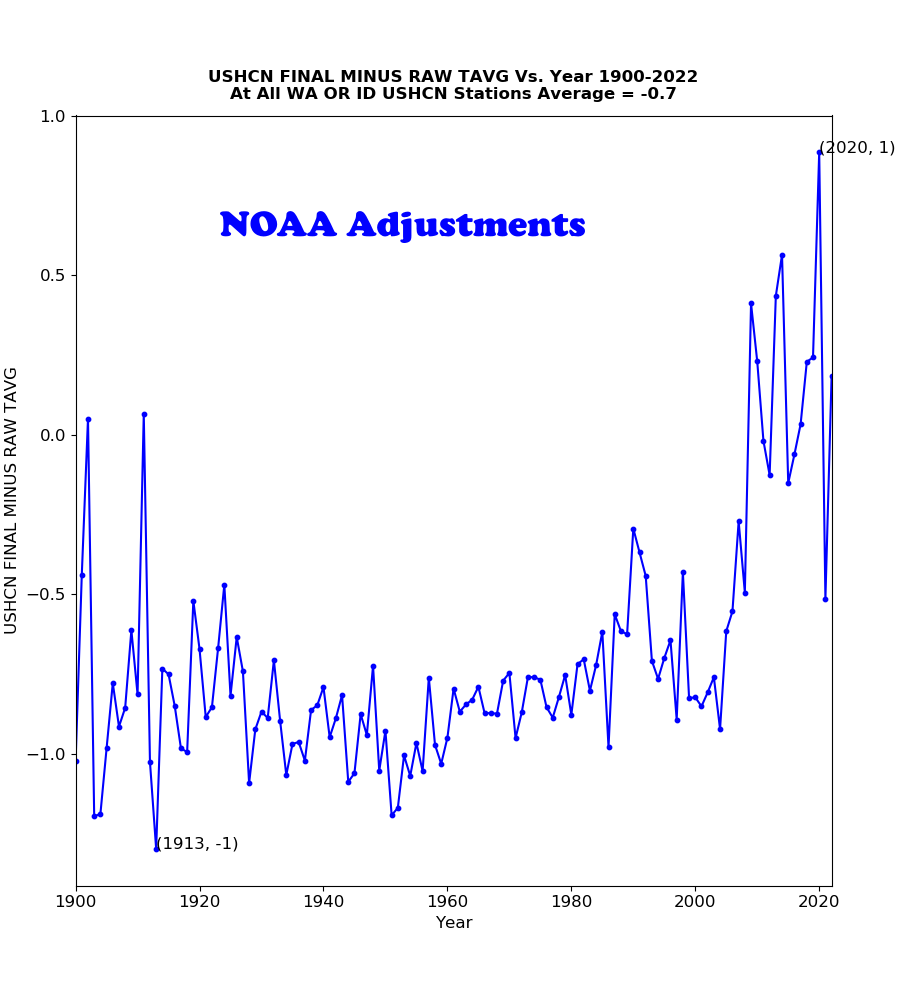
Tony Heller responds: “The reason for the change in graphs is that NOAA is now cooling Pacific Northwest temperatures prior to 2008 between 0.5 and 1.F, and warming recent temperatures by 0 to 0.5F”

The source for the two datasets can be found hereand here.
See a timetable of this and other adjustments made over time - all in the direction of the theory for political reasons here.