“The greatest enemy of knowledge is not ignorance, it is the illusion of knowledge.” Daniel J. Boorstin
CNS News Reporting More of Secretary of Flat Earth ..er...State John Kerry’s lies:

Secretary of State John Kerry told an audience in Mexico on Wednesday that temperatures in Europe and in Vietnam were “unprecedented” and broke “every record that’s ever been seen.” However, although it was hot that day, he was off the mark.
Speaking at an environmentally-friendly technology event in Mexico City, Kerry said he had just caught a CNN weather report in his hotel and “saw the temperatures around the world right now.”
“Thirty-four degrees centigrade [Celsius] in Vietnam today, in May. Twenty-nine, thirty, thirty-two, thirty-three in places all around Europe,” he said.
“Unprecedented. Breaks every record that’s ever been seen.” The hottest places in Europe in the heat of the day on Wednesday, according to weatheronline.co.uk included parts of Russia, Germany, central Italy and southern Turkey, all in the 29-32C (84-89F) range.
The highest temperature ever recorded in European Russia was 44C (111.2F) in 2010; in Germany was 40.2C (104.4F) in 1983 and 2003; in Italy was 48.5C (119.3F) in 1999; and in Turkey was 48.8C (119.8F) in 1993.
Kerry again dragged out the multi-falsified “97% of Scientist.” He calls us flat-earthers?
--------------
Another clueless local ‘Wiki’ expert who challenges anything posted questioning CAGW or the energy bind we are entering does a weekly letter to the editor, playing amateur climatologist. This was my response to him in a letter along side my regular bi-weekly column.
Temperature records are a far more complicated issue than you might ever imagine. I have been in the business for over 40 years. We use climate data every day. We have all the old data sets. We used them to correlate with factors like El Nino/La Nina, ocean and solar cycles, volcanism, and man’s effects like urbanization to make seasonal and longer-term forecasts for paying clients.
So we are very sensitive to changes in the data sets. One would think the old data was sacrosanct and remained the same but that is not the case by any means. Back in 1990, NOAA released its first US data set compilation, USHCN (US Historical Climate Network). It had adjustments for a factor, urbanization, that my early mentor and the father of climatology, Helmut Landsberg suggested was essential. We all know cities are warmer than rural areas at night as they tend to hold their heat.
Winds during the day mix the air and the difference becomes small. It was regarded in 1990 as the premium data set for the world. The global data was not adjusted for urban warmth because records about the location of the precise station locations (called metadata) were not available. In the late 1990s, after the super El Nino of 1998, while the global data was showing a century long warming as cities dominated, the US data had a sine wave with warming to 1940 cooling to 1978, warming to 1998 but no long term trend. However, the warming of the 1930s dominated. James Hansen of NASA (which uses NOAA data) said back then “The US has warmed during the last century but the warming hardly exceed natural variability. Indeed, the warmest decade was the 1930s and the warmest year 1934” (1.1F warmer than 1998).
When asked why the US was not warming, a note was made on the NASA site that the US was only 1.6% of the globe and regional variances were not unreasonable. But this inconvenient fact caused the politicians who hold the budgetary purse strings to urge the scientists to make the data sets more consistent. The obvious solution was to remove the US urban adjustment and do some blending (called homogenization), which they did in 2008. The claim was the blending would improve the urban issue, but in fact it did more to contaminate the more accurate rural data. They also, without any explanation cooled off the prior warm peak in the 1930s with every new version (we are now four versions later). 1998 is now 0.13F warmer that 1934.
This past winter as record cold dominated, another quick fix was implemented that resulted in a warming for the US and most states. Maine was an egregious example. The change in Maine’s temperature record from the dataset switch is dramatic. The data as of February showed a slight cooling trend of negative 0.03 degrees per decade since 1895. The new data set shows a substantial 0.23 degrees per decade warming. They cooled off the early 1900s for Maine by over 4F!!!
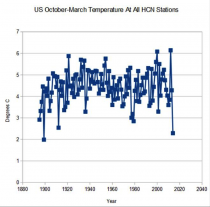
Fortunately we have the raw data set. It does not have the homogenization and other adjustments but is subject to urbanization warming. And here it shows the cold season from October to March was the coldest since 1911/12 - over a century ago. HCN stands for Historical Climate Network (1221 mostly stable stations with the longer histories).
Note the 60 year cycle that matches the ocean and solar cycles. These natural cycles suggest it is all downhill from here (a story for another day). There is no evidence of the linear warming from increasing CO2, the theory demands.
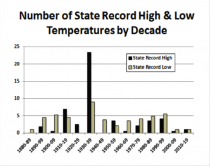
This next chart is from the nation’s foremost state climatologist (John Christy) and was used in the U.S. Senate and House testimony. The state record highs and lows are not altered because every TV station and forecast company and local NWS has them listed and mayhem would ensue if the record highs and lows were changing every year. The total number of 90F and 100F days has been declining since the 1930s. The all-time state records shows what we believe is the real temperature trends the past 120 years. 23 of the 50 record highs were set in the 1930s and 38 before 1960. There have been more record lows than highs since the 1940s. Our climate has been unusually benign in recent decades despite the hyping of extremes.

Enlarged


