

Heartland Institute
April 13, 2013)—A team of former and retired NASA scientists, engineers, and astronauts has released a detailed report claiming their former employer “is over-reacting to concerns about anthropogenic global warming” and “the threat of net harmful total global warming, if any, is not immediate and thus does not require swift corrective action.”
The group calls itself “The Right Climate Stuff.” Most are retired NASA Johnson Space Center employees who worked together on manned space projects since the early days of the Apollo Program. “Although climate science is not one of our technical specialties,” they write, “the required expertise in physics, chemistry, geology, meteorology, biology, data analysis and interpretation, and complex systems modeling, is similar to our collective academic training and experience gained through our typical 40 to 50 years of experience working in our nation’s space program.”
Read the report: “Anthropogenic Global Warming Science Assessment Report”
“At the crux of these differences in scientific opinion,” the NASA team writes, “is the extremely difficult task of separating atmospheric CO2 effects from poorly understood natural climate cycle effects, some with cycle periods that appear to last for hundreds or thousands of years.”
“This new report from The Climate Right Stuff merits close attention by everyone following the debate,” said Joseph Bast, president of The Heartland Institute, which has published extensively on the issue of global warming. “NASA’s own top experts, people who have played key roles in putting men on the moon, have studied the issue closely and concluded that there is no global warming crisis.”
“I’m not sure what else has to happen before people realize the threat of man-made global warming has been exaggerated,” Bast continued. “Some of these former astronauts are real heroes and distinguished scientists. What will it take to shake the almost-religious belief some people have in global warming?”
“Global warming alarmists may control the federal bureaucracy, but The Right Climate Stuff team of NASA scientists reveals of groundswell of skepticism inside NASA itself,” said James M. Taylor, senior fellow for environmental policy at The Heartland Institute. “These American heroes present a strong scientific case for climate realism. Humans are not causing a global warming crisis, and government programs to address the phantom global warming crisis are wasting precious resources that could be devoted to much more important uses.”
For more information about The Right Climate Stuff, go to www.therightclimatestuff.com. The full report can be found here and at PolicyBot.
Below, watch The Right Climate Stuff Team present its findings at The Heartland Institute’s Seventh International Conference on Climate Change on May 22, 2012. Panelists include Apollo 17 astronaut Harrison Schmitt, Apollo 7 astronaut Walter Cunningham, former NASA engineer Harold Doiron, and former NASA meteorologist Thomas Wysmuller.
Below, watch The Right Climate Stuff Team conduct a panel discussion at CPAC 2013 in Washington, DC on March 15, 2013. Panelists include Apollo 7 astronaut Walter Cunningham, former NASA engineer Harold Doiron, and former NASA meteorologist Thomas Wysmuller.
by Barry Brill
The planet is no longer warming. The brief warming episode of the late 20th century completed its course in the mid 1990s, and is now extinct. These are now uncontroversial statements.
They are based on hard data which has been available for many years on the websites of many official agencies. But somehow those agencies found ways to interpret the data differently, and to continually sidestep the elephant in the room.
The IPCC report of 2007 came and went, failing to detect or at least failing to acknowledge that global warming was no more. On the contrary, “it’s worse than we thought” was the rallying cry throughout the lead-up to the COP15 at Copenhagen.
But the prevarication couldn’t last forever. Three years ago, CRU’s Phil Jones admitted to the BBC that there had been no statistically significant warming since 1995.
The pace picked up when the UK Met Office models surreptitiously projected a 20-year standstill on Christmas Eve 2012; and then James Hansen oft described as the father of global warming confirmed “a pause” of a decade or more. Now the whole house of cards finally tumbled, with Rajendra Pachauri, official spokesman for the IPCC, confirming in Melbourne that global temperatures had plateaued for 17 years.
Will global warming ever start again? Nobody knows.
The long flat trend will of course be replaced by a new trend at some future point, but its eventual sign and slope are inscrutable. The as-yet-unidentified combination of forces driving the current standstill might break in any direction.
Some diehards contend that a 16-17 year plateau is too short a period to comprise a flat trend. But actions speak louder than words, and much shorter trends have been seen as decisive in the past.
The 1992 Rio Conference founded a major international treaty on a warming trend that was 12 years old. Hansen’s 1988 launch of the DAGW campaign was little more than a decade after scientists had feared the beginning of a new ice age.
It is widely acknowledged that 15+ years is ample to determine a trend:
* In 2008, the NOAA reported that 15 years of zero trends would invalidate the expected warming rate.
* On May 7, 2009, a leading climate modeler emailed colleagues: “the ‘no upward trend’ needs to continue for 15 years before we get worried”.
* In 2011, Dr Ben Santer averred that a ‘hiatus period’ of 17 years would be required to negate the ‘human fingerprint’ shown in climate models.
* Gavin Schmidt on RealClimate.com: “you can’t use short term (15 years or less) trends to prove that global warming has or has’’t stopped”.
Let us turn to the best practice manual for climatology, the “Guide to Climatologogical Practices” (3rd Edition) published by the World Meteorological Organisation in 2011. At 4.8.1 under the heading “Period of Calculation”:
“A number of studies have found that 30 years is not generally the optimal averaging period for normals used for prediction. The optimal period for temperatures is often substantially shorter than 30 years, but the optimal period for precipitation is often substantially greater than 30 years… In general the most recent 5 to 10 year period of record has as much predictive value as a 30-year record.”
Following Dr Pachauri’s admission, we can expect a spin barrage built on words like “hiatus”, “remission”, “lull”, “time-out”, “stalled” and “paused”.
The use of a term like “pause” is a blatant misuse of language. It relies upon an evidence-free prophesy that the deceased trend will some day be resurrected. It is no more than Freudian wish-fulfillment.
There have been three distinct warming episodes since the instrumental record began 1860 to 80,1912 to 40 and 1978 to 96 but nobody suggests that any of them were linked by a “pause”. Some historians argue that the two World Wars were a single event with a 21-year ‘intermission’, but few find this convincing.
The statistical fact is that the late 20th century warming trend is history. It is over. It is so yeterday. As Monty Python’s immortal “Dead Parrot” sketch illustrates so vividly, there is a vast gulf between “resting” and “dead”.
Hon Barry Brill OBE is a New Zealand barrister and solicitor. He is a former Minister of Science & Technology, and Minister of Energy, and is currently chairman of the New Zealand Climate Science Coalition
SPPI
Highlights of a new SPPI analysis, STORM TRENDS ACROSS THE NORTH ATLANTIC OCEAN:
One of the projected consequences of CO2-induced global warming is an increase in all types of extreme weather, including storms. A good test of the validity of this hypothesis comes from evaluating trends in storminess over the period of time when the Earth was recovering from the global chill of the Little Ice Age and transiting into the Current Warm Period, when the world’s climate alarmists contend the planet experienced a warming that was unprecedented over the prior one to two millennia. In the present section, these claims are evaluated as they pertain to storms over of the North Atlantic Ocean.
The global warming that occurred between 1951 and 2006 did not lead to an increasing trend in the extremeness of East Coast Winter Storms. There is little evidence that the mid- to late nineteenth century was less stormy than the present, and there is no sign of a sustained enhanced storminess signal associated with ‘global warming’.
Such a finding, in the words of the researchers, “lends a cautionary note to those who suggest that anthropogenic greenhouse warming probably results in enhanced extratropical storminess, as this is indicated neither by our own nor existing published observational results for the northeast Atlantic for the last ~150 years.”
It is clear that relative coolness, as opposed to relative warmth, typically leads to more extreme storms, which is just the opposite of what the world’s climate alarmists continue to contend. Given the findings noted by Trouet et al., as well as those reported by other researchers that are described in this summary and for this particular portion of the planet, it is clear that relative coolness, as opposed to relative warmth, typically leads to more extreme storms, which is just the opposite of what the world’s climate alarmists continue to contend.
By Paul Driessen
Big Wind hides evidence of turbine bird kills - and gets rewarded. Here’s how they do it.
Jim Wiegand
In 1984 the California Energy Commission said “many institutional, engineering, environmental and economic issues must be resolved before the industry is secure and its growth can be assured.” Though it was not clearly stated, the primary environmental issue alluded to was the extreme hazard that wind turbines posed to raptors.
Since the early 1980s, the industry has known there is no way its propeller-style turbines could ever be safe for raptors. With exposed blade tips spinning in open space at speeds up to 200 mph, it was impossible. Wind developers also knew they would have a public relations nightmare if people ever learned how many eagles are actually being cut in half or left with a smashed wing, to stumble around for days before dying.
To hide this awful truth, strict wind farm operating guidelines were established including high security, gag orders in leases and other agreements, and the prevention of accurate, meaningful mortality studies.
For the industry this business plan has succeeded quite well in keeping a lid on the mortality problem. While the public has some understanding that birds are killed by wind turbines, it doesn’t have a clue about the real mortality numbers. And the industry gets rewarded with subsidies, and immunity from endangered species and other wildlife laws.
Early studies identified the extent of the problem
To fully grasp the wind turbine mortality problem, one needs to examine the 2004 report from the Altamont Pass Wind Resource Area (APWRA). The study lasted five years (1998 to 2003), and researchers did not have full access to all the Altamont turbines.
This careful, honest effort analyzed turbine characteristics in relation to mortality and estimated mortality from body counts compiled in careful searches. Researchers then adjusted mortality numbers by examining statistical data based on searcher efficiency and other factors, such as carcass removal by predators and scavengers. The report even suggested that the mortality estimates probably erred on the low side, due to missed carcasses and other human errors.
This study stands in marked contrast to studies being conducted today, especially the Wildlife Reporting Response System that is currently the only analysis happening or permitted at most wind farms. The WRRS is the power companies’ own fatality reporting system, and allows paid personnel to collect and count carcasses. It explains why mortality numbers are always on the low side and why many high-profile species are disappearing near turbine installations.
Incredibly, the APWRA report actually admitted: “We found one raptor carcass buried under rocks and another stuffed in a ground squirrel burrow. One operator neglected to inform us when a golden eagle was removed as part of the WRRS. Based on these experiences, it is possible that we missed other carcasses that were removed.” (Chap. 3, pg. 52) It’s easy to see how human “errors” keep bird mortality low.
The APWRA study also documented that raptor food sources, turbine sizes and turbine placement all directly affect raptor mortality. It was thus able to identify many of the most dangerous turbines or groups of turbines, those with a history of killing golden eagles, kestrels, burrowing owls and red-tailed hawks.
Studies worsen as turbines proliferate and increase in size
The study also discussed how higher raptor mortality occurred when smaller towers were “upgraded” with larger turbines and proportionally longer blades. These wind turbines offered what raptors perceived as intermediate to very big windows of opportunity to fly through what looked like open spaces between towers, but were actually within the space occupied by much longer, rapidly moving rotor blades.
The result was significantly more fatalities of golden eagles, red-tailed hawks, American kestrels, burrowing owls, mallards, horned larks and western meadowlarks. Turbines with slower rotations per minute actually made it appear that there was more space and “greater windows of time.” This fooled birds, by giving them the illusion that they had open flight space between the rotating blades.
In fact, the illusion fools people, too. The newest turbines move their blades at 10-20 rotations per minute, which appears to be slow but for their blade tips this translates into 100-200 mph!
All this was very important, because the industry was moving away from smaller turbines and installing much larger turbines, with much longer blades. However, the industry not only ignored the APWRA findings and rapidly installed thousands of these much larger turbines across America, despite their far greater dangers for birds and raptors. It also kept the APWRA out of the public’s awareness, and focused attention on new study results that reflected far less accurate (and honest) searches and surveys.
How the wind industry hides raptor mortality
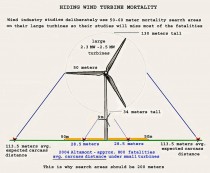
The APWRA report also looked at the placement of carcasses in relation to turbine types. It documented that the distances carcasses were found from turbine towers increased significantly as turbine megawatt ratings and blade lengths increased. Based on sample of about 800 carcasses, the report revealed that birds were found an average of 94 feet (28.5) meters from 100Kw turbines on towers 81 feet (24.6 meters) high.
Obviously, taller turbines with longer blades and faster blade tip speeds will catapult stricken birds much further. Figure 1 shows how a turbine 2.5 times larger will result in an average carcass distance of 372 feet (113.5 meters) from the tower. The wind industry is acutely aware of this.
That is why it has restricted search areas to 165 feet (50 meters) around its bigger turbines. This ensures that far fewer bodies will be found and turbine operators will not need to explain away as many carcasses.
Recent mortality studies like those conducted at the Wolfe Island wind project (2.3 MW turbines) and Criterion project in Maryland (2.5 MW turbines) should have used searches 655 feet (200 meters) from turbines, just to find the bulk (75-85%) of the fatalities. Of course, they did not do so. Instead, they restricted their searches to 165 feet ensuring that they missed most raptor carcasses, and could issue statements claiming that their turbines were having minimal or “acceptable” effects on bird populations.
Other methods and biased formulas allow the industry to exclude or explain away carcasses. The latest Altamont Pass studies found far more bird carcasses, but Altamont operators still claim mortality declines by using new adjustment formulas and other exclusionary factors. (Figure 2) For example, industry analysts:
- Exclude certain carcasses. The 2005-2010 WRRS data show that 347 carcasses (primarily raptors) plus 21 golden eagle carcasses were excluded from mortality estimates, because industry personnel claimed they were found outside standard search procedures, said the “cause of death was unknown” (even when the birds’ heads had been sliced off), or removed carcasses ahead of a scheduled search.
- Exclude mortally wounded or crippled birds found during searches, even if they display turbine-related injuries. Even though many birds hit by turbine blades die within days, if they are still breathing when found, they are considered mobile and thus not fatalities.
- Simply avoid searching near some of the most dangerous and lethal turbines. The industry justifies this exclusion by claiming that “the number of turbines monitored was reduced and spatially balanced for a randomized rolling panel design.” That this “reduction and balancing” excluded the most deadly portion of the Altamont facility was presented as coincidental or part of a proper scientific methodology.
The cold reality is that honest, scientific, accurate mortality studies in the Altamont Pass area would result in death tolls that would shock Americans. They would also raise serious questions about wind turbines throughout the United States, especially in major bird habitats like Oregon’s Shepherds Flat wind facility and the whooping cranes’ migratory corridor from Alberta, Canada to Texas.
The techniques discussed here help ensure that “monitoring” studies match the facility operators’ desired conclusions, and mortality figures are kept at “acceptable” levels.
The bird mortality disaster must no longer be hidden
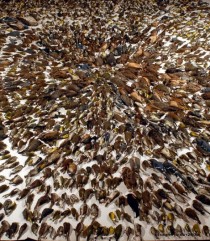
Not only has the wind industry never solved its environmental problem. It has been hiding at least 90% of this slaughter for decades. In fact, the universal problem of hiding bird (and bat) mortality goes from bad to intolerable beyond the Altamont Pass boundaries, because studies in other areas across North America are far less rigorous, or even nonexistent, and many new turbines are sited in prime bird and bat habitats.
The real death toll, as reported by Paul Driessen and others, is thousands of raptors a year and up to 39 million birds and bats of all species annually in the United States alone, year after year! This is intolerable, and unsustainable. It is leading to the inevitable extinction of many species, at least in many habitats, and perhaps in the entire Lower 48 States.
Meanwhile, assorted “experts” continue to insist that the greatest threats to golden eagles are other factors like hikers getting too close to their nests, even when most abandoned nests in Southern California are nowhere near any hiking trails and wind turbines continue to slaughter eagles.
It is essential that people realize that no energy source comes anywhere close to killing as many raptors as wind energy does. No other energy companies are allowed to pick up bodies of rare and protected species from around their production sites on a day-to-day basis, year-in and year-out. No other energy producer has a several thousand mile mortality foot print (the highly endangered whooping cranes’ migratory corridor), like what wind energy has.
Once people understand all of this, they will rightfully demand that the wind industry obey the same environmental rules that all other industries must follow. This will require that wind turbines be sited only where the risk of bird deaths is minimal to zero; that turbines be replaced with new designs that birds recognize as obstacles and thus avoid; that fines be levied for every bird death, as is done with other industries; and that industrial wind facilities not be permitted where these requirements cannot be met.
America’s wildlife, and proper application of our environmental laws, require nothing less.
Jim Wiegand is an independent wildlife expert with decades of field observations and analytical work. He is vice president of the US region of Save the Eagles International, an organization devoted to researching, protecting and preserving avian species threatened by human encroachment and development.

Spectator Blog
Sir Paul Nurse, the Nobel laureate and President of the Royal Society, has been hitting out at global warming sceptics. In a speech to the University of Melbourne recently, he attacked dissenters from the climate change orthodoxy, declaring that their objections were in reality political rather than scientific:

‘A feature of [the global warming] controversy is that those that deny there is a problem often seem to have political or ideological views that lead them to be unhappy with the actions that would be necessary should global warming be due to human activity. I think that’s a crucial point. Because these actions that are likely to include measures which include concerted world action, curtailing the freedom of individuals or companies or nations, and curbing some kinds of industrial activity.’
It may have escaped Nurse-s attention, but the vast majority of scientists calling for concerted action on climate change are vehemently and often outspokenly left-wing some have even publicly admitted to lying to promote political action. It therefore seems a little odd for Nurse to accuse only those who dispute the official story of having political motivations.
The explanation for this short-sightedness may lie in his own politics: Nurse is a lifelong socialist who used to fill his leisure hours selling Socialist Worker on street corners. But it is also possible to confirm that Nurse’s political prejudices are getting the better of him by analysing the quotation above.
Nurse’s argument that restrictions on individual freedom are required to avert global warming has its roots in demands for immediate and sweeping reductions in carbon emissions, a case which in turn is usually justified by reference to the Stern Review of the economics of climate change. However, as all global warming sceptics (but perhaps few Nobel laureates) know Stern’s conclusions depend on making extreme and highly controversial assumptions about how we balance the rights of current and future generations.
Stern has declared that his assumptions are necessary on ethical grounds, arguing that they prevent people alive today from passing on costs to future generations. However, as the eminent economist William Nordhaus has pointed out, Stern’s approach is not the only one that could be adopted. For example, since even under Stern’s calculus people in the future will be much richer than those alive today, we could aim to maximise benefits to the poorest generation, namely us. In this view, passing costs on is the correct thing to do and we should be aiming to reduce, not raise the price of fossil fuels.
When one understands the ‘ethical’ choice that Stern made, it is easy to see that immediate cuts in carbon emissions, brought about by ‘curtailing the freedom of individuals or companies or nations, and curbing some kinds of industrial activity’ are not necessary at all. They are simply Nurse’s ethical, philosophical and political preferences. And they are ugly ones at that.
By Paul Homewood
The prospect of low lying islands in the Pacific disappearing under the waves is enough to get greenies wetting their knickers and Ed “Dopey” Davey, the UK Energy Secretary, putting his hands in our pockets to give billions away to the Maldives and the rest.
Of course, we already know that the Maldive government itself does not believe any of this rubbish. That’s why they are building new airports and tourist developments, as if they were going out of fashion!
But what do the proper scientists think, as opposed to the discredited rent seeking variety?
A new study by EC Rankey, “Nature and stability of atoll island shorelines: Gilbert Island chain, Kiribaati, Equatorial Pacific” , takes a close look at the issue.
In a study that integrated field observations, differential global positioning system data, historical aerial photographs and ultra-high resolution remote sensing images that examined the nature, spatial patterns and rates-of-change of the shorelines of 17 islands on the Maiana and Aranuka atolls of Kiribati’s Gilbert Island chain, Rankey (2011) obtained a wealth of data that come to bear on this important question. And the conclusions he derives from that information are vastly different from the data-sparse contentions of the world’s climate alarmists.
Rankey found, for example, that short-term (four-year) rates of shoreline changes can indeed be dramatic, with significant intrusion of seawater over sloping shores. However, much longer (forty-year) rates of change are much smaller; and not all of his analyses depict shrinking dry-land surfaces, as some of the studied islands have actually been accruing above-water area. And so it is that he forthrightly and correctly states that “the atoll islands are not washing away.”
Similar island surface responses have been found by Webb and Kench (2010), who studied 27 other atoll islands in the central Pacific, using historical aerial photography and satellite images over periods ranging from 19 to 61 years, during which time interval they say that instrumental records indicated a rate of sea-level rise of 2.0 mm per year in the central Pacific. Yet in spite of this sea level rise, they too found “no evidence of large-scale reduction in island area,” noting that the islands “have predominantly been persistent or expanded in area on atoll rims for the past 20 to 60 years,” adding that 43% of the islands “increased in area by more than 3% with the largest increases of 30% on Betio (Tarawa atoll) and 28.3% on Funamanu (Funafuti atoll).”
Years earlier, Connell (2003) had also found no evidence for the oft-repeated island doomsday claims, demonstrating the great importance of real-world data as opposed to climate model simulations when it comes to considering the current and future status of the Earth’s many islands. And so it is that Rankey concludes his analysis by counselling that “solutions must consider the natural complexity of these [island] systems, rather than advocate overly simplistic notions of the causes of, and the solutions to, coastal change.”
It looks like the Maldives can carry on building their new airports after all!
By James Taylor
President Barack Obama in his second inauguration address called for new action to “respond to the threat of climate change.” Taking advantage of the bully pulpit and a huge national audience, Obama mustered his best possible arguments in a brief case for why addressing global warming is supposedly necessary.
Unfortunately for global warming alarmists, Obama’s case was exceptionally flimsy. Then again, Obama did not have much to work with, as the overall case for global warming alarmism is exceptionally flimsy.
Obama presented his argument as follows: “Some may still deny the overwhelming judgment of science, but none can avoid the devastating impact of raging fires, and crippling drought, and more powerful storms.”
Given a fresh canvas on which to work, Obama sought the most compelling examples of an asserted global warming crisis. He chose wildfires, drought and powerful storms. At the same time, he urged us to defer to the “overwhelming judgment of science” on these matters.
President Obama, I agree we should strongly consider the overwhelming judgment of science. Let’s apply the overwhelming judgment of science to your three cherry-picked examples and see what the science reveals.
Leading off the Obama “Big Three” is wildfires. What does the overwhelming judgment of science reveal?
The National Interagency Fire Center reports the number of annual wildfires in the United States has been declining for more than 30 years. In fact, the “overwhelming judgment of science” reveals the number of wildfires rose from the 1950s through the 1970s, as global temperatures declined, and has been declining ever since, as global temperatures have modestly warmed.
The really interesting part about wildfires in the United States is a recent increase in the number of acres burned per wildfire after the federal government reversed a decades-long policy of putting out as many wildfires as quickly as possible. In the 1990s, environmentalists and federal forest officials reported forests had become overgrown as a result of firefighters putting out too many natural fires too quickly. Since then, firefighters are responding to fewer forest fires and letting more acres burn. As a result, even though wildfires occur less frequently as our planet warms and as soil moisture improves (more on that coming right up), our global warming Alarmist in Chief presents the misleading assertion that global warming rather than a change in federal wildfire policy is causing a recent increase in acres burned due to wildfires.
Next in Obama’s “Big Three” of asserted global warming crises is drought. What does the “overwhelming judgment of science” reveal?
U.S. and global soil moisture improved throughout the 20th century as our planet warmed in its recovery from the Little Ice Age. According to the Global Soil Moisture Data Bank, global soil moisture increased throughout the 20th century at almost all sites. Moreover, the National Oceanic and Atmospheric Administration (NOAA) reports that 20th century droughts were quite mild when compared to droughts in previous centuries. This “overwhelming scientific judgment of science” was confirmed in November when a study published in the peer-reviewed journal Nature found “there has been little change in drought over the past 60 years.”
Finally, the President asserts that global warming is causing more powerful storms. This assertion is particularly fictitious. NOAA reports a long-term decline in strong tornadoes striking the United States. The National Hurricane Center reports that the past 40 years have seen the fewest major hurricane strikes since at least the mid-1800s. Even Hurricane Sandy reminds us that the U.S. Northeast has experienced only one major hurricane strike since 1960, but experienced six major hurricane strikes during the 1930s, 1940s, and 1950s, when global temperatures were cooler.
Clearly, the “overwhelming judgment of science” contradicts President Obama and global warming alarmists. This is a good thing.
Now let’s play a game of “pretend.”
Let’s pretend that none of the overwhelming scientific evidence presented above actually existed. Let’s pretend that science supported rather than contradicted President Obama’s assertions. The question is, what would Obama have us do to solve the problem?
Obama’s solution is to impose still more economy-killing carbon dioxide restrictions on the U.S. economy. This makes about as much sense as losing your car keys in Boston but insisting on searching for them in Los Angeles.
True, global carbon dioxide emissions have risen more than 33 percent since the year 2000. However, U.S. carbon dioxide emissions have declined during that time and will continue to decline for the foreseeable future.
The U.S. Energy Information Administration reports that during 2012 alone, U.S. carbon dioxide emissions declined by 8 percent compared to 2011.
China by far emits more carbon dioxide than any other nation and Chinese emissions are growing rapidly. China alone accounts for 75 percent of the global increase in carbon dioxide emissions since 2000. If the United States completely eliminated all of its carbon dioxide emissions today (something that is impossible to do), the only thing we would accomplish would be to delay by about five years an equal increase in Chinese emissions. And China has repeatedly and emphatically insisted it will not agree to any restrictions on its carbon dioxide emissions.
Thankfully, President Obama, the “overwhelming judgment of science” shows the asserted global warming crisis exists solely in the minds of global warming alarmists.
Posted on 22 January 2013 by Briggs
Was it only me? I thought Chicken Little dead. After all, when was the last time we heard competent authority shouting “Only the government can stop the sky from falling!”? But there he was yesterday, singing his old song, and from the highest perch in the land.

Since the subject has come up, even though it pains to do so, we have to talk about it. Hence this modified and expanded repost. I’ll also have more in the near future.
Mind! Global warming can be dangerous. But, so far as we know, only politically and financially. Why, your own author lost jobs (and more) because of global warming. So unless you have balls of steel, as I do, beware what you say on this topic. This post originally ran 1 December 2009.
Why are you so scared about global warming? Why do you believe things are as bad as they are? Why is it you feel that the world is coming to an end unless we do something?
Unless you are an actual, God loveyou, bona fide climatologist, it is difficult to see how anybody could raise an interest in the state of the climate given the actual, direct evidence we have for dangerous man-made global warming. But it’s clear our National Nervousness Index is peaking. Why is that?
Chances are, that if you are worked up, it is because you are mistaken. If you are like most people, and most people are, then you have inappropriately thought that certain evidence implied the truth of dangerous man-made global warming (or AGW, for short) whereas it actually does not. You are therefore unnecessarily worried.
Here, then, is a brief FAQ which you can cut and paste on your energy efficient refrigerator, or pass out to “activist” friends.
The Earth’s climate has never been static It has always changed. And nobody - not a soul - knows what an ideal climate is. How can you say it will be bad if you don’t know what is good?
AGW is not the only theory of climate change Something caused climate the change, but it may not have been AGW. There are many rival theories, but you have never heard of them. One, or even none, of them might instead be true and could be useful in predicting future climates.
The accuracy of historical temperatures is questionable and is in flux We do not have direct measurements for most of the Earth’s history, and have to rely on statistics, God help us! to impute the missing records. The records used to compute past temperatures are ever changing, too; thus, so are the imputations. This process is fraught with error and uncertainty, uncertainty which is rarely or never carried through climate analyses, meaning we are too sure of the results.
Historical temperature changes are not good evidence of AGW Because it was cooler, or hotter, in the past is not complete evidence that AGW is true. All historical temperature observations are consistent with all known rival climate change theories. Past temperatures are, at best, indirect evidence for many different climate change theories, and not just AGW.
Statements of what happens when it is hot outside are not evidence that AGW is true If you heard that a glacier melted when it was exposed to hot air, you have learned what you already knew: ice melts when it is hot. Absolutely no observation of any plant, mineral, or animal is direct evidence of AGW. Thus, every horror story you have heard about small fish whose native waters got uncomfortably warm, about a species of grass that was stressed under the harsh sun, are not direct evidence that AGW is true. They are only statements of what happens when it gets hot out or when it rains or fails to.
Every statement about what might happen if AGW were true is worthless as evidence for AGW Horror stories about the evil, wretched future that awaits us once the “tipping point” has been breached are not evidence for AGW. The statements are empty of any kind of proof. “Studies” that claim future awfulness due to AGW are inappropriately and disingenuously used to hint that AGW is true. This naughty behavior is equivalent to the Tokyo scientist who solicits his government for a Godzilla “studies” grant because of the havoc the nuclear-fire breather could cause if he were real. That his grant is awarded is not evidence of Godzilla’s existence. Nor are the string of papers published on crushed bodies, burnt cities, and the like evidence for Godzilla’s existence.
The best indirect evidence for AGW is the fit of climate models to historical data AGW climate models can reproduce some of the historical data in some regions fairly well, but only in a statistical sense; they cannot fit data in all times or areas. However, many of those rival climate change theories fit the historical data equally well. Thus, the ability to reproduce historical data to an arbitrary level of goodness is not especially strong evidence in favor of AGW.
There does not exist good direct evidence for the truth of AGW The only possible direct evidence would be if the AGW models skillfully predicted future climate data (skill means an improvement over a naive forecast such as persistence or rival theory). These skillful predictions would tell us that the theory underlying the models is likely to be true. AGW climate models do not skillfully predict new data. A forecast of doom is not proof of doom.
The level of uncertainty in horrors caused by AGW is higher than thought A scientist writes a paper which states a horror is likely but not certain to occur if AGW is true and if a string of other conditions are met. This announcement is falsely taken as direct proof the horror will certainly occur. But the chance that the horror and AGW are both true and the string of conditions are true is necessarily less. Exaggerated example: it is 60% likely bee stings will increase if AGW true. But there is only (say) 10% chance AGW true. Therefore, there is only 60% x 10% = 6% chance we will see increased bee stings in the presence of AGW.
The bandwagon effect is strong Isn’t it odd that researchers predict that warm, fuzzy, cuddly, photogenic species all face extinction risk if AGW is true, but they also say that species that bite, stick, pester, and plague will thrive if AGW is true?