

By Steve Goreham
Originally published in Communities Digital News. Reprinted with author Permission.
Americans take electricity for granted. Electricity powers our lights, our computers, our offices, and our industries. But misguided environmental policies are eroding the reliability of our power system.
Last winter, bitterly cold weather placed massive stress on the US electrical system-and the system almost broke. On January 7 in the midst of the polar vortex, PJM Interconnection, the Regional Transmission Organization serving the heart of America from New Jersey to Illinois, experienced a new all-time peak winter load of almost 142,000 megawatts.
Eight of the top ten of PJM’s all-time winter peaks occurred in January 2014. Heroic efforts by grid operators saved large parts of the nation’s heartland from blackouts during record-cold temperature days. Nicholas Akins, CEO of American Electric Power, stated in Congressional testimony, “This country did not just dodge a bullet - we dodged a cannon ball.”
Environmental policies established by Congress and the Environmental Protection Agency (EPA) are moving us toward electrical grid failure. The capacity reserve margin for hot or cold weather events is shrinking in many regions. According to Philip Moeller, Commissioner of the Federal Energy Regulatory Commission, “...the experience of this past winter indicates that the power grid is now already at the limit.”
EPA policies, such as the Mercury and Air Toxics rule and the Section 316 Cooling Water Rule, are forcing the closure of many coal-fired plants, which provided 39 percent of US electricity last year. American Electric Power, a provider of about ten percent of the electricity to eastern states, will close almost one-quarter of the firm’s coal-fired generating plants in the next fourteen months. Eighty-nine percent of the power scheduled for closure was needed to meet electricity demand in January. Not all of this capacity has replacement plans.
In addition to shrinking reserve margin, electricity prices are becoming less stable. Natural gas-fired plants are replacing many of the closing coal-fired facilities. Gas powered 27 percent of US electricity in 2013, up from 18 percent a decade earlier. When natural gas is plentiful, its price is competitive with that of coal fuel.
But natural gas is not stored on plant sites like coal. When electrical and heating demand spiked in January, gas was in short supply. Gas prices soared by a factor of twenty, from $5 per million BTU to over $100 per million BTU. Consumers were subsequently shocked by utility bills several times higher than in previous winters.
On top of existing regulations, the EPA is pushing for carbon dioxide emissions standards for power plants, as part of the “fight” against human-caused climate change. If enacted, these new regulations will force coal-fired plants to either close or add expensive carbon capture and storage technology. This EPA crusade against global warming continues even though last winter was the coldest US winter since 1911-1912.
Nuclear generating facilities are also under attack. Many of the 100 nuclear power plants that provided 20 percent of US electricity for decades can no longer be operated profitably. Exelon’s six nuclear power plants in Illinois have operated at a loss for the last six years and are now candidates for closure.
What industry pays customers to take its product? The answer is the US wind industry. Wind-generated electricity is typically bid in electrical wholesale markets at negative prices. But how can wind systems operate at negative prices?
_thumb.jpeg)
The answer is that the vast majority of US wind systems receive a federal production tax credit (PTC) of up to 2.2 cents per kilowatt-hour for produced electricity. Some states add an addition credit, such as Iowa, which provides a corporate tax credit of 1.5 cents per kw-hr. So wind operators can supply electricity at a pre-tax price of a negative 3 or 4 cents per kw-hr and still make an after-tax profit from subsidies, courtesy of the taxpayer.
As wind-generated electricity has grown, the frequency of negative electricity pricing has grown. When demand is low, such as in the morning, wholesale electricity prices sometimes move negative. In the past, negative market prices have provided a signal to generating systems to reduce output.
But wind systems ignore the signal and continue to generate electricity to earn the PTC, distorting wholesale electricity markets. Negative pricing by wind operators and low natural gas prices have pushed nuclear plants into operating losses. Yet, Congress is currently considering whether to again extend the destructive PTC subsidy.
Capacity shortages are beginning to appear. A reserve margin deficit of two gigawatts is projected for the summer of 2016 for the Midcontinent Independent System Operator (MISO), serving the Northern Plains states. Reserve shortages are also projected for the Electric Reliability Council of Texas (ERCOT) by as early as this summer.
The United States has the finest electricity system in the world, with prices one-half those of Europe. But this system is under attack from foolish energy policies. Coal-fired power plants are closing, unable to meet EPA environmental guidelines. Nuclear plants are aging and beset by mounting losses, driven by negative pricing from subsidized wind systems. Without a return to sensible energy policies, prepare for higher prices and electrical grid failures.
Steve Goreham is Executive Director of the Climate Science Coalition of America and author of the book The Mad, Mad, Mad World of Climatism: Mankind and Climate Change Mania.
Anthony Watts
This sentence…
“One of the panel’s most striking new conclusions is that rising temperatures are already depressing crop yields, including those of corn and wheat. In the coming decades, farmers may not be able to grow enough food to meet the demands of the world’s growing population, it warns.”
...is in this LA Times story by by Tony Barboza about the latest IPCC report which has so much gloom and doom in it, one of the lead authors, Dr. Richard Tol, asked his name to be taken off of it for that very reason.
Problem is, the agricultural data doesn’t match the LATimes/IPCC claim, see for yourself:
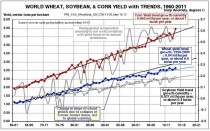
Wheat-corn-soybeans-yield-trends
Source: USDA data at http://apps.fas.usda.gov/psdonline/ plotted by Dr. Roy Spencer.
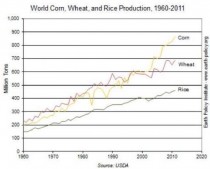
Not only is the LATimes/IPCC claim about agriculture false for the world, but also the USA:
US_ag-trends
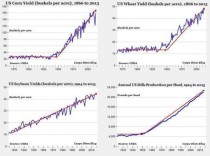
Source: USDA Data here compiled by Dr. Mark J. Perry, economist at the University of Michigan.
In fact, U.S. Corn Yields Have Increased Six Times Since the 1930s and Are Estimated to Double By 2030 according to Perry.
Note that temperatures in the US Corn belt aren’t rising, but models are, and as we know, the IPCC prefers model output over reality.
USHCN_corn_belt_temperatures
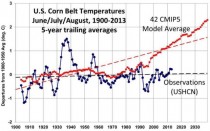
Source: USHCN data
from NOAA, CMIP5 model data plotted by Dr. Roy Spencer
Why is it that checking such simple facts are left to bloggers and independent thinkers like Roy Spencer, instead of “professional” journalists like Tony Barboza?
Maybe he’s just too lazy to check facts like this? Or, is it belief mixed with incompetence?
Icecap Note: CO2 is clearly a plant fertilizer that with water fed nutrients and sunlight creates photosynthesis. It enhance canopy growth shading the sub soil from desiccating sunlight and reducing water need. CO2Science reported on a studyThe two researchers with the USDA’s Agricultural Research Service—who hold joint appointments in the Agronomy Department of the University of Florida (USA)—grew two cultivars of sugarcane (Saccharum officinarum) for a period of three months in paired-companion, temperature-gradient, sunlit greenhouses under daytime CO2 concentrations of 360 and 720 ppm and air temperatures of 1.5C (near ambient) and 6.0C higher than outside ambient temperature, after which they measured a number of different plant properties.
“On a main stem basis,” in the words of Vu and Allen, “leaf area, leaf dry weight, stem dry weight and stem juice volume were increased by growth at doubled CO2 [as well as at] high temperature,” and they say that these increases were even greater under the combination of doubled CO2/high temperature, with plants grown under what climate alarmists would call these extreme conditions averaging “50%, 26%, 84% and 124% greater leaf area, leaf dry weight, stem dry weight and stem juice volume, respectively, compared with plants grown at [the] ambient CO2/near-ambient temperature combination.” In addition, they say that “plants grown at [the] doubled CO2/high temperature combination were 2- to 3-fold higher in stem soluble solids than those at [the] ambient CO2/near-ambient temperature combination.”
Consequently, as Vu and Allen conclude—based on their research and that of many other scientists—“sugarcane grown under predicted rising atmospheric CO2 and temperature in the future may use less water, utilize water more efficiently, and would perform better in sucrose production,” which bodes well indeed for tropical-region agriculture, especially, as they note, “with the worldwide continued increase in demand for sugarcane as a source of food and biofuel.”
Reference:Vu, J.C.V. and Allen Jr., L.H. 2009. Stem juice production of the C4 sugarcane (Saccharum officinarum) is enhanced by growth at double-ambient CO2 and high temperature. Journal of Plant Physiology 166: 1141-1151.
Hockey Schtick
A paper published today in the Journal of Climate finds, contrary to popular belief, that US “monthly maximum temperatures are not often greatly changing - perhaps surprisingly, there are many stations that show some cooling [over the past century]. In contrast, the minimum temperatures show significant warming. Overall, the Southeastern United States shows the least warming (even some cooling), and the Western United States, Northern Midwest, and New England have experienced the most warming.”
In essence, this paper is saying the weather/climate has become less extreme, with little to no change in maximum temperatures “and even some cooling” of maximum temperatures in some stations, and warming of minimum temperatures. Thus the temperature range between minimum and maximum temperatures has decreased, a less extreme, more benign climate.
According to the paper, the warming in minimum temperatures is regional, with the SE US showing “the least warming (even some cooling),” suggesting that other processes such as ocean and atmospheric oscillations are responsible, rather than a uniform warming from AGW.
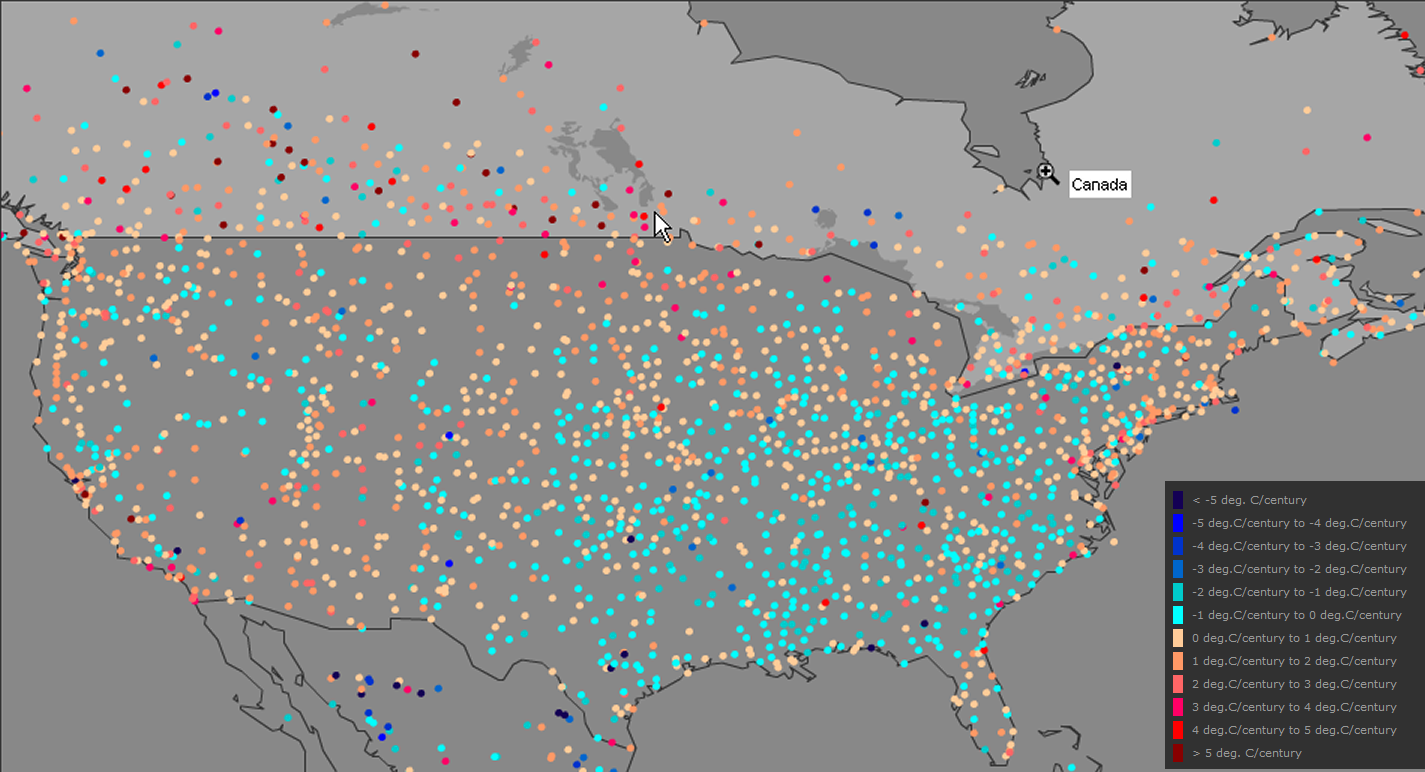
Note these results are after the huge up-justments made to the US temperature data and urban heat island [UHI] artificial warming, which could account for all or most of the warming of minimum temperatures.
UPDATE: Graph from Verity Jones from the cross-post at WUWT showing cooling stations in blue/green in not only the SE US, but nationwide:

Journal of Climate 2014 ; e-View
doi: http://dx.doi.org/10.1175/JCLI-D-13-00283.1
Trends in Extreme United States Temperatures
Jaechoul Lee*
Department of Mathematics, Boise State University, Boise, Idaho
Shanghong Li and Robert Lund
Department of Mathematical Sciences, Clemson University, Clemson, South Carolina
Abstract
This paper develops trend estimation techniques for monthly maximum and minimum temperature time series observed in the conterminous 48 United States over the last century. While most scientists concur that this region has warmed on aggregate, there is no a priori reason to believe that temporal trends in extremes and averages will exhibit the same patterns. Indeed, under minor regularity conditions, the sample partial sum and maximum of stationary time series are asymptotically independent (statistically). Previous authors have suggested that minimum temperatures are warming faster than maximum temperatures in the United States; such an aspect can be investigated via our methods. Here, statistical models with extreme value and changepoint features are used to estimate trends and their standard errors. A spatial smoothing is then done to extract general structure. The results show that monthly maximum temperatures are not often greatly changing, perhaps surprisingly, there are many stations that show some cooling. In contrast, the minimum temperatures show significant warming. Overall, the Southeastern United States shows the least warming (even some cooling), and the Western United States, Northern Midwest, and New England have experienced the most warming.
By: David Archibald
The following has been excerpted from Twilight of Abundance: Why Life in the 21st Century will be Nasty, Brutish, and Short by David Archibald:
The United States is needlessly penalizing itself and squandering its resource endowment, all because of the big lie that carbon dioxide is causing dangerous global warming. The Chinese, in contrast, merely pay lip service to that big lie. The only reason they are making a token effort on the “global warming” front is to encourage Western countries to continue hobbling their own economies. One can be forgiven for thinking that there must be some truth in the global warming notion given how much noise its advocates have made. But as with most causes promoted by leftist ideologues, the truth is exactly the opposite to their claim. The fact of the matter is the carbon dioxide level of the atmosphere remains dangerously low at four hundred parts per million. In fact the more carbon dioxide there is in the atmosphere, the better for all forms of life on planet Earth.
Before the Industrial Revolution, carbon dioxide in the atmosphere stood at 286 parts per million. Let us round this number to 300 parts per million to make the sums easier. Naturally occurring greenhouse gases ensure that the planet is 30C warmer than it would otherwise be if they were not in the atmosphere, so the average temperature of the planet’s surface is 15C instead of -15C. Water vapor is responsible for 80 percent of that effect, and carbon dioxide for only 10 percent, with methane, ozone, and so forth accounting for the remainder. So the approximately 300 parts per million of carbon dioxide is good for 3C degrees of warming. If the relationship between carbon dioxide concentration and temperature were arithmetic - in other words, a straight linear relationship - then adding another 100 parts per million of carbon dioxide would result in one degree of warming. We are adding 2 parts per million to the atmosphere annually, or 100 parts per million every fifty years. At that rate, humanity would fry.
Thankfully, the relationship between atmospheric carbon dioxide and temperature is logarithmic, not arithmetic.The first 20 parts per million of carbon dioxide in the atmosphere provides 1.6C of warming, after which the effect drops away rapidly. From the current level of 400 parts per million, each addition of 100 parts per million adds only 0.1C of warming. By the time we have dug up all the rocks we can economically burn, and burned them, we may reach 600 parts per million in the atmosphere. So perhaps we might add another 0.2C of warming over the next two centuries. That warming will be lost in the noise of natural climate variation. So much for the problem of global warming! As a greenhouse gas, carbon dioxide is tuckered out. On the positive side of the ledger, it is very beneficial as aerial fertilizer. The carbon dioxide that mankind has put into the atmosphere to date has in fact boosted crop yields by 15 percent. This is like giving the Third World countries free phosphate fertilizer. Who could possibly be so heartless as to deny under- developed countries that benefit, at no cost to anyone?
The real threat is dangerously low levels of carbon dioxide in the atmosphere. The Earth has been in a glacial period for the last 3 million years, including some sixty separate glacial advances and retreats. The current Holocene interglacial period might last up to another 3,000 years before the Earth plunges into another glaciation. Carbon dioxide is a gas highly soluble in water, and its solubility is highly temperature dependent. The colder the planet is, the more carbon dioxide the oceans absorb. During glaciations the carbon dioxide level in the atmosphere has fallen to as low at 180 parts per million. It needs to be stressed that plant life shuts down at 150 parts per million, as plants are unable to operate with the partial pressure differential of carbon dioxide between their cells and the atmosphere. Several times during the last 3 million years, life above sea level was within 30 parts per million of being extinguished by a lack of carbon dioxide. The flowering plants we rely upon in our diet evolved 100 million years ago when the carbon dioxide level was four times the current concentration. For plant life, the current amount of carbon dioxide in the atmosphere is near starvation levels
And unfortunately, the carbon dioxide that human beings are pumping into the atmosphere will not be there for very long. There is fifty times as much carbon dioxide held by the oceans as there is in the atmosphere. As the deep oceans turn over, on an eight-hundred-year cycle of circulation, they will take the carbon dioxide now in the atmosphere down into Davy Jones’s Locker, where it will be of no use to man, beast, or plant life. Agricultural productivity will rise for the next two centuries or so, along with the atmospheric carbon dioxide level, after which it will fall away. By the year 3000 AD, the atmosphere’s carbon dioxide level will be only a couple of percent higher than before the Industrial Revolution. Life above sea level will therefore remain dangerously precarious because of the low carbon dioxide level.
“Global warming” is an irrational belief whose proponents demonstrate no interest in examining scientific evidence that may prove their beliefs incorrect. As a simple cult, it has failed to progress much beyond the concept of original sin, apocalyptic visions, sumptuary laws, and the selling of indulgences. Wind farms are the temples of this state-sponsored belief system. This cult doesn’t extend to building aged-care homes, hospitals, or anything much for the common good. Instead it degrades the fabric of society by misdirecting human effort. Its true believers can hardly be blamed; the global warming cult is not much different from any of the other end-of-the-world cults that have preceded it. Society’s opprobrium should be saved for the gatekeepers who have failed in their duty to protect the public from the depredations of the global warming rent-seekers and charlatans. The boards and executive staffs of a number of learned societies across the Western world have embraced this cult against the wishes of the majority of their members.
The fact that the world has not warmed since 1998 (in defiance of the global warming scare) hasn’t dented cult members’ faith. Arguing scientific evidence with them is pointless. It will take something far worse than a return of the frigid winters of the 1970s to create doubt in their minds. That something worse is coming. Millions of people may have to endure many harsh years before this pernicious cult is vanquished. And until the global warming myth is exploded, the security of the United States and thus of the world is also at risk.
David Archibald is a climate expert and a fellow at the Institute of World Politics.
Dr. Charles Battig
"Monty Python” did not foresee the current, catastrophic man-made global warming/climate change hoax. The group did, however, have a firm grasp of everyday absurdities. Their 1969 “Dead Parrot Sketch” depicts two completely different viewpoints of the reality of a dead “Norwegian Blue” parrot. The parrot is quite dead to any objective outside observer. The pet shop owner is unwilling to accept this reality, and he contrives a variety of absurd excuses to explain the parrot’s immobility.
Such is the case now with those denying the fact that their claim - that catastrophic climate change results from increases in atmospheric carbon dioxide - has proved false. For seventeen-plus years, global atmospheric carbon dioxide has continued to increase, yet global temperatures have remained flat.
Schoolchildren are indoctrinated with the dogma of destructive climate change caused by human activity. However, none of those seventeen or younger have experienced the claimed global warming.
In less than three years, the current global temperature plateau will match the prior twenty-year warming trend, itself preceding a thirty-year global cooling period. Such reality conflicts with current political dogma and the investment schemes built on political favoritism.
The reality of a defunct, bogus claim that human activity has measurably or harmfully impacted global climate is not accepted by the shopkeepers who sold the public this dead parrot. Said shopkeeper is exemplified in real life by Prof. Chris Folland, Hadley Centre for Climate Prediction and Research: “The data doesn’t matter. We’re not basing our recommendations on the data. We’re basing them on the climate models.”
The parrot may look dead, but we are not looking at the parrot. We are looking at our computer, which says the parrot is alive.
A bracingly refreshing whiff of honesty on the climate catastrophe industry was provided by Ottmar Edenhoffer: “This has almost nothing to do with environmental policy.... [O]ne must say clearly that we redistribute de facto the world’s wealth by climate policy.” He failed to point out the direction of this wealth transfer.
This redistribution of wealth via climate catastrophe has made many quite wealthy, including Al Gore and Tom Steyer, and created many a corporation financed with taxes devoted to supporting renewable energy. This redistribution of wealth upward from the less fortunate to the ruling class via governmental climate policy has been facilitated by the appointment of John Podesta as counselor to President Obama.
Hedge fund monies and activists’ protests notwithstanding, the climate change advocates’ pet boondoggle is no more,” “has ceased to be,” and is “bereft of life,” in the words of the Monty Python skit. Everyone else can see this as a dead bird.
However, hope does not die easily for the environmentalism group. This past Monday, March 10, 2014, Senate Democrats held a night-long vigil to wake up concerns over climate change. The more scientifically informed public viewed this fittingly as a wake for a dead dogma.
Page printed from here.
Steven Goddard, Real Science
Handy chart to distinguish AGW caused cold from regular cold: Learning To Distinguish Different Types Of Cold
Jeff Masters of the Weather Underground and now of the Weather Company (formerly known as The Weather Channel) says that this winter’s cold and snow is due to global warming. It is important that we learn to distinguish between natural cold, global cooling cold, and global warming cold. The chart above makes the distinctions ‘abundantly clear.’
As a smart man once said “Two things are infinite: the universe and human stupidity; and I’m not sure about the universe”

2013/14 RANKING AMONG COLDEST WINTERS ON RECORD
Ironwood, Michigan 1st
Marquette, Michigan 1st
Eau Claire, Wisconsin 1st
Rhinelander, Wisconsin 1st
Oshkosh, Wisconsin 1st
Sturgeon Bay, Wisconsin 1st
Munising, Michigan 2nd
Green Bay, Wisconsin 2nd
Wausau, Wisconsin 2nd
Alpena, Michigan 2nd
Houghton Lake, Michigan 2nd
Duluth, Minnesota 2nd
International Falls, Minnesota 2nd
Chicago, Illinois 3rd
Rockford, Illinois 3rd
Mason City, Iowa 3rd
Wheaton, Minnesota 3rd
St. Cloud, Minnesota 4th
Waterloo, Iowa 4th
Flint Michigan 5th
Sault Ste Marie, Michigan 6th
Sisseton, South Dakota 6th
Fort Wayne, Indiana 6th
South Bend, Indiana 6th
Saginaw, Michigan 7th
Watertown, South Dakota 7th
Detroit, Michigan 8th
Milwaukee, Wisconsin 10th
Madison, Wisconsin 11th
By Steve Goreham
Originally published in Communities Digital News.
The global energy outlook has changed radically in just six years. President Obama was elected in 2008 by voters who believed we were running out of oil and gas, that climate change needed to be halted, and that renewables were the energy source of the near future. But an unexpected transformation of energy markets and politics may instead make 2014 the year of peak renewables.
In December of 2007, former Vice President Al Gore shared the Nobel Peace Prize for work on man-made climate change, leading an international crusade to halt global warming. In June, 2008 after securing a majority of primary delegates, candidate Barack Obama stated, “...this was the moment when the rise of the oceans began to slow and our planet began to heal...” Climate activists looked to the 2009 Copenhagen Climate Conference as the next major step to control greenhouse gas emissions.
The price of crude oil hit $145 per barrel in June, 2008. The International Energy Agency and other organizations declared that we were at peak oil, forecasting a decline in global production. Many claimed that the world was running out of hydrocarbon energy.
Driven by the twin demons of global warming and peak oil, world governments clamored to support renewables. Twenty years of subsidies, tax-breaks, feed-in tariffs, and mandates resulted in an explosion of renewable energy installations. The Renewable Energy Index (RENIXX) of the world’s 30 top renewable energy companies soared to over 1,800.
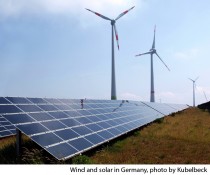
Tens of thousands of wind turbine towers were installed, totaling more than 200,000 windmills worldwide by the end of 2012. Germany led the world with more than one million rooftop solar installations. Forty percent of the US corn crop was converted to ethanol vehicle fuel.
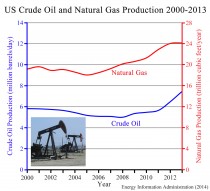
But at the same time, an unexpected energy revolution was underway. Using good old Yankee ingenuity, the US oil and gas industry discovered how to produce oil and natural gas from shale. With hydraulic fracturing and horizontal drilling, vast quantities of hydrocarbon resources became available from shale fields in Texas, North Dakota, and Pennsylvania.
From 2008 to 2013, US petroleum production soared 50 percent. US natural gas production rose 34 percent from a 2005 low. Russia, China, Ukraine, Turkey, and more than ten nations in Europe began issuing permits for hydraulic fracturing. The dragon of peak oil and gas was slain.
In 2009, the ideology of Climatism, the belief that humans were causing dangerous global warming, came under serious attack. In November, emails were released from top climate scientists at the University of East Anglia in the United Kingdom, an incident christened Climategate. The communications showed bias, manipulation of data, avoidance of freedom of information requests, and efforts to subvert the peer-review process, all to further the cause of man-made climate change.
One month later, the Copenhagen Climate Conference failed to agree on a successor climate treaty to the Kyoto Protocol. Failures at United Nations conferences at Cancun (2010), Durban (2011), Doha (2012), and Warsaw (2013) followed. Canada, Japan, Russia, and the United States announced that they would not participate in an extension of the Kyoto Protocol.
Major climate legislation faltered across the world. Cap and trade failed in Congress in 2009, with growing opposition from the Republican Party. The price of carbon permits in the European Emissions Trading System crashed in April 2013 when the European Union voted not to support the permit price. Australia elected Prime Minister Tony Abbott in the fall of 2013 on a platform of scrapping the nation’s carbon tax.
Europeans discovered that subsidy support for renewables was unsustainable. Subsidy obligations soared in Germany to over $140 billion and in Spain to over $34 billion by 2013. Renewable subsidies produced the world’s highest electricity rates in Denmark and Germany. Electricity and natural gas prices in Europe rose to double those of the United States.
Worried about bloated budgets, declining industrial competitiveness, and citizen backlash, European nations have been retreating from green energy for the last four years. Spain slashed solar subsidies in 2009 and photovoltaic sales fell 80 percent in a single year. Germany cut subsidies in 2011 and 2012 and the number of jobs in the German solar industry dropped by 50 percent. Renewable subsidy cuts in the Czech Republic, Greece, Italy, Netherlands, and the United Kingdom added to the cascade. The RENIXX Renewable Energy Index fell below 200 in 2012, down 90 percent from the 2008 peak.
Once a climate change leader, Germany turned to coal after the 2012 decision to close nuclear power plants. Coal now provides more than 50 percent of Germany’s electricity and 23 new coal-fired power plants are planned. Global energy from coal has grown by 4.4 percent per year over the last ten years.
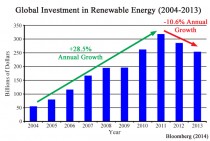
Spending on renewables is in decline. From a record $318 billion in 2011, world renewable energy spending fell to $280 billion in 2012 and then fell again to $254 billion in 2013, according to Bloomberg. The biggest drop occurred in Europe, where investment plummeted 41 percent last year. The 2013 expiration of the US Production Tax Credit for wind energy will continue the downward momentum.
Today, wind and solar provide less than one percent of global energy. While these sources will continue to grow, it’s likely they will deliver only a tiny amount of the world’s energy for decades to come. Renewable energy output may have peaked, at least as a percentage of global energy production.
Steve Goreham is Executive Director of the Climate Science Coalition of America and author of the book The Mad, Mad, Mad World of Climatism: Mankind and Climate Change Mania.
By Ron Arnold, Washington Examiner
American taxpayers foot the bill for the Environmental Protection Agency’s costly regulations, and they have a right to see the underlying science. EPA bureaucrats routinely hide this public information, insolently foreshadowing President Obama’s recently outed code of ethics, “I can do anything I want.”
As Rep. Lamar Smith, R-Texas, bluntly forced the issue, “Virtually every regulation proposed by the Obama administration has been justified by nontransparent data and unverifiable claims.”
“Nontransparent data and unverifiable claims”? Translated from scientese, it’s like this: If you’re a good scientist, you make an exact, detailed description of how you did your study or research so anybody else can follow your description and get the same result.
If you won’t tell anybody how you did it, your work is not “transparent”.
If you do tell and nobody else can get the same result you got, your science is junk, or not “reproducible” - not verifiable.
Face it, EPA science is junk science and they’re hiding that fact.
Smith is in a position to do something about Obama’s scofflaws: he’s chairman of the House Science, Space and Technology Committee, where his panel this Tuesday held a hearing on “Ensuring Open Science at EPA.”
It was the launching pad for the Secret Science Reform Act of 2014, a bill to bar the EPA from proposing regulations based upon science that is not transparent or not reproducible.
That sent shockwaves through Big Green, which has a vested interest in hiding outdated, biased, falsified, sweetheart-reviewed, and even non-existent “science” that has destroyed the lives of thousands in the death-grip of agenda-driven EPA rules.
Environment Subcommittee Chairman Rep. David Schweikert, R-Ariz., gaveled the hearing to order. “For far too long,” he said, “the EPA has approved regulations that have placed a crippling financial burden on economic growth in this country with no public evidence to justify their actions.”
The average American would probably ask why the EPA is such a problem. The first witness told why: John D. Graham, a dean at Indiana University and former administrator of the Office of Information and Regulatory Affairs, has years of experience telling good science from junk.
Graham surprisingly said that EPA science standards are “quite high” because lives depend upon proper rules to protect us from the harmful effects of pollution while avoiding data errors that can unjustly destroy whole sectors of America’s economy.
EPA isn’t living up to its standards. Why not?
EPA’s downfall is its poorly developed science culture, said Graham. “In my experience working with EPA, I have found that the political, legal and engineering cultures are fairly strong but the cultures of science and economics are highly variable ... First-rate scientists who are interested in public service employment might be more inclined to launch a career at the National Academy of Sciences” or elsewhere.
Most damning, Graham cited a decade of National Science Foundation reports documenting the bad quality, transparency and reproducibility of EPA’s scientific determinations.
Dr. Louis “Tony” Cox, chief sciences officer at Nexthealth Technologies, needs access to sound data for his work on health risk assessment, but he’s more than alarmed at the state of EPA science. Cox sees “catastrophic failure in the reproducibility and trustworthiness of scientific results.”
Even science editors complain that many published research articles are false and even peer-reviewed results are not reproducible.
EPA demands sensational reports, true or not, and isn’t checking scientists’ work.
In short, we need junk sniffers.
Raymond J. Keating, chief economist of the Small Business & Entrepreneurship Council, who testified for the Center for Regulatory Solutions, provided one of the hearing’s big shockers: “The annual cost of federal regulations registered $1.75 trillion in 2008.”
A highly credentialed witness, Johns Hopkins School of Public Health Professor Ellen Silbergeld, picked the Secret Science Reform bill apart. She hit two points: lack of protection for patient information privacy in EPA health studies, and a requirement for everyone but industry to reveal their data.
In rebuttal of both points, Graham noted that the National Academy of Sciences is now focusing not on whether patient data is to be shared, but how to do it while protecting privacy; and the Secret Science Reform bill requires all EPA science, regardless of source or funding, to have open data, including industry.
Rep. Jim Bridenstine, R-Okla., asked of the witness panel, “Do any of you disagree with the principle that in [the] case of taxpayer-funded research or studies, the public should have access to the underlying data?” Silbergeld responded, “As stated in my testimony, for reasons given, I disagree with that - respectfully.”
EPA is basing major regulatory decisions on junk and inviting a rebellion by doing it.
Taxpayers must become America’s army of junk science sniffers and ruthlessly axe the EPA’s heart rot - respectfully, of course.
RON ARNOLD, a Washington Examiner columnist, is executive vice president of the Center for the Defense of Free Enterprise.