

By Ann McElhinney
Friends,
Last March James Cameron sounded defiant.
The Avatar director was determined to expose journalists, such as myself, who thought it was important to ask questions about climate change orthodoxy and the radical “solutions” being proposed.
Cameron said was itching to debate the issue and show skeptical journalists and scientists that they were wrong.

“I want to call those deniers out into the street at high noon and shoot it out with those boneheads,” he said in an interview.
Well, a few weeks ago Mr. Cameron seemed to honor his word.
His representatives contacted myself and two other well known skeptics, Marc Morano of the Climate Depot website and Andrew Breitbart, the new media entrepreneur.
Mr. Cameron was attending the AREDAY environmental conference in Aspen Colorado 19-22 August. He wanted the conference to end with a debate on climate change. Cameron would be flanked with two scientists. It would be 90 minutes long. It would be streamed live on the internet.
They hoped the debate would attract a lot of media coverage.
“We are delighted to have Fox News, Newsmax, The Washington Times and anyone else you’d like. The more the better,” one of James Cameron’s organizers said in an email.
It looked like James Cameron really was a man of his word who would get to take on the skeptics he felt were so endangering humanity.
Everyone on our side agreed with their conditions. The debate was even listed on the AREDAY agenda.
But then as the debate approached James Cameron’s side started changing the rules.
They wanted to change their team. We agreed.
They wanted to change the format to less of a debate - to “a roundtable”. We agreed.
Then they wanted to ban our cameras from the debate. We could have access to their footage. We agreed.
Bizarrely, for a brief while, the worlds most successful film maker suggested that no cameras should be allowed-that sound only should be recorded. We agreed
Then finally James Cameron, who so publicly announced that he “wanted to call those deniers out into the street at high noon and shoot it out,” decided to ban the media from the shoot out.
He even wanted to ban the public. The debate/roundtable would only be open to those who attended the conference.
No media would be allowed and there would be no streaming on the internet. No one would be allowed to record it in any way.
We all agreed to that.
And then, yesterday, just one day before the debate, his representatives sent an email that Mr. “shoot it out “ Cameron no longer wanted to take part. The debate was cancelled.
James Cameron’s behavior raises some very important questions.
Does he genuinely believe in man made climate change? If he believes it is a danger to humanity surely he should be debating the issue every chance he gets ?
Or is it just a pose?
The man who called for an open and public debate at “high noon” suddenly doesn’t want his policies open to serious scrutiny.
I was looking forward to debating with the film maker. I was looking forward to finding out where we agreed and disagreed and finding a way forward that would help the poorest people in the developing and developed world.
But that is not going to happen because somewhere along the way James Cameron, a great film maker, has moved from King of the World to being King of the Hypocrites.
- Ann McElhinney
See blog post here.
Chicken Cameron Runs then Resorts to Ad Hominem Attacks
Friends,
Back in March James Cameron said, “I want to call those deniers out into the street at high noon and shoot it out with those boneheads.”
This put into motion the debate-that-was-not, starting with Cameron calling Ann McElhinney, Marc Marono, and Andrew Breitbart requesting a debate at the AREDAY summit.
But as soon as they accepted, Cameron started backtracking. His list of demands for the debate can only be described as diva behavior, changing by the hour and becoming more restrictive every time. Ban cameras, ban audio, ban the media, ban the public.
We met every unreasonable demand. Yet, when it finally came time to sit down and discuss Global Warming the outspoken environmentalist turned tail and ran, canceling while one of the debaters, Marc Marono, was in flight. “The whole house of cards is falling! Well done, Jimmy! I’m beginning to doubt the existence of the Titanic,” mocked Dennis Miller.
Canceling the debate didn’t stop Cameron from trash-talking skeptics at AREDAY. “James Cameron quickly went for the oft-traversed intellectual low road of ad hominem attacks, recently attacking skeptics of global warming as those of piggish DNA,” said Tim Daniel of The Daily Caller.
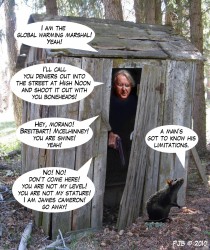
James Cameron at High Noon (enlarged here).
Read much more here.
Energy Institute August Newsletter
With energy constantly in the headlines, and continued efforts in Congress to enact job-killing energy policies, Energy Institute officials have hit the road in an effort to educate Americans from coast to coast about our energy realities - and advocate for a balanced set of solutions to solve our challenges.
The Energy Institute’s Energy Reality Tour: A National Discussion About America’s Energy Future, has already featured stops in Indianapolis, Denver, Colorado Springs, Jacksonville, Seattle, and Juneau and Anchorage this summer, with more stops planned as the mid-term elections near. At each stop, Energy Institute president and CEO Karen Harbert is addressing business and community leaders, visiting the region’s top media outlets, and sharing specific facts and recommendations about pressing energy issues in each state and the nation as a whole.
Harbert is stressing the need to refrain from “rash to dash” decision-making which results in knee jerk reactions to events that will have negative long-term implications. Harbert and other Energy Institute officials point to the moratorium on oil and natural gas exploration in the Gulf of Mexico that the Obama administration imposed shortly after the Gulf of Mexico accident in April as one of these reactions. The U.S. Chamber has launched a campaign to end the moratorium that is killing jobs and stunting economic growth in the Gulf region.
As if the moratorium weren’t enough, under the auspices of addressing the oil spill, House and Senate leaders proposed legislation that would essentially shut down America’s oil and gas industry by imposing new taxes and non-safety related regulations that would drive jobs overseas. Among the most problematic parts of the legislation are provisions that completely eliminate any liability cap for future incidents. While this may sound good at first blush, the reality is that without a cap, it would become almost impossible for companies to obtain required insurance. Considering that over 90 percent of leases in the Gulf of Mexico are held by independent companies, the legislation would hit small businesses particularly hard and make it very difficult for them to operate.
While the House of Representatives narrowly passed the bill (with 39 Democrats opposed), the Senate legislation collapsed and never made it to a floor vote. The U.S. Chamber of Commerce vigorously opposed both measures. Energy Institute president and CEO Karen Harbert commented that the legislation “would harm our economy, shed more jobs and force us to become even more reliant on foreign oil.” The Chambers Key Vote letter in opposition to the House bill was quoted during debate on the House floor. We will continue to oppose ill-advised legislative proposals that will kill jobs and threaten the nations energy security when Congress returns in September.
Such actions are exactly why the Energy Institute has embarked on its tour. While many business owners are aware of how important energy is, it can be difficult to follow the day-today actions of Congress and the administration on these critical issues. By bringing facts and clarity to communities around the country, the Energy Institute is motivating local business leaders to become more engaged to ensure that our nation is getting the right leadership on energy and the economy, something which is more important than ever with mid-term elections looming.
Read more here.
Christopher Monckton
During the last few years, the desperation has become palpable among the UNIPCC, many Western governments and their lavishly-funded conscripts promoting more political centralization, massive transfers of wealth and technologies and breath-taking personal greed.
Because some of the graphs in the SPPI Monthly CO2 Report expose exaggerations, if not outright deceptions, in the UN’s IPCC reports, alarmist pro-IPCC, pro-regulatory websites have, of necessity, attacked them and their presenter, Christopher Monckton.
A response to these attacks appears in this month’s report, and also in this recent short paper posted on the SPPI website.
That the CO2 Report has not only provoked and engaged much needed debate on the central issues of science and governance - such as climate sensitivity, natural cycles beyond human control and transnational governance – but heightened it, is a major value in and of itself. The individual reader - to the extent that he/she understands the finer points of this debate - is invited to make up his/her own mind as to which side comes closest to reality, given the serious uncertainties in “climate science” and the climate models largely pretending at science.
As can be seen in the below listed contents of this month’s report, government-funded claims of catastrophe from temperature to sea level rise to tropical storms to sea ice extent to ocean “acidification” do not match real-world evidence - often the exact opposite is the case. The American people are increasingly awaking to this reality, resulting in a healthy, increasing distrust of the motives and actions of government and its paid servants in government agencies, NGOs and academia. The real “deniers” of science are coming to the fore.
Contents
Did ‘global warming’ cause Russia’s drought and Pakistan’s floods?
The authoritative Monthly CO2 Report for June 2010 explains that recent extreme weather is of natural origin and that the influence of Man is too small to have played a significant part. Editorial Comment: Page 3.
Morner on sea level: The Professor says yet another suggestion that sea level will soon rise 23 feet is nonsense. Page 4.
Our revised graphs explained: An account of how we compile our authoritiative SPPI temperature and CO2 graphs. Page 5.
IPCC assumes CO2 concentration will reach 836 ppmv by 2100, but, on present trends, it will be well short. Pages 6-8.
Since 1980 global temperature has risen at only 2.7 F (1.5 C)/century, not 6 F (3.4 C) as IPCC predicts. Pages 9-12.
Sea level rose just 8 inches in the 20th century, and has been rising since 1993 at a very modest 1 ft/century. Page 13.
Arctic sea-ice extent is nearing its summer minimum. In the Antarctic, sea ice extent is now at its third-highest in the 30-year record. Global sea ice extent shows little trend for 30 years. Pages 14-18.
Hurricane and tropical-cyclone activity remains at its lowest since satellite measurement began. Pages 19-22.
Sunspot activity is back to low-normal: but, looking back it was a long - and cool - solar minimum. Pages 23-24.
The (very few) benefits and the (very large) costs of the Sunspot activity are illustrated at Pages 25-28.
There is no cause for alarm: Christopher Monckton of Brenchley says CO2 and warming are normal. Pages 29-32.
As always, there’s our “global warming” ready reckoner, the surest way to check policy costs against benefits. Pages 33-34.
Our selection of recent scientific papers of interest, compiled by Dr. Craig Idso of www.co2science.org. Pages 35-40.
The medieval warm period was real, global, and warmer than the present, as our global map shows. Page 41.
See report here.
Guest SEPP editorial by Sherwood Idso, Keith Idso, and Craig Idso
In a “Highlights” report of the National Oceanic and Atmospheric Administration’s State of the Climate in 2009 document, which was prepared under the direction of the U.S. National Climatic Data Center, we can read the principal findings of what the document describes as the work of “more than 300 scientists from 48 countries.” Their primary conclusion, as stated in the Report’s first paragraph, is that “global warming is undeniable,” and the Report goes on from there to describe “how we know the world has warmed.” But this, and all that follows, tells us next to nothing about what has caused the warming, which is the crux of the whole contentious matter.
The Report next states, for example, that “recent studies show the world’s oceans are heating up,” which is fine; but then—as if hoping no one will question them—the Report says the oceans are warming, “as they absorb most of the extra heat being added to the climate system from the build-up of heat-trapping gases,” which contention is far from a proven fact, and is—in fact—merely an hypothesis .... and a bad one at that, as we shall soon see.
Another fault of the Report is its hyping of “melting Arctic sea ice,” while it remains silent on the state of Antarctic sea ice, which has been doing just the opposite as it has grown in extent. Likewise, a major inconsistency of the Report is its stating, with respect to temperature, that “a particular year can experience record-breaking highs and lows in any given location,” while, “as a whole, global climate continues to warm.” This is very true; and it can also do so while, as a whole, global climate cools or remains unchanged. And it implies the same thing for all types of weather phenomena (such as droughts, floods, hurricanes, etc.), which means that the occurrence of any unusually dramatic weather phenomenon in any “particular year” should imply nothing about the long-term trend of that phenomenon or the presumed trajectory of the global climate within which it is embedded. Yet the Report goes on to describe six such extreme events that occurred in the “particular year” of 2009, which would have to have been done for no other reason than to imply that these weather extremes were caused by global warming, which flies in the face of their earlier contention that record-breaking low temperatures in any year say nothing about the long-term thermal tendency of the planet.
Last of all, the Report states that “people have spent thousands of years building society for one climate and now a new one is being created—one that’s warmer and more extreme,” which leads us to wonder ....
How could more than 300 scientists from 48 countries possibly be so wrong? Any student of history and palaeoclimate well knows that earth’s climate has changed dramatically over the past “thousands of years.” During the central portion of the current interglacial period, for example, many parts of the planet were a few to several degrees Centigrade warmer than they currently are. And only a thousand years ago, the Medieval Warm Period was holding sway. Although many of the scientists of Climategate infamy tried mightily to make that period of warmth “go away,” the Center for the Study of Carbon Dioxide and Global Change has for quite some time now posted a review of a different research project every single week that testifies to the reality of the Medieval Warm Period. And that ever-growing body of research is demonstrating beyond any doubt that there was a several-hundred-year interval of warmth back then that was at many different times (stretching from decades to centuries), and in numerous places (throughout the entire world), significantly warmer than the Report’s highly-touted first decade of the 21st century, and at a time when the atmosphere’s CO2 concentration was far less than it is today.
What makes this particular failure of the Report so doubly damning is the fact that it claims that each of the “more than 30 different climate indicators” it has analyzed “is placed into historical context.” That is obviously not true. And for a parameter so central to the core of the global warming discussion as temperature to not be put into proper long-term context is inexcusable, although quite understandable, especially when one realizes the implications it would hold for the Report’s unfounded contentions about the present state of earth’s climate.
Sign up for the weekly SEPP Newsletter for a compilation of stories from many sites. See PDF.
By James Rosen
With the Obama administration returning to federal court to defend its six-month suspension of oil drilling in the Gulf of Mexico, industry executives and analysts claimed the ban was more stringent than originally believed, and exerting a greater impact on the lives and livelihoods of Gulf Coast residents.
Lawyers representing Interior Secretary Ken Salazar were back before U.S. District Judge Martin Feldman in New Orleans Wednesday, seeking to fend off court challenges by an offshore drilling services firm to the newest set of industry rules that Salazar instituted on July 12. Those rules were meant to preserve Salazar’s original moratorium order, which Feldman ruled unconstitutional on June 22, and to address the concerns articulated by the judge in his ruling.
But some industry analysts say Salazar’s revised rules go further than his first moratorium order, which was set to last until November 30. The Obama administration said the moratorium was necessary to strengthen the safety of offshore drilling operations in the wake of the April 20 explosion and oil spill aboard the Deepwater Horizon well, operated by British conglomerate BP. The accident killed eleven rig workers and unleashed an estimated 5 million barrels of crude oil into the Gulf.
“They’re painting the getaway car a different color,” said Dan V. Kish, senior vice president for policy at the Institute for Energy Research in Washington. Kish said the original moratorium applied only to drilling rigs operating in 500 feet of water or deeper, but that the July 12 order by Salazar applies to all floating rigs in the Gulf.
What’s more, Kish said there are effectively two moratoria in place: the formal one, targeting deepwater drilling, and an informal one targeting shallow-water drilling operations. “About half of the rigs in the shallow waters of the Gulf are not operating,” said Kish, “because they can’t get permits from the government agency that is supposed to give them permits. So, in essence, what’s happening is that much of the fleet of deep- and shallow-water rigs in the Gulf of Mexico, which supplies a third of our domestic oil, are being laid up, put in cold storage, awaiting the government to make a decision one way or the other.”
Analysts said that of the thirty-three deepwater rigs in the Gulf, along with another eight under construction and committed to operate in the Gulf, at least four have already left, or are preparing to leave, the U.S. for foreign shores, pursuing contracts in emerging markets like the Egypt, the Congo, Brazil, and Greenland.
Each rig, the analysts said, costs approximately $500-600 million to build, and is constructed under strict debt-financing terms that require the owners to have long-term drilling contracts secured in advance. “If those contracts, which have been abrogated by the federal government here, are not generating revenue to pay the debt on these rigs,” said Eric Smith, a professor at the Tulane University business school, “the rigs have to leave. And when they leave...we’ll finish our moratorium and we’ll say, ‘Go back to work,’ and the oil operator is going to say, ‘With what?’ because the equipment will be gone, without any reasonable chance of getting it back anytime soon.”
Smith calculated that current restrictions effectively halting shallow- and deepwater drilling in the Gulf account for the loss of a combined 137,000 jobs, and impose a cost of $3 billion in “payroll effects,” with Louisiana consequently suffering a loss of $300 - $400 million in tax receipts. Smith’s assessment is in line with some of the projections put forward by Dr. Joseph R. Mason of Louisiana State University, who estimated in a recent analysis that the moratoria will inflict “broad economic losses within the Gulf region and throughout the nation as a whole,” to the tune of $2.7 billion in economic activity.
“The administration is in thrall to the environmental community, unfortunately, and as a result, they’re playing that card, and I think to try and slow up, or increase the cost of, hydrocarbons,” said Smith. “I don’t blame them for doing that; I just think that’s the reality...After the [1989] Exxon Valdez accident, after the [1969] Santa Barbara accident, we certainly did study the accidents to figure out what went wrong and then take some corrective action. But we didn’t shut down the industry in the meantime.”
Secretary Salazar’s point man on Gulf drilling operations is Michael Bromwich, director of the new Bureau of Ocean Energy Management, the new incarnation of the agency formerly known as the Minerals Management Service.
Bromwich is presently embarked on a listening tour in the Gulf Coast. He told an audience in Mobile, Alabama on Tuesday that he doesn’t see the moratorium extending beyond November 30, and held out hope that it could conceivably end sooner than that. “I’ve asked, and BP has agreed to provide, very detailed descriptions and analyzes and lessons learned on spill containment, on oil spill response, and on drilling safety,” Bromwich said. “All of that information is extraordinarily relevant to determine whether—when everything is taken into account, including the economic impact—whether the drilling, whether the deepwater drilling moratorium can be shortened, [and] drilling can resume sometime before November 30.”
At the same time, Bromwich made clear that the economic impact of the deepwater drilling moratorium is not his primary concern in his Gulf Coast events this week. He told the audience in Mobile: “Economic impact is something that we’re paying attention to, that we care deeply about. We’ve heard about the pain and suffering that people are going through and that certainly is being taken into account. But that is not the central purpose of these forums, which is to gather information [on drilling safety].”
The co-chairs of the blue-ribbon panel appointed by President Obama to investigate the BP disaster and its after-effects indicated that they will include the economic impact of the moratorium in their final report.
Former Sen. Bob Graham, the Florida Democrat who is one of the co-chairs, told the Washington Post that the final report of the National Commission on the BP Deepwater Horizon Oil Spill and Offshore Drilling will address such questions as: “How effective was the moratorium? How well was the moratorium administered and managed? What were the consequences . . . on the side of safety, encouraging enhanced response, as contrasted to the economic aspects?”
Graham’s co-chair, William K. Reilly, a former head of the Environmental Protection Agency, expressed more palpable skepticism about the wisdom of the moratorium, telling the Post: “I don’t understand why it would take six months to vet thirty-three [deepwater] rigs for safety, environmental compliance, regulatory integrity. It’s never been made clear to me, and the testimony we received in New Orleans [on July 12] was not convincing on that.”
See where Texas sues feds over drilling ban here.
Der Spiegel
Der Spiegel reports here on Russia’s extreme heat that’s has contributed to higher death rates and wildfires, plunging Moscow into a thick, choking smog. Hat-tip to reader DirkH.
The following NASA photo shows where it’s hot, and where it’s cool.
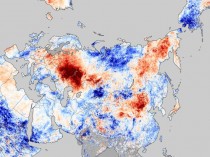
Hot spot in Russia. Source here.
So far 7600 sq km have burned. NASA’s Terra satellite shows that the fires began in later July, when temperatures in the areas were 12C and more above normal. One sees how the heat is concentrated in one spot, while the remainder of the continental area is near normal or even cool. Russian meteorologists say they are unable to find anything in the archives that compares to this, not in the last 1000 years.
While warmists are quick to pin the blame on climate change, others point out that the fires have other primary causes. Der Spiegel writes that much of the blame for the catastrophe goes to the authorities and mismanagement of forests:
Forest fire experts say the authorities also get most of the blame for the catastrophe. Large fires like this one in Russia are caused primarily by man.
According to Johann Goldammer of the Max-Planck Institute for Chemistry at the University of Freiburg:
There is no evidence that the fires ignited by themselves because of the drought.
Goldammer says that excessive deforestation of the landscape may be a factor in the fires because they leave barren steppe-like landscapes that tend to dry out quickly and become a tinderbox.
But then Goldammer’s makes the dubious claim that this was caused by the fact that the forests had been put into private hands, and then recommends Soviet-style land use!
It has something to do with sustainable land use, like land-use in the old Soviet Union, where it was much more efficient than today.
Now that’s the way to solve problems. I suggest Goldammer read up on how the Soviets managed to run the entire country into the ground.
By Anthony Watts
From the University of Leicester: An ancient Earth like ours
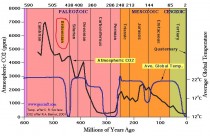
Enlarged here.
Geologists reconstruct the Earth’s climate belts between 460 and 445 million years ago
An international team of scientists including Mark Williams and Jan Zalasiewicz of the Geology Department of the University of Leicester, and led by Dr. Thijs Vandenbroucke, formerly of Leicester and now at the University of Lille 1 (France), has reconstructed the Earth’s climate belts of the late Ordovician Period, between 460 and 445 million years ago.
The findings have been published online in the Proceedings of the National Academy of Sciences of the USA - and show that these ancient climate belts were surprisingly like those of the present.
The researchers state: “The world of the ancient past had been thought by scientists to differ from ours in many respects, including having carbon dioxide levels much higher - over twenty times as high - than those of the present. However, it is very hard to deduce carbon dioxide levels with any accuracy from such ancient rocks, and it was known that there was a paradox, for the late Ordovician was known to include a brief, intense glaciation - something difficult to envisage in a world with high levels of greenhouse gases.”
The team of scientists looked at the global distribution of common, but mysterious fossils called chitinozoans - probably the egg-cases of extinct planktonic animals - before and during this Ordovician glaciation. They found a pattern that revealed the position of ancient climate belts, including such features as the polar front, which separates cold polar waters from more temperate ones at lower latitudes. The position of these climate belts changed as the Earth entered the Ordovician glaciation - but in a pattern very similar to that which happened in oceans much more recently, as they adjusted to the glacial and interglacial phases of our current (and ongoing) Ice Age.
This ‘modern-looking’ pattern suggests that those ancient carbon dioxide levels could not have been as high as previously thought, but were more modest, at about five times current levels (they would have had to be somewhat higher than today’s, because the sun in those far-off times shone less brightly).
“These ancient, but modern-looking oceans emphasise the stability of Earth’s atmosphere and climate through deep time - and show the current man-made rise in greenhouse gas levels to be an even more striking phenomenon than was thought,” the researchers conclude.
Reference: Vandenbroucke, T.R.A., Armstrong, H.A., Williams, M., Paris, F., Zalasiewicz, J.A., Sabbe, K., Nolvak, J., Challands, T.J., Verniers, J. & Servais, T. 2010. Polar front shift and atmospheric CO2 during the glacial maximum of the Early Paleozoic Icehouse. PNAS doi/10.1073/pnas.1003220107.
Comments:
stevengoddard says:
August 10, 2010 at 8:31 am
Completely clueless paper.
They assume that the difference in temperature during the Ordovician was due to “5X CO2” and negate their own reasoning about the Ordovician ice age.
How is it that all the corals and sea shells didn’t dissolve? Romm tells us that a few ppm is all that is needed to turn their shells soft. Have the chemical properties of Aragonite changed?
Read more here.
By Anthony Watts
WUWT readers may recall last week that the “Our Climate” iPhone app was released and announced here. It has quickly become a best seller on the iTunes store.
It has also quickly become a target.
John Cook, a generally reasonable Aussie who runs a blog oddly titled “skepticalscience” (odd, since it isn’t skeptical, but pushes the consensus) also has an iPhone app. Knowing that he wouldn’t get enough traffic on his blog to effectively smack down this new informational threat, he turned to the Guardian, and was immediately offered a guest essay there.
The title? Climate change denial? There’s an app for that.
How sad that Cook and the Guardian had to resort to such a cheap shot.
Problem is, that essay appears to have backfired as “Our Climate” continues to grow. Right after that Guardian piece by Cook, downloads surged. So much in fact, Apple itself is even promoting it on the iTunes (installed Mac and PC application) front page now!
Have a look:

I hate it when that happens.
There are more than 230,000 Apps in the App store - Only 40 Apps are featured in this front page category at any time, so this is a singular achievement and opportunity for the truly skeptical side of the story to be heard.
Get the app for yourself here.
Don’t have an iPhone? Tell a friend who does.
And for the record, I don’t make a dime from this. I have no ownership or revenue sharing in it whatsoever.
As an aside, I wonder if Cook has seen the latest Gallup poll on Global Warming in Australia?
----------------
Australians’ Views Shift on Climate Change
By Anita Pugliese and Linda Lyons
WASHINGTON, D.C.—Australians’ attitudes about global warming could be a factor later this month in the general election where climate change has emerged as an issue. The percentage of Australians who are aware of climate change and say it results from human activities fell from 52% in June 2008 to 44% in March 2010, while the number attributing it to natural causes increased 10 percentage points.
Enlarged here.
Such a shift is particularly noteworthy among a population that follows the global warming debate closely. Awareness of climate change in Australia remains among the highest measured in the world—97% say they know “a great deal” (24%) or “something” (73%) about the issue. Therefore, the “climategate” controversy that surfaced in late 2009 may partly explain some of the shifts in Australians’ attitudes on primary causes. Published e-mails from University of East Anglia’s Climatic Research Unit (CRU)—one of the world’s leading climate study institutions—called CRU’s research into question. The accusation that CRU was manipulating the data to inflate the case for human-caused climate change has since been refuted.
Global warming also lost traction as a perceived direct threat to Australians. Twenty-two percent of Australians currently describe its threat to themselves and their families as “very serious,” down from 31% in 2008. Although fewer Australians perceive it as a serious threat, the majority (69%) continue to believe that climate change poses a very or “somewhat serious” personal threat.
Enlarged here.
The United Nations Climate Change Conference in Copenhagen, Denmark, in December 2009—which produced weaker outcomes than many expected—and the Australian government’s delayed action on climate policy, may have sent a signal to some Australians that global warming is not as serious as they previously believed.
Implications
In addition to the economy, healthcare, and immigration, climate change will be a key topic in the Aug. 21 national general election that pits new Prime Minister Julia Gillard’s Labor party against opposition leader Tony Abbott’s Liberal-National coalition. Both parties have pledged to reduce emissions by at least 5% by 2020, but via different approaches. With such attentiveness to climate change issues, Australians will be monitoring each candidate closely.
See more here.