

Dr. Vincent Gray, NZ Climate Truth Newsletter
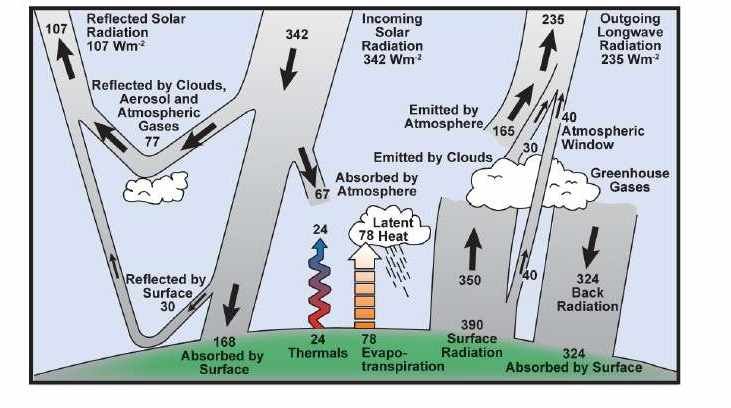
All of the computer models of the climate have adopted the flat earth theory of the earth’s energy, as portrayed in Kiehl J. T. and K. E. Trenberth 1997. Earth’s Annual Global Mean Energy Budget. Bull. Am. Met. Soc. 78 197-208.
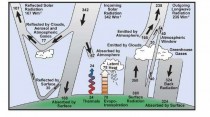
The attached (enlarged) graph is in all of the Reports of the Intergovernmental Panel on Climate change, and it is fundamental to all their activities.
It assumes that the earth can be considered to be flat, that the sun shines all day and all night with equal intensity, and that the temperature of the earth’s surface is constant.
All the quantities on the graph are given as correct to the nearer Watt per square meter, but the figures in the paper are shown to possess very high inaccuracy which can never be measured, but always has to be “qualitatively estimated”. On this occasion it was possible to stretch these inaccuracies to the level needed to provide a “balanced” energy budget. The total energy entering is made equal to the energy leaving. In this way it is now possible to calculate the effect of additional greenhouse gases. If it was not “balanced” and the “balance” varied it would be impossible to calculate.what are the effects of additional greenhouse gases.
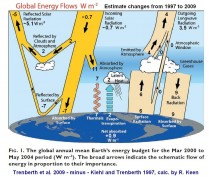
There has now been a change of heart, in the following paper: Trenberth, K E, J T Fassulo, and J T Kiehl. 2009 Earth’s Global Energy Budget. Bull Am. Met. Soc. 90 311-323. This paper does a complete reassessment of the figures in the first paper. Its amended version as a mean between March 2000 and May 2004 is attached (enlarged).
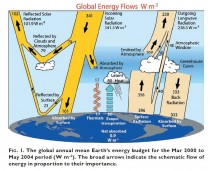
The earth is now thoroughly flattened, as if it had been run over by a cosmic steamroller. Most of the figures have changed. Those for input and output of radiation
are now apparently correct to one place of decimals. The rest of them are in trouble. The paper is full of discussions on how they could increase the “qualitative estimates” of uncertainty that might be attached to them, but this time they have found it impossible to extend their estimating ability sufficiently. So this time it is “unbalanced” to the extent of a warming of 0.9 Watts per square meter a year for the period 2000 to 2004.
Unfortunately there is no doubt that the earth’s temperature cooled over this period. This paper is therefore firm proof that the original concepts behind the models are wrong. It ought to be obvious. The earth does actually rotate. The sun does not shine at night. The temperature is not constant. Every part of the earth has a different energy input from its output.
There is a correct mathematical treatment. It would involve the division of the earth’s surface into a large number of tiny increments, and the energy input and output calculated for each one, using the changes in all the factors involved. There would then have to be a gigantic integration of all these results to give a complete energy budget for the earth. Only when this is done and repeated over a long period will it be possible to find the influence of increases in greenhouse gases.
The data do not exist for such an exercise and probably never will. Until then we will have to settle for the methods that have been developed by meteorologists over the past two centuries and hope that these can be extended over time to provide us with a means for assessing the effects of additional greenhouse gases on the climate.
The currently promoted greenhouse theory is dead and its consequences have to be removed at once.
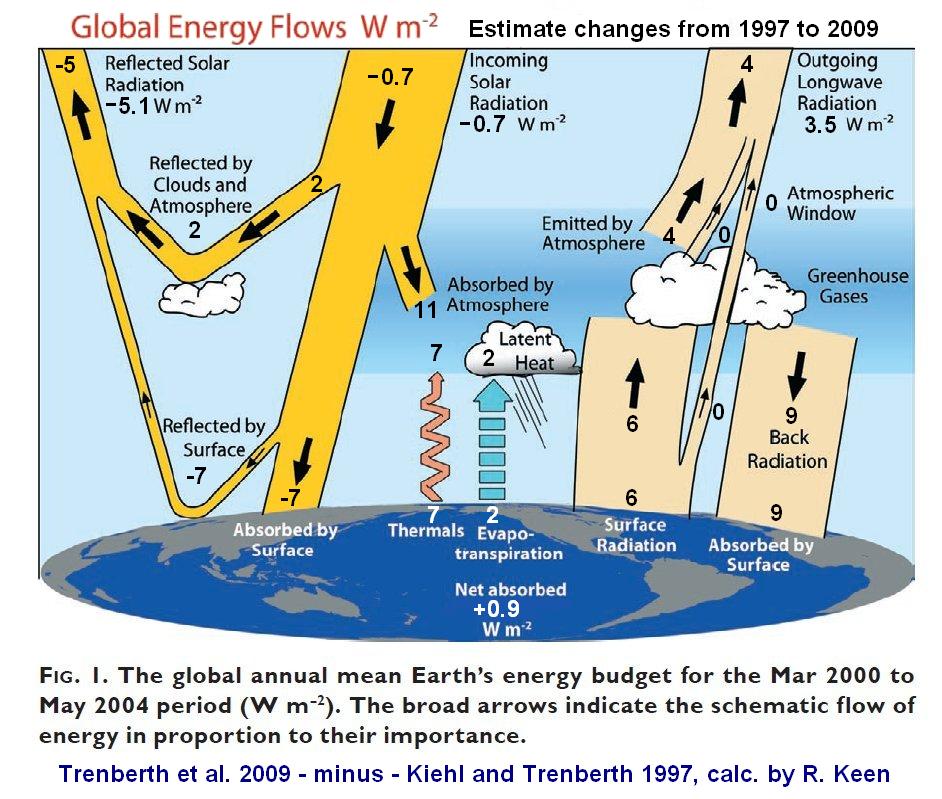
Comments by Dr. Richard Keen on the changed budget numbers and the “missing heat”:
Here’s the budget chart showing the changes from Kiehl and Trenberth 1997 to Trenberth et al. 2009. There are many ways to interpret these changes, one possiblity being that they show actual changes between the two base periods. Or, they may indicate the uncertainties inherent in each estimated value. Choosing the latter interpretation, one can see that each component of the budget has changed by up to 11 W/m2 (absolute value), with a mean change of 5 W/m2 (below, enlarged here).
There are 15 “independent” values listed (some are listed twice), although I’m sure the determinations are not truly independent of each other. If one takes the “Net Absorbed” value at the surface as being the residual sum (or average) of these 15 values, then the uncertainty of this residual would be the standard error of the mean, or roughly the mean error of each of the 15 values divided by the square root of N (15). That gives an uncertaintly of 1.3 W/m2 for the value of 0.9 W/m2 for the “Net Absorbed”. Thus, using Trenberth et al.’s statistics, the “Net Absorbed” could be a “Net Emitted”, and the value is indistinguishable from zero. Perhaps that is where the “Missing Energy” is.
Vincent Gray responds back: For the 2009 amended curve they kid themselves that they have better measurements for all the parameters, and that they have been unable to “stretch” their “informed” estimates of the uncertainties sufficiently to get a “balance”. and they get a warming. In reality there would still be a complex distribution curve with warming and cooling almost equally possible. The reality of this complex diffuse distribution curve could never be admitted because it means that the models are meaningless. Trenberth has almost got round to this point when he admits in his ClimateGate Email, that it is a “travesty” (ICECAP NOTE: Kevin Trenberth says they can’t account for the lack of recent warming and that it is a travesty that they can’t.(1255352257) and Kevin Trenberth says climatologists are nowhere near knowing where the energy goes or what the effect of clouds is. Says nowhere balancing the energy budget. Geoengineering is not possible.(1255523796)).