

By Anthony Watts, Watts Up With That
First this news: The Ap Index continues to fall. While the January 2009 data is not out yet, the December 2008 data is and is an Ap value of 2 according to SWPC. While this number may be lower than other sources (Leif will fill us in I’m sure), I’m plotting it for consistency since Ive been following the SWPC data set for well over a year now.
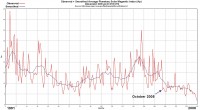
I’ve pointed out several times the incident of the abrupt and sustained lowering of the Ap Index which occurred in October 2005. The sun has been running at a lower plateau of the Ap index after that event and has not recovered. It is an anomaly worth investigating.
From the data provided by NOAAs Space Weather Prediction Center (SWPC) you can see just how little Ap magnetic activity there has been since. Here’s a graph from December 2008 showing the step in October 2005:
See larger image here.
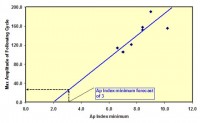
Additionally David Archibald writes with a new idea on how to use the Ap Index to predict the maximum amplitude. See below. In late January, I contributed a post predicting that the Ap Index would have a minimum of 3 in late 2009. There is a good correlation between the aa Index at minimum and the amplitude of the following solar cycle. This also holds for the Ap Index:
See larger image here.
The Ap prediction results in a prediction of maximum amplitude for Solar Cycle 24 of 25. This would be the lowest result since the late 17th century. See post and comments here.
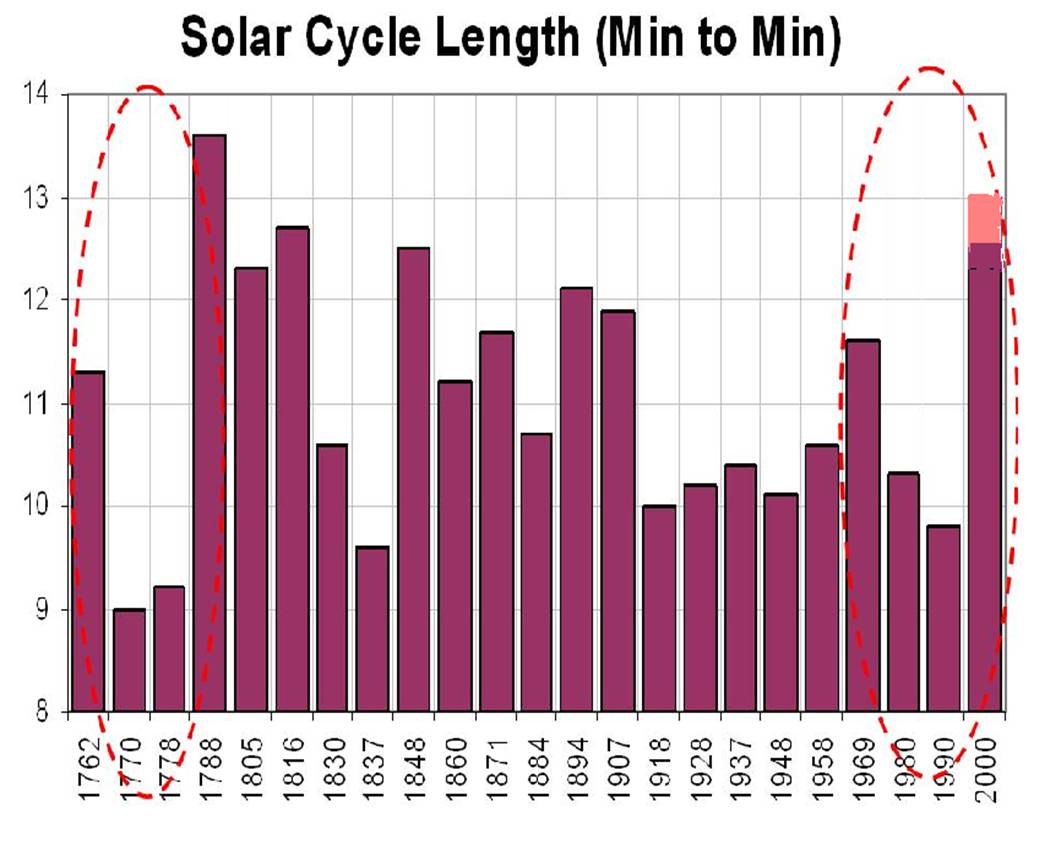
Icecap Note: Solar cycle length is still not determined, but it is at least 12.4 years. The cycles 20-23 look a lot like cycles 1 to 4. This would make it similar to the late 1700s as Anthony noted.

Larger image here