


SPPI blog
Source: Somewhat Reasonable a mann
Michael Mann Redefines Science
In a post over at Peter Guest’s blog, Michael “Hockey Stick” Mann is quoted making one of the most remarkable statements that I’ve ever heard coming out of a supposed scientist’s mouth:
“Proof is for mathematical theorems and alcoholic beverages. It’s not for science.”
He goes on to explain that science is all about “credible theories” and “best explanations” and his gosh-darn critics supposedly don’t offer up any of those.
Now it seems pretty obvious that Mann’s attempt to separate proof from science stems from increasing public awareness that the warming predicted by the high-sensitivity models that Mann and others have championed just hasn’t occurred over the last fifteen years. No matter. You don’t need “proof” when you have “credible theories.”
That comes as something of a shock to me. When I was going to school to earn my degree in chemistry, we were taught that science was indeed all about absolute truths and proofs at the end of the day. “Credible theories” is how you got to those truths, not an alternative to them.
The proposition that phlogiston made combustion possible was a “credible theory” for a long time, until Lavoisier conclusively “proved” that oxidation was responsible. Before USEPA approves the use of an air pollution dispersion model, real world data that “proves” the model can successfully and accurately determine dispersion patterns is necessary. Climatologists, apparently, do not suffer under similar uncomfortable burdens.
And the problem here is that guys like Mann, Jones, Gore, etc. have been running around for years, essentially presenting their hyper-sensitive version of climatology as established, unquestionable fact. I can’t count the number of times that AGW-heads have told me that “climate change is an established, scientific fact!” (Which it is of course, but not in the sense that these knuckleheads use the phrase).
Guest laments that:
Bound by honesty, the scientific consensus (sic) is going to struggle to overcome this problem, appearing unable to actually back up its results with tangible events…
Cross out the word “appearing” and you have as concise a statement of the problems that alarmists like Mann increasingly face with each passing day.
Appropriate response to Mann’s new “science”
Guest also calls the US the world’s biggest carbon emitter, a position we’ve surrendered to China some time ago, while Mann moans that his critics have “...delayed the necessary reductions in carbon emissions for decades...” I don’t know whether to conclude Mann is stupid, lazy or willfully ignorant, but EPA data clearly shows that the United States has been making massive reductions in carbon dioxide emissions since 2008 and the combination of new CAFE standards, EPA-forced coal-fired power plant retirements and state renewable portfolio standards ensure that these reductions will continue far into the future.
Good Lord! The guy got what he wanted and he’s still whining. Michael, if you want to sell your doomsday routine, take your act to Beijing or Delhi, there’s nothing left to do in the states short of going Flintstones.
This Mann-love comes as the enviro-left takes pot-shots at the brilliant conservative writer Mark Steyn, who made the mistake of not only questioning Mann’s theories, but had the effrontery to do so utilizing satire. The thin-skinned climatologist is in the process of suing Steyn, National Review and the Competitive Enterprise Institute, apparently for both hurting his feelings and for pointing out that “credible theories” do not equate to either proof or truth.
The whacky world of climate alarmism is falling apart. The leading acolytes of the movement will continue to wail that it’s all the fault of those evil energy interests that supposedly make fellows like me question the theology of AGW theory, but in reality they have no one to blame for their increasing irrelevance but themselves.
---------
Oh Mann..this can’t be good. Called a ‘charlatan and his gubernatorial pick linked to Solyndra
By Anthony Watts, WattsUpWithThat
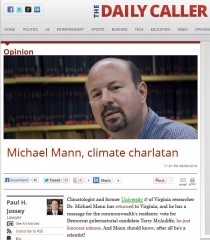
Climatologist and former University of Virginia researcher Dr. Michael Mann has returned to Virginia, and he has a message for the commonwealth's residents: vote for Democrat gubernatorial candidate Terry McAuliffe, he just looovess science. And Mann should know, after all he's a scientist!
Science is the pursuit of knowledge through logic, reason, and experimentation. We derive knowledge from testing and retesting falsifiable hypotheses. When new evidence proves, disproves, or casts serious doubt on a theory, science mandates the flexibility to adapt to changed circumstances.
But Dr. Mann leads a cabal of scientists who refuse to accept these basic premises. They defend old theories and promote accompanying policy prescriptions with a strident rigidity and dogmatism that would make the most fundamentalist religious zealot blush.
Whatever Mr. McAuliffe's love for the pursuit of discovery that lies at the foundation of scientific exploration, Dr. Mann may not be the best authority. His partisanship, indignation toward critics, and apparent refusal to alter his hypothesis despite contrary evidence hardly speaks to high-minded scientific ideals.
But the situation is more delicate for those who gained their notoriety, made their reputations, and received their government funding on the old "sky is falling" model. For them acknowledging new facts means admitting the major possibility they were wrong. This includes conceding policy prescriptions based on their work may be draconian, counterproductive, and in the end vastly harmful to poorest of the world's population. The ethanol disaster is but one example of "consensus" science taking food off the table for no discernible reason. These admissions would be a tough pill to swallow but ones a true scientist would embrace.
Read more here.
Meanwhile Watchdog.org reports:
Virginia gubernatorial candidate Terry McAuliffe and three top GreenTech advisers met with the key White House aide responsible for helping bankrupt solar-panel maker Solyndra win federal loans and high-profile presidential support, a Watchdog investigation has revealed.
What they discussed in the Oct. 12, 2010, meeting with Obama “green energy” aide Greg Nelson is a mystery, the White House visitors log offers no details. But the confab came seven months after a stock transfer made McAuliffe a GreenTech majority owner and company chairman.
Read more.
See also the video FAST TERRY.
h/t to Junkscience.com
-------
Monckton to Mann: Forget personalities, science is about truth
Source: Christopher Monckton
Lord Monckton
The Editor, Richmond Times-Dispatch, August 15, 2013.
Sir,
Charles Battig did a great service to your readers by spreading truth about the now-collapsed climate scare. Michael Mann’s criticisms of him (August 5) were ill-founded. Attorney General Cuccinelli investigated Mr Mann under the Fraud Against Taxpayers Act 2000 because of what I shall delicately call the statistical peculiarities evident in Mr Mann’s “hockey stick” graph that had purported to abolish the medieval warm period and to show falsely that today’s quite normal global temperatures were unprecedented in 1300 years.
Mr Mann’s graph relied heavily upon the widths of tree-rings from bristlecone pines as a basis for estimating temperatures before we had thermometers, although these pines are unreliable proxies because the tree-rings widen not only when the weather is warmer but also when it is wetter and when there is more CO2 in the air. That kinda musses things up.
According to real scientists, the graph also gave extreme weighting to datasets that showed unusual 20th-century warming at the expense of those that did not. And the program that Mr Mann created to draw the graph would have shown the 20th century as unusually warm even if random red noise rather than real-world data were fed in. There were numerous other statistical curiosities. Mr Mann’s graph is perhaps the most laughable and widely-discredited object in the history of bad science supporting worse politics.
Most learned papers based on real-world data show that the medieval warm period was real, global, and warmer than the present. A spate of papers by computer modelers apparently confirming Mr Mann’s contrarian conclusion appeared with interesting suddenness after his paper was scientifically discredited. Many of the authors, according to an independent statistical report for the House Energy & Commerce Committee in 2006, were linked to Mr Mann by previous co-authorship. Hmmm.
Mr Battig did not criticize Mr Mann for his bad personality, though Mr Mann’s characteristically malevolent description of his opponents as “deniers” and “denialists” several times in his letter of reply would be illegal in Europe as being anti-Jewish, racialist hate-speech disrespectful of Holocaust victims. Certainly no real scientist would use such language. Mr Battig criticized Mr Mann for his flagrantly bad science, not his flagrantly bad manners. Science is not about personalities. It is about seeking truth. Mr Mann’s graph was not true. It was not science. It deserved criticism. It got it.
Besides, according to the satellites, notwithstanding record increases in CO2 concentration there has been no global warming at all for 16 years 8 months and counting. That is 200 months without so much as a flicker of global warming. The game is up and the scare is over.
Yours faithfully,
Monckton of Brenchley
By Dr. Gordon Fulks
Global warmers are forever calling those of us who disagree with them ‘deniers.’ This thinly veiled reference to the Holocaust and the murder of six million people is far from appropriate. Do skeptics deny the Holocaust and the science? Of course not, but it brings up an interesting question:
Who denies natural climate change?
Who denies the importance of variable solar irradiance and the possible importance of solar modulation of galactic cosmic rays?
Who denies that our Sun is a variable star?
Who denies that our oceans contain the vast majority of mobile heat on this planet and therefore dominate our climate, year to year and decade to decade?
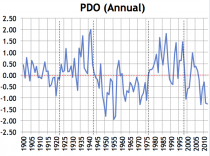
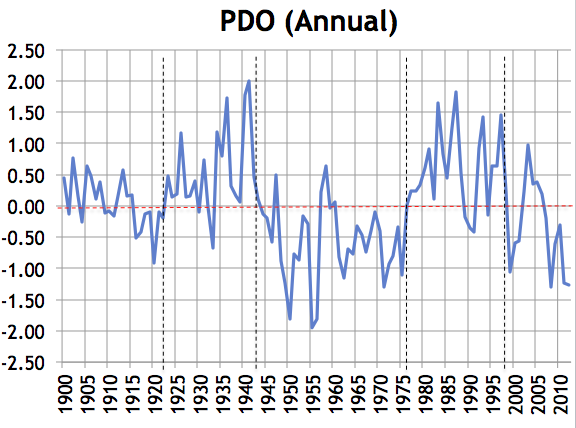
Who denies the importance of natural ocean cycles like the Pacific Decadal Oscillation (PDO), discovered by researchers studying salmon?
Who denies clear cyclical variations in our climate, easily traceable to ocean cycles?
Who denies that our recent warming commenced about 1830, long before significant burning of fossil fuels?
Who denies that ice core data clearly show that recent warming is consistent with previous warm periods, like the Medieval, Roman, and Minoan?
Who denies that CO2 lags temperature in the ice core data by as much as 800 years and hence is a product of climate change not a cause?
Who denies 150 years of chemical measurements of atmospheric CO2 that suggest that ice core reconstructions of past CO2 concentrations are low by 60 ppm?
Who denies that the global temperature went down for three decades after World War II, despite significant increases in human emissions of CO2 due to industrialization?
Who denies that water vapor is the primary greenhouse gas and by far the dominant climate gas, not CO2?
Who denies that increasing CO2 is a substantial benefit to plants and therefore helps us feed the seven billion people on this planet?
Who denies that our oceans are alkaline not acidic and can never turn acidic because of buffering?
Who denies that the EPA’s three “Lines of Evidence” supporting their Endangerment Finding on CO2 are all fatally flawed?
Who denies the leveling off of the Global Temperature for the past 15 years?
Who denies that the ‘Hotspot’ (required by Global Warming theory) does not exist in the tropical troposphere?
Who denies that all 73 computerized climate models are epic failures?
Who denies that theories which fail validation tests are dead?
Who denies the supremacy of evidence over theory?
Who denies the supremacy of logic and evidence over authority and consensus?
Who denies that Extreme Weather has always been with us and cannot be traced to CO2?
Who denies that the Climategate e-mails showed fundamental cheating by those scientists promoting Global Warming?
Who denies that many prominent scientists oppose climate hysteria?
In short, who denies both the science and the scientific method?
Gordon J. Fulks, Ph.D. lives in Corbett, Oregon, and can be reached at gordonfulks@hotmail.com. He holds a doctorate in physics from the University of Chicago, Laboratory for Astrophysics and Space Research. See Dr. Fulks PPT presentation on the EPA Endangerment finding.
By Steve Goreham
Climate science is in turmoil. Contrary to predictions by the world’s leading climate models and despite rising levels of atmospheric carbon dioxide, global surface temperatures have been flat for 16 years. How can it be that the climate models are wrong?
Last October, the UK Daily Mail announced that temperature data from the UK Meteorological Office showed no global warming for 16 years. In December, an advance chart from the upcoming Fifth Assessment Report of the Intergovernmental Panel on Climate Change showed a divergence between model projections and actual global temperatures. In January of this year, the Met Office revised their forecast of temperatures down to almost no increase over the next five years.
Media publications that have been staunch supporters of the theory of man-made climate change have noted the model failure. In March, The Economist stated, “The climate may be heating up in response to greenhouse gases less than was once thought.” The New York Times noted in June that the temperature slowdown “is a bit of a mystery to climate scientists.”
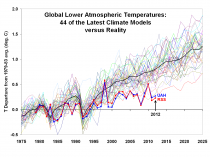
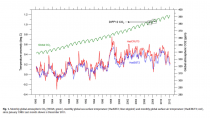
All major climate models have overestimated the effects of man-made warming. Analysis by Dr. Roy Spencer and Dr. John Christy shows that 44 of the world’s leading climate models projected an average temperature rise of about 0.5C during the last 16 years when measured temperatures were flat. The analysis was recently updated to include 73 of the leading climate models. Not a single model made an accurate forecast.
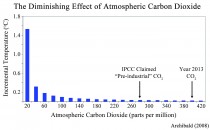
In any reasonable scenario, carbon dioxide can’t cause catastrophic global warming by itself. This is because the absorption of infrared radiation by CO2 is non-linear. The first 20 parts per million of CO2 in our atmosphere account for about one-half of the greenhouse warming from CO2. Adding more carbon dioxide has a diminishing warming effect. Doubling atmospheric CO2 from 280 ppm to 560 ppm, whether from natural or man-made causes, would by itself increase Earth’s surface temperature by only about 1.2C.
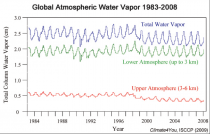
So how do the climate models reach their alarming conclusions? They assume that positive feedback from water vapor will cause additional warming. The argument is that, since warmer air can hold more moisture, water vapor will increase in the atmosphere as Earth warms. Since water vapor is a greenhouse gas, additional water vapor will add additional warming to that caused by CO2.
The assumption of positive feedback from water vapor has been integral to the climate models since the 1960s, when Dr. Syukuro Manabe developed one of the first models. As part of his model, he assumed that global relative humidity remained constant as the atmosphere heated up. This meant that the atmosphere would hold increasing amounts of water vapor, adding additional greenhouse heating to that of carbon dioxide.
But, satellite data shows atmospheric water vapor to be relatively constant over the last 30 years. In addition, peer-reviewed papers by Lindzen and Choi (2011) and Spencer and Braswell (2010) show that climate system feedbacks are likely to be low or even negative. Rather than adding to the warming, water vapor and clouds may even act to reduce warming from rising atmospheric CO2.
It appears that the models have relied on a “flea wagging the dog” assumption. Forces driving Earth’s water cycle, which includes weather and the oceans, are many orders of magnitude more powerful than the ebb and flow of carbon dioxide into our atmosphere. A large hurricane releases heat energy at a rate of one exploding 10-megaton nuclear bomb every twenty minutes. The idea that the atmospheric level of CO2, a trace gas, is controlling weather and the water cycle is improbable. The idea that mankind’s relatively tiny CO2 emissions impact the water cycle is preposterous.
As Dr. Spencer pointed out in his recent congressional testimony, US policies to fight climate change are based on failed climate model projections. Suppose we re-think our misguided war on climate change?
Steve Goreham is Executive Director of the Climate Science Coalition of America and author of the book The Mad, Mad, Mad World of Climatism: Mankind and Climate Change Mania.
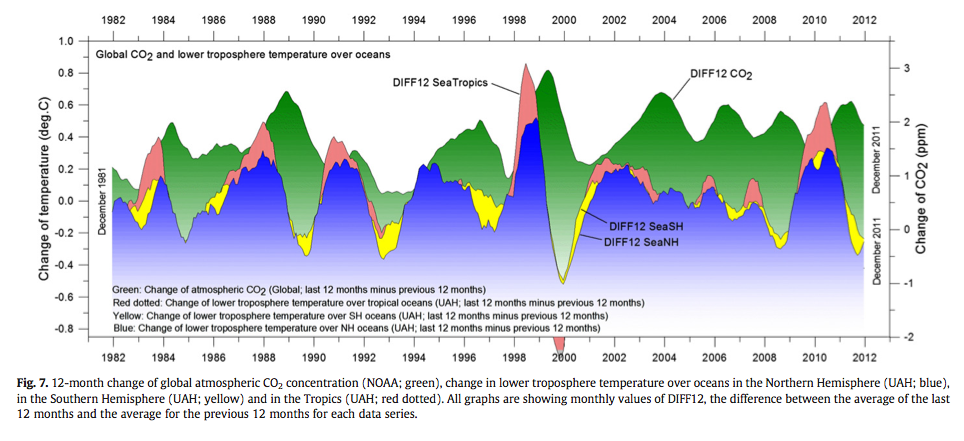
Ole Humlum et al, Elsevier Journal of Global and Planetary Change
Abstract
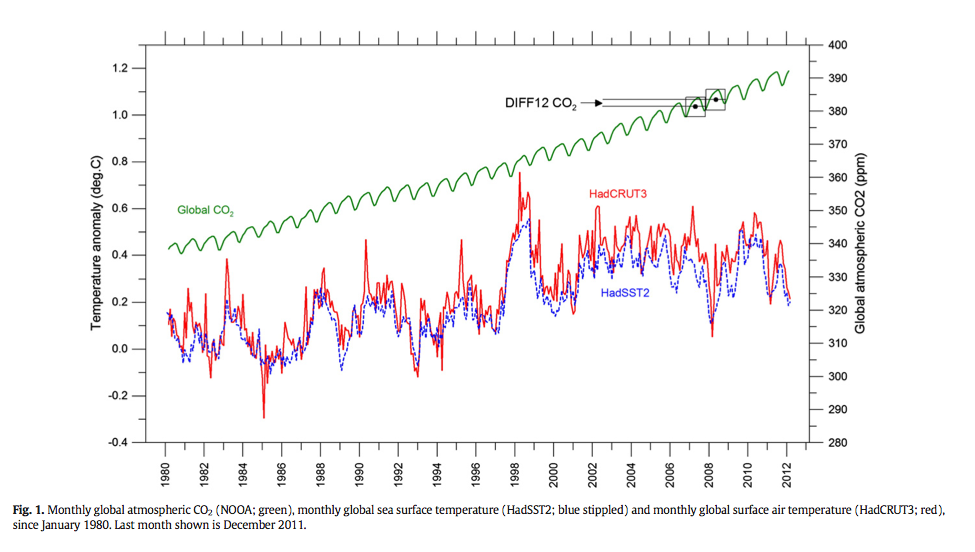
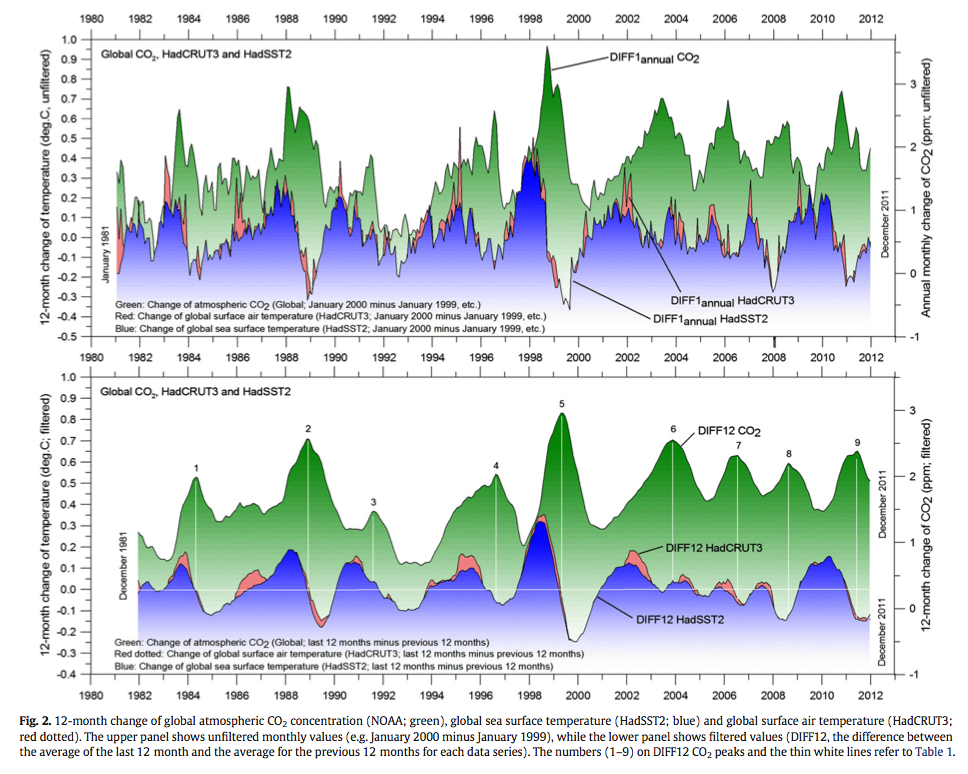
Using data series on atmospheric carbon dioxide and global temperatures we investigate the phase relation (leads/lags) between these for the period January 1980 to December 2011. Ice cores show atmospheric CO2 variations to lag behind atmospheric temperature changes on a century to millennium scale, but modern temperature is expected to lag changes in atmospheric CO2, as the atmospheric temperature increase since about 1975 generally is assumed to be caused by the modern increase in CO2. In our analysis we use eight well-known datasets: 1) globally averaged well-mixed marine boundary layer CO2 data, 2) HadCRUT3 surface air temperature data, 3) GISS surface air temperature data, 4) NCDC surface air temperature data, 5) HadSST2 sea surface data, 6) UAH lower troposphere temperature data series, 7) CDIAC data on release of anthropogene CO2, and 8) GWP data on volcanic eruptions. Annual cycles are present in all datasets except 7) and 8), and to remove the influence of these we analyze 12-month averaged data. We find a high degree of co-variation between all data series except 7) and 8), but with changes in CO2 always lagging changes in temperature. The maximum positive correlation between CO2 and temperature is found for CO2 lagging 11 to 12 months in relation to global sea surface temperature, 9.5 to 10 months to global surface air temperature, and about 9 months to global lower troposphere temperature. The correlation between changes in ocean temperatures and atmospheric CO2 is high, but do not explain all observed changes.


Conclusions
There exist a clear phase relationship between changes of atmospheric CO2 and the different global temperature records, whether representing sea surface temperature, surface air temperature, or lower troposphere temperature, with changes in the amount of atmospheric CO2 always lagging behind corresponding changes in temperature.
(1) The overall global temperature change sequence of events ap- pears to be from 1) the ocean surface to 2) the land surface to 3) the lower troposphere.
(2) Changes in global atmospheric CO2 are lagging about 11 to 12 months behind changes in global sea surface temperature.
(3) Changes in global atmospheric CO2 are lagging 9.5 to 10 months behind changes in global air surface temperature.
(4) Changes in global atmospheric CO2 are lagging about 9 months behind changes in global lower troposphere temperature.
(5) Changes in ocean temperatures appear to explain a substantial part of the observed changes in atmospheric CO2 since January 1980.
(6) CO2 released from anthropogene sources apparently has little influence on the observed changes in atmospheric CO2, and changes in atmospheric CO2 are not tracking changes in human emissions.
(7) On the time scale investigated, the overriding effect of large volcanic eruptions appears to be a reduction of atmospheric CO2, presumably due to the dominance of associated cooling effects from clouds associated with volcanic gases/aerosols and volcanic debris.
(8) Since at least 1980 changes in global temperature, and presumably especially southern ocean temperature, appear to represent a major control on changes in atmospheric CO2.
By Julia A. Seymour, Media Research Center
Recent years’ slowdown in global warming completely ignored by networks 92 climate change stories in 2013.
Stories citing experts or the latest studies promoting alarmism get covered more than 8 times as often as critical experts and studies.
Although many scientists say no, ABC, CBS and NBC continue to link weather events like tornadoes, hurricanes, heat waves and more to climate change nearly one-fourth of the time.
President Barack Obama’s new climate change initiative will purportedly share “a national plan to reduce carbon pollution, prepare our country for the impacts of climate change and lead global efforts to fight it.” Although he intends to demand action, most Americans do not see climate change as a “major threat,” according to Pew Research.
The Washington Post reported Obama will include “a plan to limit carbon-dioxide emissions from existing power plants.” That’s an agenda item the media will love. It was just a month ago when CBS “This Morning” interviewed Time magazine senior writer Jeffrey Kluger on May 11 who said “we have to curb the use of fossil fuels.”
No doubt the broadcast networks will cheer the president’s efforts, since they’ve spent years warning of the threat of climate change, even in the face of science that challenges their view. This year they’ve worried about many things including “raging infernos, surging seas, howling winds,” reported alarmist claims that weren’t accurate and connected weather to climate when scientists disagree. The networks have also completely ignored the “lull” in warming in recent years, in all 92 stories about climate change they reported in 2013.
One ABC report was typical, warning: “Many cities had record warmth, including Washington, D.C. where a lack of action on manmade climate change is likely to mean 2012 is just a glimpse into an unpleasant future, according to many scientists.”
Just since Jan. 1, 2013, ABC, CBS and NBC morning and evening news programs have aired 92 stories about “climate change” or “global warming.” Not a single one of those stories mentioned the “warming plateau” reported even by The New York Times on June 10. The Times wrote, “The rise in the surface temperature of earth has been markedly slower over the last 15 years than in the 20 years before that. And that lull in warming has occurred even as greenhouse gases have accumulated in the atmosphere at a record pace.” Even though the Times piece wasn’t published until June 10, a warming slowdown had been reported by foreign media outlets in November 2012, and by The Economist online in March, Reuters in April and BBC online in May of 2013.
The problems with climate forecasting models were’t mentioned either, even though a researcher at Sweden’s University of Gothenburg found that many climate models couldn’t correctly model known temperatures in China. Investor’s Business Daily reported on March 28 that “Only half of the 21 analyzed climate models were able to reproduce the changes in some regions of China,” he said. “Few models can well reproduce the nationwide change.”
In an interview with Der Spiegel on June 20, German climate scientist Hans von Storch of the Meteorological Institute of the University of Hamburg pointed to the major problems of climate modeling. “So far, no one has been able to provide a compelling answer to why climate change seems to be taking a break. We’re facing a puzzle. Recent CO2 emissions have actually risen even more steeply than we feared. As a result, according to most climate models, we should have seen temperatures rise by around 0.25 degrees Celsius (0.45 degrees Fahrenheit) over the past 10 years. That hasn’t happened. In fact, the increase over the last 15 years was just 0.06 degrees Celsius (0.11 degrees Fahrenheit)—a value very close to zero. This is a serious scientific problem that the Intergovernmental Panel on Climate Change (IPCC) will have to confront when it presents its next Assessment Report late next year,” he explained.
The Media Research Center’s Business and Media Institute looked at all the “climate change” or “global warming” stories from Jan. 1, 2013, through June 15, 2013, aired on ABC, CBS and NBC morning and evening news programs. BMI found that out there were more than 8 times as many stories that cited a study or included a scientist promoting global warming alarmism than cited a study or included a scientist challenging alarmism (25 stories to 3 stories). Nearly one-fourth of the stories this year (22 of 92) also connected (or at least asked if there was a connection) weather events like hurricanes, tornadoes, snow or flooding to climate change, in spite of the many scientific critics of those claims.
Of course in 2010, when the weather seemed to contradict the message of global warming alarmism Jane Lubchenco, head of the National Oceanic and Atmospheric Administration, said, “It is important that people recognize that weather is not the same thing as climate.”
8 Times the Alarmism
New reports, studies or scientists that warned of the threat of climate change from concern over penguin populations, to predictions of sea level rise continued to be promoted by the networks in 2013. There were stories or news briefs warning that flying would become more turbulent because of climate change, connecting allergies to global warming, and others worrying about glacial melt and sea level rise.
There were 25 networks reports that mentioned a new report or analysis or that cited a scientist who promoted the climate alarmist viewpoint. That was 8 times as many as the other side; there were only three stories that cited a report or included such a scientist challenging alarmism.
The networks consulted scientists from NASA and NOAA as well as activists like Michael Oppenheimer from Princeton, who has gotten climate predictions wrong in the past. “Nightly News” interviewed Kenneth Kunkel from NOAA’s National Climatic Data Center on May 25 who continued the hype, saying “If we continue to increase atmospheric concentrations of greenhouse gases in the atmosphere, we will warm the globe and that will bring certain risks into play or increase the risks of certain types of extremes.”
The networks also included other people promoting alarmism who were not counted in this analysis because they weren’t on to discuss a new study and they aren’t scientists. Editors and reporters from Time magazine went on network broadcasts and hyped the threat of climate change. And NBC interviewed global warming activist and former Vice President Al Gore in three separate stories.
One of those times was Jan. 29, on “Today.” Matt Lauer and Gore were discussing Gore’s latest book and Lauer asked the former vice president about skepticism of the danger of global warming.
“I want to talk to you about some polling. If you talk to Americans, about four in five people in this country believe that climate change is happening, global warming is real and it’s going to present a problem. But there’s a group inside that large group, and it’s not an insignificant group, and they don’t believe that climate change is manmade or exacerbated by humans. Does that surprise you?” Lauer asked.
Gore then slammed anyone with a different point of view claiming that “there’s been a lavishly funded, well-organized effort to convince to try to convince people of falsehoods...”
In spite of science, networks continue to link weather to climate
Weather events that did a lot of damage and claimed lives, like the recent Oklahoma tornado and last year’s “Superstorm Sandy” were cited as incontrovertible proof of climate change. Scientists who argued otherwise were left out of the broadcasts. Even snowfall, wildfires and droughts were mentioned in some reports as examples of what one reporter called “globalweirding.”
On Jan. 8, NBC “Nightly News” anchor Brian Williams mentioned a new report on the cost of extreme weather saying “natural disasters caused a total of $160 billion damage around the world in 2012 ... These new numbers coincide with a new official look at just how hot our past year was.” Anne Thompson followed up his introduction by linking the “year of extreme weather” to “nature and man made climate change.”
Meteorologist Joe Bastardi has vehemently opposed such connections and told Forbes.com columnist Larry Bell, “The fact is that those alarmist claims [about weather getting more extreme because of man made climate change] simply aren’t true.”
Another natural disaster had NBC “wondering” on May 25. NBC’s Lester Holt cited the Moore, Okla., tornado saying it “has a lot of us wondering if things have gotten even more extreme than usual.” John Yang’s follow-up report mentioned “devastating tornadoes, Searing heat waves. withering droughts and related wildfires and powerful hurricanes.”
Yang later directly blamed weather on climate change citing “government scientists” who say it is at least “partly the result of manmade climate change.”
Just one day earlier, NBC’s Matt Lauer tried to get New Jersey Governor Chris Christie to blame Superstorm Sandy on global warming. He called it a “distraction.” But “Today’s” Al Roker had his mind made up about Sandy’s relationship with climate.
On April 3, Willie Geist, Natalie Morales and Roker were discussing a public policy poll of “20 widespread conspiracy theories.” One of those “theories” was that “global warming is a hoax.” Roker was astounded to learn that 37 percent of Americans “don’t believe in global warming,” and exclaimed: “Two words: Superstorm Sandy.”
CBS was less certain of the connection between Sandy and global warming, but the network was no less adamant that climate change is a problem. On the May 28 “Evening News” Norah O’Donnell said, “Earlier in the broadcast, we showed you the devastation caused by Superstorm Sandy. Whether climate change is to blame for it is the subject of debate. But there’s not doubt that the climate is changing. Dean Reynolds introduces you to some folks who are out to prove it.”
But was warming to blame for Sandy and for hurricanes as some have claimed? Professor of Environmental Studies Dr. Roger Pielke Jr. from the University of Colorado has said: “There is no evidence that disasters are getting worse because of climate change.” “There’s really no evidence that we’re in the midst of an extreme weather era – whether man has influenced climate or not,” Pielke added.
The networks made a big deal of the “extreme” weather and claims that 2012 was the “hottest year ever.” ABC’s Diane Sawyer said it was the hottest year the U.S. had seen, “hotter, not by a little, but by a landslide ... the red flags of warning about extreme heat all across the globe.”
Over on CBS “This Morning” May 24, Bryan Walsh of Time magazine was discussing the hurricane forecast for 2013. Charlie Rose said, “I assume there are many causes, but is climate change one of them?” Walsh declared that “It is one of them. I mean, scientists are always working on this. But what we think is that it does make these storms stronger if not more frequent.”
What he didn’t clarify is that hurricanes are not happening more frequently. In fact, NOAA data shows that hurricanes have been on the decline and the worst decade for category 3, 4 and 5 hurricanes in the U.S. was the 1940s.
The networks were wrong on both counts: extreme weather and the supposedly “hottest” year on record. NOAA had put out a press release about 2012 being the warmest year, but was only referring to the lower 48 states. That’s a big difference!
As for the supposedly “extreme” weather year of 2012, things were also not as they appeared. Strong tornadoes have been on the decline in the U.S. since the 1950s, and climatologist Roy Spencer pointed out that since there was warming during this time “Obviously, the conclusion should be that warming causes fewer strong tornadoes, not more (Or, maybe a lack of tornadoes causes global warming!).”
ABC’s “World News with Diane Sawyer” provided a rare admission on June 3 when Sawyer said, “a lot of us were wondering this weekend if climate change is somehow creating a lot more tornadoes than usual. The answer is no.”
Sadly, the networks’ bias on climate change has been happening for decades. In 2007, BMI found that global warming proponents overwhelmingly outnumbered those with dissenting opinions. On average for every skeptic there were nearly 13 proponents featured. ABC did a slightly better job with a 7 to 1 ratio, while CBS’s ratio was abysmal at nearly 38 to 1.
Another BMI Special Report, Fire and Ice, noted that print media have warned about impending climate doom four different times in 100 years. Only they can’t decide if mankind will die from warming or cooling. BMI conducted an extensive analysis of print media’s climate change coverage back to the late 1800s.
It found that many publications now claiming the world is on the brink of a global warming disaster said the same about an impending ice age - in the 1970s. Several major ones, including The New York Times, Time magazine and Newsweek, have reported on three or even four different climate shifts since 1895.
Methodology
The MRC’s Business and Media Institute analyzed all stories mentioning “climate change” or “global warming” on ABC’s “Good Morning America,” “World News with Diane Sawyer,” “World News Saturday” and “World News Sunday,” CBS’s “This Morning,” and “Evening News” and NBC’s “Today” and “Nightly News” from Jan. 1, 2013, to June 15, 2013. A few casual mentions, such as the mention of climate change in a a fashion story, were excluded from the analysis.
Joseph D’Aleo, Weatherbell Analytics
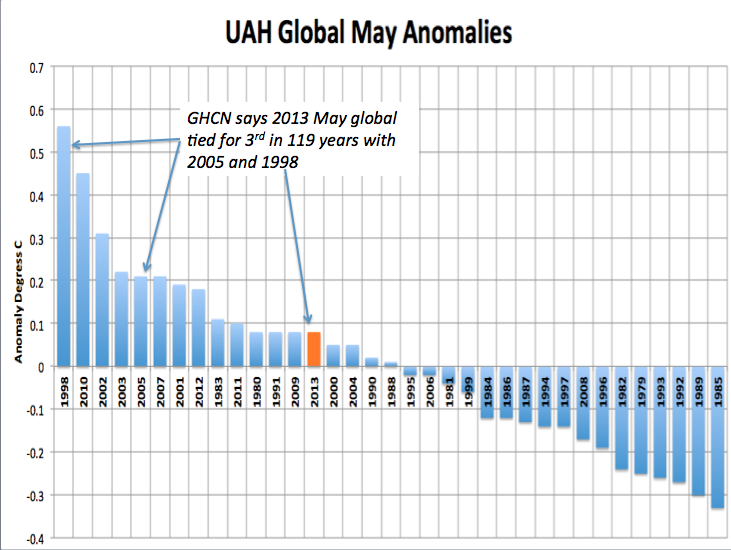
Global Highlights NOAA GHCN May 2013
The combined average temperature over global land and ocean surfaces for May 2013 tied with 1998 and 2005 as the third warmest on record, at 0.66C (1.19F) above the 20th century average of 14.8C (58.6F).
The global land surface temperature was 1.11C (2.00F) above the 20th century average of 11.1C (52.0F), also the third warmest May on record. For the ocean, the May global sea surface temperature was 0.49C (0.88F) above the 20th century average of 16.3C (61.3F), tying with 2003 and 2009 as the fifth warmest May on record.
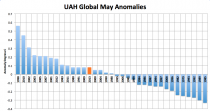
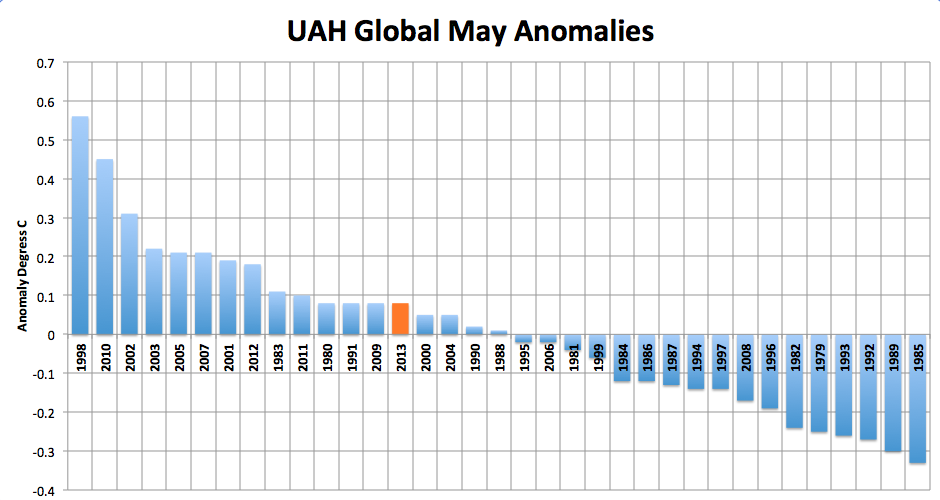
UAH Global Temperature Report: May 2013:
Global composite temp.: +0.07 C (about 0.13 degrees Fahrenheit) above 30-year average for May.
Northern Hemisphere: +0.16 C (about 0.29 degrees Fahrenheit) above 30-year average for May.
Southern Hemisphere: -0.01 C (about 0.02 degrees Fahrenheit) below 30-year average for May.
UAH Notes on data released June 4, 2013:
Global average temperatures and the tropics continued a slow cooling drift in May, downward from a warm January, said Dr. John Christy, a professor of atmospheric science and director of the Earth System Science Center (ESSC) at The University of Alabama in Huntsville.
Compared to seasonal norms, during May the coldest area on the globe was in northern Greenland, where the average temperature was as much as 3.75 C (about 6.7 degrees Fahrenheit) cooler than seasonal norms. Compared to seasonal norms, the “warmest” area on the globe in May was in the northern Siberia. Temperatures there were as much as 3.91 C (about 7.0 degrees Fahrenheit) warmer than seasonal norms for May.
It was tied for the 11th warmest out of 35 years of record:
In addition to the discrepancy in terms of ranking, the claim that GHCN was tied for third place with 1998 and 2005 is out of line with UAH which had 2013 very different from 1998.

RSS, the other satellite date set is colder than UAH and significantly colder than NOAA.
Even GISS from NASA (usually the warmest data set) was cooler by 0.10C than NOAA and actually the 5th coldest in the last 13 years!!!
Ryan Maue’s global anomaly for CFSv2 initializations is -0.024C

The government announced major plans for climate and energy policy will be forthcoming this summer. Looks like NOAA is trying to accommodate this. The data like most government data is said to be preliminary. We will continue to follow.
Anthony Watts
Andrew Freedman writes in this Tabloid Climatology piece at Climate Central:
When Hurricane Sandy struck New York City on October 29, 2012, the dark waters of Flushing Bay poured over the edges of LaGuardia Airport, flooding parts of the facility’s 7,000-foot long east-west runway, and damaging lighting and navigation systems. The floodwaters created an eerie image of jetways ending in water, as if they had been converted into boat ramps.
This was not the first time that LaGuardia suffered major flooding during a storm, nor will it be the last. Due to climate change-related sea level rise, LaGuardia and other coastal hubs throughout the U.S. face a growing risk of flooding during even modest storms.
Now, wait for it....here’s the fake picture they rendered to show what this might look like:

This is a ‘jumped the shark moment for Climate Central. Read the whole story here.
Gosh, I never knew that sea level rise was so abrupt that it would catch those speedy airliners off guard so fast they couldn’t move out of the way. The climate change onset was so fast...that maybe future archeologists will find fossilized passengers with half chewed peanuts still in their mouths.
By Paul Homewood
Originally, it was thought to be the coldest spring since 1962.

Winter? Teesdale in County Durham blanketed in snow on May 23 in what is likely to be Britain’s coldest spring since 1962.
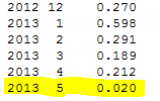
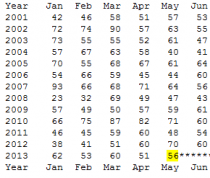
According to the Central England Temperature Series, England has just experienced its coldest Spring since 1891. The average mean temperature of 6.87C ranks the 31st coldest on records starting in 1659, and is 2 degrees lower than the 1981 to 2010 average of 8.9C.
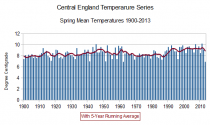
The 5-Year average has dropped to 8.9C, a level commonly seen in the 1940’s and 50’s. Although the cold Spring has been due in large part to the exceptionally cold weather in March, which was the coldest since 1892, both April and May have also been much colder than normal.
CET Warmer/(Colder) v 1981 to 2010
March 2013 2.7C (3.9)
April 2013 7.5 (1.0)
May 2013 10.4 (1.3)
Link
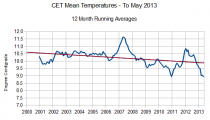
The 12-Month running average continues to drop, and at 8.9C is well below the levels seen for the last decade, and 1.0C lower than the 1981 to 2010 annual average.
-----------
US SPRING AT A GLANCE
Icecap update
Spring was cooler than average for a large portion of the contiguous United States east of the Rockies. Fourteen states, from North Dakota to Georgia, had spring temperatures that ranked among the ten coldest.
This was the first season since Spring 2011 not classified as “warmer than normal”, or in the warmest one-third of the historical distribution.
New England and the West were both warmer than average. California had its seventh warmest spring on record with a seasonal temperature 3.5F above average.
Spring brought both wet and dry precipitation extremes to the United States. Iowa had its wettest spring on record with 17.61 inches of precipitation, 8.63 inches above the seasonal average. Wetter-than-average conditions were observed in the Northern Plains and Midwest, where North Dakota, Minnesota, Wisconsin, Illinois, and Michigan each had one of their ten wettest spring seasons.
Below-average precipitation was observed in the Mid-Atlantic, Southern Plains, and West. New Mexico had its second driest spring with 0.66 inch of precipitation, 1.72 inches below average. California had its eighth driest spring, with 2.34 inches of precipitation, 3.33 inches below average.
The above-average precipitation and below-average temperatures in the north-central United States were associated with a spring snow cover extent that was above average. According to data from the Rutgers Global Snow Lab, the spring snow cover extent was the eighth largest on record and the largest since 1984.
TEMPERATURE
_thumb.gif)
PRECIPITATION
_thumb.gif)
_thumb.gif)
_thumb.gif)
ALASKA SPRING TEMPERATURES
They were the coldest since 1984.
_thumb.gif)
Alaska colder winters and springs are due to the cold PDO.
.gif)
.gif)
.gif)
.gif)
.gif)