


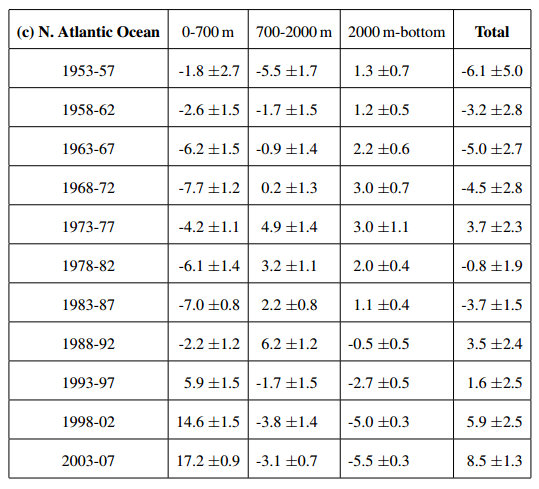
A new paper published in Nature Geoscience finds that the heat content of the North Atlantic Ocean decreased by 0.1 Joules over the 54 year period from 1953 - 2007. The paper is among the first to examine heat content changes along the entire vertical column of the ocean from bottom to surface. The paper adds to several others showing that Trenberth’s “missing heat” has not gone to the depths of the ocean, but rather never existed in the first place.
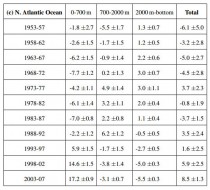
Table S1 (c) from the supplementary information. The total change in heat content for the N. Atlantic Ocean [20-66 degrees North] from the bottom to surface from 1953-2007 is - 0.1 Joules [sum of the right column]. Note this net change is much less than the range of uncertainty, but shows no evidence of “missing heat"” sinking to the deep ocean. The data instead shows the deep N. Atlantic Ocean has cooled since 1988, far beyond the range of uncertainty.
Importance of density-compensated temperature change for deep North Atlantic Ocean heat uptake, C. Mauritzen, A. Melsom & R. T. Sutton, Nature Geoscience (2012) doi:10.1038/ngeo1639 Received 05 July 2012 Accepted 22 October 2012 Published online 18 November 2012
Abstract
The efficiency with which the oceans take up heat has a significant influence on the rate of global warming. Warming of the ocean above 700 m over the past few decades has been well documented. However, most of the ocean lies below 700 m. Here we analyse observations of heat uptake into the deep North Atlantic. We find that the extratropical North Atlantic as a whole warmed by 1.45 plus/minus 0.5×10²² J between 1955 and 2005, but Lower North Atlantic Deep Water cooled, most likely as an adjustment from an early twentieth-century warm period. In contrast, the heat content of Upper North Atlantic Deep Water exhibited strong decadal variability. We demonstrate and quantify the importance of density-compensated temperature anomalies for long-term heat uptake into the deep North Atlantic. These anomalies form in the subpolar gyre and propagate equatorwards.
High salinity in the subpolar gyre is a key requirement for this mechanism. In the past 50 years, suitable conditions have occurred only twice: first during the 1960s and again during the past decade. We conclude that heat uptake through density-compensated temperature anomalies will contribute to deep ocean heat uptake in the near term. In the longer term, the importance of this mechanism will be determined by competition between the multiple processes that influence subpolar gyre salinity in a changing climate.
----------
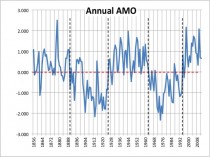
The Atlantic surface water 0 to 70N undergoes multidecadal changes.
By P Gosselin NoTricksZone
Michael Kruger at Readers Edition writes about sea level data from the NOAA.

NOAA INTERACTIVE SEA LEVEL CHART CLICK HERE
“We have to get used to the idea of a sea level rise of about one meter for this century,” announced Prof. John Schellnhuber in 2008, based on new findings. Other researchers, based on model computations, even claim 1.5 meters by the end of the century. That of course far exceeds the prognoses of the IPCC. But what does real data tell us?
The National Oceanic and Atmospheric Administration (NOAA) has an interactive graphic at its “Sea Levels Online” page that provides the locals trends for sea level rise (see above). You can check the trends based on tide gauges and calculate when Al Gore’s beachfront house will be flooded. Looks like it’s going to take hundreds of years.
At most coastal locations, sea level is rising just 0-3 mm/year, which is 30 cm per century or less, i.e. in the lower range of IPCC forecasts. This is the case for the German North and East Sea coastal areas.

For the German North Sea port-city of Cuxhaven, the rise is approx. 2.5 mm/year. There are areas where sea level is actually dropping.
Interestingly in the northern Adriatic Sea (near Rovinj), sea level rise is a mere 0.5 mm/year, which makes media claims that Venice is sinking into oblivion due to sea climate change pure absurdity. The city is struggling with a sinking ground, and that has little to do with climate.
What’s more, a letter to the editor from EIKE meteorologist/scientist Klaus Eckard Puls appears in today’s daily OstSee Zeitung.
In it he writes about the prophesies of sea level doom and gloom - from the bedwetters, like the PIK, for example - and compares them to reality:
“Nature is behaving completely differently from what the prophets would like to have us to believe. Global temperature hasn’t risen in 14 years, and instead even shows a decreasing tendency. Thus the CO2 climate hypothesis is in a free-fall. Moreover, the sea levels, which have been rising for 10 thousand years, show no acceleration whatsoever globally, in stark contrast to the IPCC prognoses. There are many locations where the sea level trend has slowed down, like at the North Sea.”
By Steve Goddard
Twitter / oakden_wolf: @ClimateDepot I think
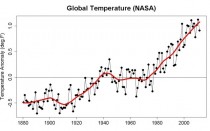
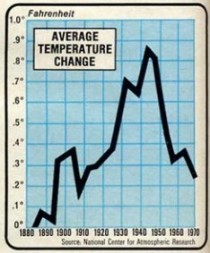
Here is the graph he linked to. Note how temperatures were flat from 1930 to 1980.
This is what temperatures looked like in 1975 – according to NCAR
By Joe D’Aleo, CCM, AMS Fellow H/T SEPP
Frequently in stories and congressional testimony we hear that 97% of the world’s scientists agreed that man is the driver of the climate and that the warming in unequivocal.
During the US Senate Environment and Public Works Committee hearing held August 1st on “Update on the Latest Climate Change Science...” much was made of that statement that 97% of scientists agree that global warming is occurring and humans are the cause. Senator Sessions expressed skepticism about the statement and was somewhat belittled for his disbelief.
Apparently, the poll being referenced was one published in EOS on January 20, 2009. EOS is published by the American Geophysical Union and bills itself as: “The premier international newspaper of the Earth and space sciences, EOS seeks to forge strong interdisciplinary ties among geophysicists and place the important contributions of geophysics in the context of the social and policy-making arenas”.
The researchers sent an online survey to 10,257 Earth scientists working for universities and government research agencies, and generated responses from 3,146 people to the following questions.
Q 1. :When compared with pre‐1800s levels, do you think that mean global temperatures have generally risen, fallen, or remained relatively constant?”
Q 2. Do you think human activity is a significant contributing factor in changing mean global temperatures?”
Few who have studied climate change would object to the first. Certainly the earth is warmer than during the Little ice Age.
Most skeptics would object or disagree on the second. If one includes urbanization and land use changes such as deforestation and irrigation, certainly, man affects local even regional climate often in a significant way.
The researchers then boiled down the numbers to those who self identified themselves as those who listed climate science as their area of expertise and who also have published more than 50% of their recent peer-reviewed papers on the subject of climate change (79 individuals in total).
Of these specialists, 96.2% (76 of 79) answered ‘risen’ to question 1 and 97.4% (75 of 77) answered ‘yes’ to question 2.
Thus, the touted 97% figure is based on the responses of 0.75% of those polled, just 77 to 79 scientists, certainly a minute fraction of 5.8 million scientists (AAAS). And the questions asked are ones even the most ardent skeptics may have answered yes.
This is one more study that qualifies for inclusion in an update of the classic, How to Lie with Statistics.
The American Meteorological Society issued its information statement last month asserting again that warming in unequivocal and man is solely responsible due to CO2. It was drafted by a handpicked group of scientists in a stealth committee (the AMS will not divulge the names), claiming the statement belongs to the 11,000 members and they have input. BULL. Many of us submitted lengthy rebuttals to the draft in the 30 day comment period, citing our own and other peer reviewed papers that challenged the many claims made and insisting the AMS include the oceans and sun as factors as many of these peer reviewed papers showed was the case ‘unequivocally’. These member comments were rejected or ignored and no substantive changes were made. The statement was timed for the election as a tool for the party in power to use to keep the environmentalists on board and the money flowing. The AMS has advocacy of public policy as one of its primary goals. When I was a councilor in the 2000s I argued that the society ought to advocate good science and not policy. There are already many organizations dealing with policy. but the society is catering to its many academics who have never had such a windfall of grant money. Even those discredited in the community have the money flowing as long as they are on the right (really the left) side of the issue. Skeptics are accused of being in it for the money and funded by big oil. They used to claim Exxon gave $23 M in the 1990s to skeptics. Well big oil has gone to the dark side. Exton gave $I00M to Stanford and BP $500M to UC Berkeley to study global warming.
Dennis Ambler identified some EPA grants to various organizations, some of which may be questionable to some members of Congress. Grants include topics such as environmental justice, climate change, models, and foreign grants. Almost $5 million went to the UN Environmental Programme, including promoting environmentally sound management worldwide and global environmental agreements. Other grants include $10,476,856 over 5 years to AAAS “To establish and nurture critical links between decision-makers and scientific professionals to support public policy that benefits society” (lobbying); $4,437,241 to AAAS over five years to establish fellowships under the EPA. Not to be left out, $20,405,655 in the last 10 years went to the American Lung Association, which lobbies heavily for more EPA regulations; $1,277,500 to the Institute for Governance and Sustainable Development; and $1,150,123 to Natural Resources Defense Council (3 years) for sustainable change.
It has been estimated $10 Billion dollars has gone to fund this one sided science. The US government shells out $7B of your tax dollars each year to its agencies to study and develop policy about global warming. The administration (Hillary Clinton for Barach Obama) has promised $100B be given to the UN for it’s efforts on climate the next decade.
Scientific American polled its readers and found that about 16% believe the U.N. IPCC to be credible, while 84% believe the IPCC to be “a corrupt organization, prone to groupthink, with a political agenda”. Indeed the UN agrees. Its own spokesman Otmar Edinhofer admitted that climate policy is not about the environment but it is about redistributing the worlds wealth.
Former grant recipients who are not believers or are more open minded who used to be funded for their work have been shut off (Dr. Gray for example had all his NSF hurricane forecasting and research dollars cut when he stated that variations in the AMO not CO2 was responsible for the increase in Atlantic Basin storms since 1995. I have been told by other researchers at the universities that look into solar and ocean and land use factors and not CO2 have also had their funding shut down. In one case, a professor told me he may have to return to his own country (Italy) as he can’t survive on his part time teaching salary alone. He gets no funding even though he publishes multiple papers a year, good enough to pass the peer review barrier.
The NSF has been told not to fund deniers. Eisenhower was very prescient in his Farewell address about this threat half a century ago. The speech was remembered more for his comments on the Military industrial complex threat but he saw the same dangers in the world of science. Listen to the whole address. The man was Nostradamus-like on this topic.
The scientific method has been abused and ignored in the process of preserving the grant gravy train. Physicist Richard Fineman described how it is SUPPOSED to work.
Charles Battig
The article “Hostile Climate: Will Cuccinelli and the anti-science crowd ever learn?” [July 10] by Dan Catalano one brief statement with which those more fully informed on the topic of climate might agree. In his reference to a Washington Post article, he notes that it “lays out the case far more cogently than we ever could.” The rest of his article validates the truth of this self-assessment.
That Washington Post article “Feeling the Heat” was written, not by a science writer, but by a self described “opinion writer,” who at least did admit to some uncertainties in his various catastrophic climate claims, and incomplete data references. He notes that NASA reports that CO2 levels are 35 percent higher than in 1880, with most of the increase coming since 1960, but neglects to mention that most of the global warming had already occurred before the 1950s. He invokes images of rising sea levels without the benefit of contrary satellite data documenting a recent reduction in sea level rate-of-rise. He mentions polar ice (Arctic and Antarctic combined), butnot that they are in relative long-term equilibrium.
Mr. Catalano, and an unidentified “we,” seem to have put a thesaurus to the test in finding the maximum number of frightening terms to wordsmith over a lack of scientific data and supporting evidence, “due to limited space.” “Willfully ignorant,” “criminally negligent,” “evidence is irrefutable,” and “fighting a losing battle against extinction” terminology casts his article into the political propaganda category, the culmination of which is to launch a diatribe against Attorney General Ken Cuccinelli.
I too have a limited space in which to reply to this article; however, it is possible to enumerate some facts. The Washington Post and Mr. Catalano both use this recent storm to validate man-made “effects on global weather.” To date, there is no widely accepted, scientifically validated study to prove the linkage between man-made C02 and catastrophic climate changes. There has been a 15 year hiatus in the satellite-derived atmospheric temperature rise, even as CO2 levels continue to rise.
The term derecho is not new, but was first described by Gustavus Hinrichs in 1888, and was revived by Robert powerful one occurred July 4, 1977, during a period of global cooling. Johns and William Hirt in 1987. NOAA data indicate that Virginia should expect one of these every four years.
A review of available climate data (although itself often incomplete and inaccurate) back to the 1800s shows that recent U.S. droughts and heat waves are neither new nor extraordinary. The 1930s Dust Bowl era documents temperatures and droughts far more extreme than at present. The Medieval Warm Period (1000 AD-1300 AD) had temperatures the equal or higher of those today. Legal opinions, such as the referenced Washington Appeals Court, do not define scientific validity, but only a legal opinion. Mr. Bumble in Dickens’ Oliver Twist had his own opinion of the law. The climate is not hostile, but Mr. Catalano appears so.
Joanne Nova
How independent is this project?
Would BEST have ever seriously published a study showing anything other than a scary warming trend?
This is emblematic of how fans of Climate Change Scares present their efforts with half-truths - lines that are technically “correct” but leave an impression that may be the opposite of the real situation.
Elizabeth Muller is listed as “Founder and Executive Director” of the Berkeley Earth Team along with her father Richard Muller. But since 2008 it appears she’s been earning money as a consultant telling governments how to implement green policies, how to reduce their carbon footprint and how to pick “the right technologies” - presumably meaning the right “Green” technologies.
Mullers Daughter Elizabeth registered “GreenGov” in 2008
Richard and Elizabeth Muller. Image: Paul Sakuma/AP
She registered their website and tried to register the trademark herself.
“GreenGov is a service offered by Muller & Associates for Governments, International Organizations, non profits, and other organizations that work with Government. The aim is to provide politically-neutral counsel that is broad in scope while rooted in the hard facts of state-of-the-art science and engineering. The key is to make the right patch between the best technologies and the strengths of the government. We know that to be effective the political dimension must be integrated into the technical plan from the start.”
Muller and Associates helps investors profit from investments in alternative energy.
From her “speakers profile”:
“GreenGov provides interdisciplinary knowledge that helps clients determine the best technology for their specific need. Elizabeth has designed and implemented projects for public sector clients in the developed and in the developing world, helping them to build new policies and strategies for government reform and modernization, collaboration across government ministries and agencies, and strategies for the information society. She has developed numerous techniques for bringing government actors together to build consensus and implement action plans, and has a proven ability to deliver sustainable change in government.”
“Green can be profitable”
“Making Green ICT a Government priority”
“It’s not just about reducing the Carbon footprint for information and communication technologies - though this is also important. But the real breakthrough for Green ICT will be in helping build consensus among stakeholders, and to bring clarity and transparency to “Green” projects.”
Strangely, Elizabeth forgot to mention this on her Berkeley Biography. She said she has advised governments, but not that the aim of that advice was to reduce their carbon footprint, and to select the right green technology. The current organization she lists on her Bio is called CSTransform which is neutrally vague about its aims, except that it’s obviously feeding off Big-Government, so scientific results that suggested that Governments don’t need to save the world by taxing and charging people would not seem to be her first priority. In her bio on the CSTransform site, it does mention her green desires: Elizabeth Muller is a “leading expert in how governments can use ICT to develop a more sustainable, lower-carbon future.” Evidently she has not had a skeptical conversion anytime in the last four years, but was happy to work with her Dad, which presumably would have been a very non-obvious thing to do if he was a “skeptic” as he claims he was.
Naturally Elizabeth would be delighted to discover that there was little evidence that a low carbon future was beneficial, necessary or even worth promoting and we are sure she would have overseen BEST in an utterly impartial light. /sarc
Muller and Associates repeat that they are “politically neutral” and “non-partisan”, but it’s obvious that they benefit from big-government policies, and the bigger the better. It would hard to imagine them welcoming a political policies aiming for a smaller government. That would rather turn off the tap, eh?
Perhaps most damning of all (in terms of their judgement) is that Richard Muller and Elizabeth Muller thought they could get away with it. Did it really not occur to them that skeptics would not find their alarmist comments and green companies on the world wide web? Did they really think they would escape with their credibility intact?
Bottom line: Of course, none of this personal information tells us anything about the accuracy of the BEST results, or about the global climate, but it does tell us about the accuracy of the message and PR announcements. BEST stress that they are independent and transparent and non-profit, but don’t mention that Elizabeth’s career has profited from findings that support the “climate change scare”. The BEST team are happy for the media to rave about how Richard Muller was “converted” (even though he was never really skeptical) but not too keen to say that Elizabeth has confirmed her strongly held position in spades.
From the BEST FAQ (my bolding)
“Berkeley Earth Surface Temperature aims to contribute to a clearer understanding of global warming based on a more extensive and rigorous analysis of available historical data.”
“We believe that science is nonpartisan and our interest is in getting a clear view of the pace of climate change in order to help policy makers to evaluate and implement an effective response. In choosing team members, we engage people whose primary interests are finding answers to the current issues and addressing the legitimate concerns of the critics on all sides. None of the scientists involved has taken a public political stand on global warming.”
It also tells us something about people who write off skeptical results because they are supposedly “funded by big oil”, but rave about the BEST project. If they are so concerned about “vested interests” why do they only protest about one sort of “interest”.
By Jeremy A. Kaplan
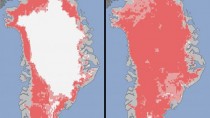
Extent of surface melt over Greenlands ice sheet on July 8 (left) and July 12 (right). Measurements from three satellites showed that in just a few days, the melting had dramatically accelerated and an estimated 97 percent of the ice sheet surface had thawed by July 12. (Nicolo E. DiGirolamo, SSAI/NASA GSFC, and Jesse Allen, NASA Earth Observatory)
NASA’s claim that Greenland is experiencing “unprecedented” melting is nothing but a bunch of hot air, according to scientists who say the country’s ice sheets melt with some regularity.
A heat dome over the icy country melted a whopping 97 percent of Greenland’s ice sheet in mid-July, NASA said, calling it yet more evidence of the effect man is having on the planet.
But the unusual-seeming event had nothing to do with hot air, according to glaciologists. It was actually to be expected.
“Ice cores from Summit station [Greenland’s coldest and highest] show that melting events of this type occur about once every 150 years on average. With the last one happening in 1889, this event is right on time,” said Lora Koenig, a Goddard glaciologist and a member of the research team analyzing the satellite data.
But rather than a regular 150-year planetary cycle, the new NASA report calls the melt “unprecedented,” the result of a recent strong ridge of warm air, or a heat dome, over Greenland—one of a series that has dominated Greenland’s weather since the end of May.
“Each successive ridge has been stronger than the previous one,” said Thomas Mote, a climatologist at the University of Georgia. This latest heat dome started to move over Greenland on July 8, and then parked itself over the ice sheet about three days later. By July 16, it had begun to dissipate, along with the ice, NASA said.
Climate skeptics said the NASA report itself was the only “unprecedented” item.
“NASA should start distributing dictionaries to the authors of its press releases,” joked Patrick J. Michaels, a climatologist and the author of the World Climate Report blog.
“It’s somewhat like the rush to blame severe weather and drought on global warming,” Anthony Watts, a noted climate skeptic and the author of the Watts Up With That blog, told FoxNews.com. “Yet when you look into the past, you find precedence for what is being described today as unprecedented.”
It’s the latest hot water for the National Aeronautics and Space Administration, which critics say has shifted focus and priorities from space and aeronautics to the earth we live on—and the planet’s changing climate.
NASA chief cryospheric scientist H. Jay Zwally told FoxNews.com that the melting has been increasing as the temperatures in Greenland have been increasing.
“Climate in the Arctic has been warming about three to four times more than the global average, and Greenland surface temperatures (observed by satellite and surface instruments) have been increasing about 2 degrees Celsius per decade during about the last 20 years,” he said. (Bullshit! the purported warming of the polar regions comes from a >1500 Km extrapolation of temperature by Mr Hansen. They don’t know what is happening and the present Arctic melting is also a cyclical [~50 y] event that is probably related to ocean circulation. BB)
Zwally would be in a position to know: He was lead scientist for the ICESat project, which ran from 2003 to 2010, and used satellites to measure Antarctic and Greenland ice sheets.
“This is the most extensive area of surface melting during last 40 years of satellite observations,” he said.
It may be in line with the 150-year cycles of melting, however. Mary Albert, executive director of the NSF Ice Core Drilling office, and Kaitlin Keegan, an engineering PhD student and a fellow in Dartmouth’s polar environmental change program, are working on a paper on the Greenland ice sheet melt, a school spokeswoman told FoxNews.com.
Neither was available to describe the exact findings, but in a blog posting detailing her work, Keegan noted that several cores dating back millennia have also reflected the 150-year cycle.
“In Greenland there have been many deep ice-core drilling projects which drilled ice to the bedrock,” she wrote. “In the past 10,000 years (the Holocene), there is on average a melt layer every 150 years.”
NASA ice scientist Tom Wagner told the Associated Press researchers don’t know precisely how much of Greenland’s ice had melted in this latest event, but it seems to be freezing again.
“The belief that almost any aberration in weather and climate today can be attributed to global warming is pure folly,” Watts told FoxNews.com.
David Whitehouse, GWPF
Anyone who has seen the raw temperature output from a weather station must have wondered at the marvel of averages. The output is all over the place - large fluctuations in temperature from hour to hour and day and night. Yet from those measurements the result is just one number - the monthly average - that finds its way into climate data.
Picking meaningful information from the variable set that are weather stations often seems more art than science; truncated sequences, gaps, changes of equipment, changes of sites, changes in the local environment, to name but a few factors that have to be taken into consideration, or sometimes not taken into consideration.
A new analysis of some of the statistical methods used in getting something out of temperature readings from weather stations carried out by Steirou and Koutsoyiannis of the National Technical University of Athens has been gaining some publicity as its conclusions are startling. The researchers say that the statistical manipulation of the data to correct errors often introduces even greater errors, as well as exaggerating positive trends.
Such statistical pitfalls are everywhere when one manipulates data like this. Consider the recent case of Dr Joelle Gergis of the University of Melbourne whose paper on 1000 years of climate data in Australia has had to be withdrawn for rewriting when it was pointed out that the “hockey sticks” produced by the calculations were artifacts. Then there is also the original hockey stick, once the unquestioned (by some) emblem of global warming, which was also shown to be in its broad detail an artifact of data processing.
Considering the processes applied to temperature time series Steirou and Koutsoyiannis say: “It turns out that these methods are mainly statistical, not well justified by experiments and are rarely supported by metadata. In many of the cases studied the proposed corrections are not even statistically significant.”
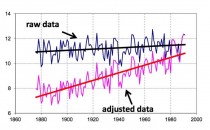
“In total we analyzed 181 stations globally. For these stations we calculated the differences between the adjusted and non-adjusted linear 100-year trends. It was found that in the two thirds of the cases, the homogenization procedure increased the positive or decreased the negative temperature trends.”
They give an example [Above] CLICK for bigger image.
“The above results cast some doubts in the use of homogenization procedures and tend to indicate that the global temperature increase during the last century is between 0.4 deg C and 0.7 deg C, where these two values are the estimates derived from raw and adjusted data, respectively.”
If the rise in temperature really is only 0.4 deg C then that changes everything.
Warmer Than Today
Another potentially highly significant paper, this time concerning the Medieval Warm Period (MWP) comes from the Journal Paleogeography, Paleoclimatology and Paleoecology. It is entitled “Marine climatic seasonality during early medieval times (10th to 12th centuries) based on isotopic records in Viking Age shells from Orkney, Scotland.”
In the abstract the authors say; “Seasonal sea-surface temperature (SST) variability during the Medieval Climate Anomaly (MCA), which corresponds to the height of Viking exploration (800-1200 AD), was estimated using oxygen isotope ratios (δ18O) obtained from high-resolution samples micromilled from archaeological shells of the European limpet, Patella vulgata.”
“Our findings illustrate the advantage of targeting SST archives from fast-growing, short-lived molluscs that capture summer and winter seasons simultaneously. Shells from the 10th to 12th centuries (early MCA) were collected from well-stratified horizons, which accumulated in Viking shell and fish middens at Quoygrew on Westray in the archipelago of Orkney, Scotland. Their ages were constrained based on artifacts and radiocarbon dating of bone, charred cereal grain, and the shells used in this study. We used measured δ18OWATER values taken from nearby Rack Wick Bay (average 0.31 plus/minus 0.17‰ VSMOW, n = 11) to estimate SST from δ18OSHELL values. The standard deviation of δ18OWATER values resulted in an error in SST estimates of plus/minus 0.7 C.”
“The coldest winter months recorded in the shells averaged 6.0 plus/minus 0.6 C and the warmest summer months averaged 14.1 plus/minus 0.7 C. Winter and summer SST during the late 20th century (1961-1990) was 7.77 plus/minus 0.40 C and 12.42 plus/minus 0.41 C, respectively.”
“Thus, during the 10th to 12th centuries winters were colder and summers were warmer by ~ 2 C and seasonality was higher relative to the late 20th century. Without the benefit of seasonal resolution, SST averaged from shell time series would be weighted toward the fast-growing summer season, resulting in the conclusion that the early MCA was warmer than the late 20th century by ~ 1 C.”
“This conclusion is broadly true for the summer season, but not true for the winter season. Higher seasonality and cooler winters during early medieval times may result from a weakened North Atlantic Oscillation index.”
Two papers in well-respected, peer-reviewed scientific journals conclude that perhaps the warming observed in the past century has been overestimated, and that the MWP was substantially warmer than today. This is bound to provide food for thought.