


By James A. Marusek
UPDATE: An addition from Joe Bastardi’s blog
HOW COLD IS IT?
Gavin Partridge has supplied the details:
The central England Temperature (CET) from the 1st-7th of December is -1.9, making this the coldest opening week of December since 1879; 1879 is the coldest opening week on CET record, so this week has been the second coldest opening week to December since CET records began in 1659.
The two-week period, last week of November and first week of December is the coldest since CET records began in 1659.
My (JB) addition:
I guess when a lot of us started speculating about going back to the time of the Victorian era… we underestimated it.
Ciao for now
-------------
Over the centuries, mankind has experienced tremendous rainfalls and massive floods, monster hurricanes and typhoons, destructive tornadoes, parched-earth droughts, strong gales, flash floods, great snowfalls and killer blizzards, lightning storms sent down from the heavens, blind dense fogs, freezing rain, sleet, great hail, and bone-chilling cold and even an occasional mudstorm or two and in-between, periods of warm sunshine and tranquility.
And WE ARE STILL HERE. We are perhaps a little battered and bruised from the wear. But there is nothing new in the weather to fear because we have been there before. We have learned to cope. We have developed knowledge, skills and tools to reduce the effects of weather extremes.
Today, every time a heat wave or a great flood occurs (such as those in Russia and Pakistan this year), voices arise claiming this is more proof of man-made global warming. I wonder to myself if these voices are intentionally ignorant of historical weather extremes or just dishonest.
Early meteorologist and historians have documented weather for many centuries. Recently, I have compiled several of these accounts into “A Chronological Listing of Early Weather Events” and published this document on the Impact website here.
This chronology covers the years 0 to 1900 A.D. (When downloading the file, please be a little patient. This is a master resource and the 6.5 MB file may take a few minutes to access.)
Why is a chronological listing of weather events of value? If one wishes to peer into the future, then a firm grasp of the past events is a key to that gateway. This is intrinsically true for the scientific underpinnings of weather and climate.
Icecap Note: a wonderfully comprehensive chronology of past weather before the age of the SVU.
By Ray Garnett and Madhav Khandekar in the CMOS
Abstract: The May-July period over the Canadian Prairies in 2010 was the wettest in 60 years and possibly 100 years. In July the federal and three prairie provincial governments announced $450 million in funding to assist waterlogged farmers. Causal factors are considered to be El Nino conditions during the past winter and spring months, below normal North American snow cover in April and extremely low sunspot activity.
The Canadian prairies produce over 50 million tonnes of grain, over half of which is wheat. In terms of planted area, yield and quality the most weather-sensitive months are May-September with May-July being the most critical for yield. (Garnett 2002). The prairies are one of the most drought-prone regions in Canada, where droughts (recurring or irregular) of moderate-to-severe intensity have occurred for hundreds of years (Khandekar, 2004). The recent drought years of 1999-2002 are fresh in the memories of many Prairie farmers. That drought period prompted several Alberta University professors to write to the then-Premier of Alberta, Mr. Ralph Klein, an ‘Open Letter’ urging him to support the Kyoto Accord and to develop a GHG (Greenhouse gas) reduction strategy for Alberta and by extension the other Prairie Provinces (The Open Letter was published in major newspapers in Alberta in July/August 2002). The Open Letter further suggested that droughts on the Prairies could be exacerbated as human-induced concentration of GHGs would continue to increase in the future.
Against this backdrop, it is worth noting that April to September of 2010 brought more than 150% of normal rainfall to the prairie grain-growing region. The months of May through July were the wettest in the last 60 years and possibly in 100 years. This summer’s almost record-breaking rains on the Prairies were reminiscent of the summer 2005, when parts of the city of Calgary as well as several other localities on the Prairies were flooded. For the prairies as a whole May-August 2010 brought 144% of normal precipitation compared to 122% of normal in 2005.
The 2005 flood situation on the Prairies prompted (the then) Prime Minister Rt. Hon. Paul Martin to make a special visit to the Prairies and declare emergency funding for flood affected regions. As this summer’s harvest season continues, prospects are for a significantly reduced harvest, primarily due to excessive rains and delayed sowing due to waterlogged farms into early June. Why are the Canadian Prairies subject to such extreme drought/wet summers?
What is driving the summer rainfall pattern? In this short article we analyse Prairie drought (and wet periods) using a simple teleconnective analysis of large-scale atmosphere ocean and snow cover patterns plus a new approach developed recently by Garnett et al (2006).
Concluding Remarks
This past summer’s excessive rains on the Canadian Prairies appear to be due to a favourable combination of SSTs in the equatorial Pacific in conjunction with solar impact related to diminished sunspot numbers. Besides SSTs and low sunspot activity, a lower-than-normal snow cover during the spring months (April-May) may also have helped in producing a near-record rainfall on the Prairies.
The current solar minimum has not been equalled since 1933 (Livingston and Penn, 2009). These authors (Livingston and Penn) further project sunspots to vanish altogether by 2015.
What is in store for the summer of 2011? The La Nina conditions have been strengthening in recent months with sea surface temperature anomalies at the Nino 3.4 region averaging -1.2C below normal for the past three months. This is almost two standard deviations below normal.
Persistence of La Nina conditions for next spring (2011) together with continuing low sunspot activity may determine summer precipitation on the Prairies for 2011 and possibly beyond.
Could the Solar Cycle 24 (2010-2021) now commencing, parallel conditions experienced by Manitoba’s Selkirk Settlers who arrived in the Red River region between 1795 and 1823 during the Dalton Minimum of the sunspot cycles? In those years, sunspot activity failed to reach 50 sunspots per month. The settlers experienced frost, floods and locusts and probably would not have survived had it not been for the estimated 60 million bison that roamed the
Great Plains around 1800 (Green, 1974). A recent book (Plimer 2009) describes the Dalton Minimum period as an extraordinarily cold time in Europe. How the Prairie summer weather evolves in response to the equatorial Pacific SST distribution and low sunspot activity over the next few years remains an important research area at present.
Read the full analysis here.
Hot Air
Rep. Jerry Lewis (R-CA) wants to get the chair of Appropriations once Republicans take control of the House, and he’s campaigning hard to demonstrate his commitment to conservative causes. In an attempt to move the conversation away from earmarking, Lewis has fixed his sights on the EPA and its “arbitrary interpretations of the Clean Air Act,” warning EPA head Lisa Jackson that he intends on stripping the agency of funding for her climate-change agenda:
Rep. Jerry Lewis is hoping to strengthen his bid to chair the House Appropriations Committee by threatening to strip funding from the Obama administration’s controversial environmental rules.
The California Republican vying for the gavel of the powerful spending panel sent a letter Monday to the Environmental Protection Agency chief Lisa Jackson warning that the GOP-led House plans to strip funding for agency regulations and conduct “unprecedented levels of oversight,” with a particular focus on the administration’s climate change policies.
“In addition to scrutinizing the agency’s entire FY 2012 budget, with particular attention on the agency’s rulemaking process, the House Appropriations Committee will be exercising its prerogative to withhold funding for prospective EPA regulations and de-fund through the rescissions process many of those already on the books,” wrote Lewis, who chaired the spending panel in 2005 and 2006.
Specifically, Lewis said he wants to target EPA’s “ongoing arbitrary interpretation of the Clean Air Act” to begin regulating greenhouse gases in January. He said he will refuse to support federal funding to regulate greenhouse gases in the 112th Congress “unless Congress passes bipartisan energy legislation specifically providing the authority to do so.”
Lewis also signaled plans to target EPA agricultural regulations dealing with spilled milk on dairy farms, airborne dust, lawn fertilizer and arsenic in ground water.
Lewis might get a chance to do something about the FY2011 budget, too, if Democrats don’t stop focusing on the DREAM Act and other nonsense. They have just three weeks to pass a full budget, but instead they’re discussing the remainder of the progressive wish-list agenda. If they don’t act to create a full budget by the end of the session - one which Republicans will allow to proceed in the Senate - then the chair of Appropriations will have a lot more immediate impact on the EPA’s ambitions on climate change.
That’s not likely to change no matter whether Lewis or John Kingston gets the chair. Reining in the EPA will be a high priority for business-minded Republicans, and funding will be the manner in which they yank the leash. The Senate doesn’t have enough Democrats to force the House to fully fund the EPA, especially since so many Democrats will have to stand for re-election in 2012, especially in Midwestern and southern states that rely on agriculture for their economy. Defending Jackson now or later in 2011 will have deep ramifications for politicians like Ben Nelson, Mark Pryor, Jon Tester, and Jim Webb.
By Dr. Anthony Lupo
In late August, we’d written a piece discussing the fact that while the Atlantic hurricane season was projected to be quite active [1], [2], [3], throughout the Northern Hemisphere, the season had been quite quiet [4]. In this article, we’d compared 2010 to some of the years past going back to the late 1970s when more detailed records were being kept finally in all basins. The Southern Hemisphere was not included in [4] since the Southern Hemisphere annual cycle is six months out of phase with that of the Northern.
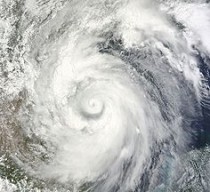
Hurricane Alex, a rare June Hurricane
By that time, 2010 had been the third quietest year in the period of record, and this was due to the quiet season in the Pacific Ocean basin as a whole. As the nominal hurricane season comes to an end in the Atlantic on 30 November, it can be seen that in spite of the active Atlantic hurricane season [5] the Northern Hemisphere continued to be quiet. In fact, the year 2010 is poised to jump one more position as the second quietest year on record.
In a typical Northern Hemisphere year, there are 57 named storms, of which 34 become hurricanes, and 10 or 11 of these become the most intense storms (Category 4 or 5) [6]. With one month to go, this year’s total comes in at only 46 named storms including 27 hurricanes, and 11 intense storms. This year is second only to 1977, in which only 39 tropical cyclones occurred. The year 1979 with 48 storms currently holds the number three spot. Recent research [6] has demonstrated that during La Nina years, tropical cyclone activity in the Pacific as a whole is confined to the continental margins, while during El Nino years the span of the entire tropical Pacific is active.
While many [5] have discussed the busy Atlantic season as being the third most active season and one in which there was no category five storms, the remainder of this article will focus on the quiet Pacific. Additionally, it should be noted that the Northern Indian Ocean lived up to expectations in that five storms typically occur, and five have occurred as of the end of November.
In the East Pacific, 2010 set a new standard this year for a quiet season and only seven named storms occurred. The previous minimum since 1970 was eight in 1977. Additionally, the last named storm occurred in late September which is the earliest end to a season in that basin. The season includes only three hurricanes (a record minimum) and one intense storm. During June and July, the cool SST’s related to the onset of this year’s strong La Nina began to set in. This is likely part of the reason for the slow season in this basin.
Largely overlooked to this point is the fact that the West Pacific has also been very quiet. Only 15 named storms have occurred here and this is the quietest season since the late 1970’s and ties 1946 as the quietest overall. Recall, however, that 1946 would have been before the satellite era and thus, 2010 could be well the quietest season there in 65 years or more. This includes only eight hurricanes (a record minimum) and only two intense hurricanes in that basin. Only 1985 had fewer intense storms with one. Realistically, the West Pacific is the last basin left in the Northern Hemisphere in which tropical cyclones may occur in December.
Expanding our look to the Southern Hemisphere, no tropical activity has been noted since March 2010 in the South Pacific. Overall, 23 tropical cyclones have occurred in the entire Southern Hemisphere since January 1, including a rare event in the South Atlantic. The Southern Hemisphere averages 27 events per tropical season [6], thus, it is not possible that this part of the globe is offsetting a quiet Northern Hemisphere. Though, it is interesting to note that the South Pacific, like the North Pacific, has been quite quiet throughout most of this year.
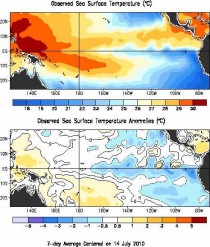
Figure 1. Global SSTs (top) and anomalies (bottom) for mid July 2010. Temperatures are shown in (C). See more.
All of this is consistent with recent drop in accumulated cyclone energy (ACE), which is at the lowest point globally [7] in about 30 years and shown to correlate well to tropical cyclone numbers. Then, it is no coincidence then that 2010 is competing with the late 1970s for the quietest seasons in the period of record. And what of the contention that anthropogenic global warming would lead to an increase in hurricane numbers and strength? Speculation on this point may be falling lower than the global ACE.
References:
[1] National Hurricane Center Home Page
[2] Klotzbach/Gray CSU Forecasts
[3] http://www.accuweather.com
[4] Lupo,A.R., 2010: 2010 Hurricane season: Unusually quiet in the Northern Hemisphere..
[5] NOAA,2010: Extremely active Atlantic hurricane season a “gentle giant” for the U.S.
[6] Lupo, A.R., 2011: Interannual and Interdecadal variability in hurricane activity. Hurricane Research, ISBN 978-953-7619-X-X, Intech Publishers, Vienna (In preparation)
[7] Maue, R.N.,2010: From Ryan N. Maue’s 2010 Global Tropical Cyclone Activity Update
See why normalized losses have not increased in this Roger Pielke Jr. blogpost.
By Bud Bromley
The U.S. Constitution does not authorize the President or the Congress to delegate internal U.S. public policy to international organizations or foreign governments. The President may propose a treaty with another government, which the Senate must then ratify, but that treaty may not delegate the responsibilities of President and the Congress as defined in the Constitution. For example, a U.S. President may negotiate a treaty with a foreign government to settle an international dispute or to jointly defend each other, and then this treaty may be ratified by the Senate, but the President and Senate do not have the Constitutional authority to say that the rights (e.g. how much CO2 you may emit) of U.S. citizens may be determined by another government or international organization. A treaty can not change the Constitution. It is the President’s responsibility to protect and defend; this may not be delegated even by treaty. Since 1787 it has been recognized U.S. law that for a treaty to be valid, it must be consistent with the U.S. Constitution. Alexander Hamilton said, “A treaty cannot change the frame of the government.”
Al Gore in the Clinton Administration and now President Obama unconstitutionally and illegally are attempting to reduce U.S. sovereignty through agreements at these several UN-sponsored climate conferences such as the Kyoto, Copenhagen and Cancun climate conferences. The President is acting outside of his Constitutional authority by committing funds and negotiating agreements which delegate U.S. public policy such as compliance with environmental standards and international money transfers based on those standards.
President Obama is derelict in his sworn duty to protect and defend the U.S. Constitution. President Obama should be impeached by the U.S. House of Representatives and tried by the U.S. Senate. President Obama chose to be President and accepted the duties and responsibilities of the office. His duty is to defend the sovereign rights and property of U.S. citizens and to defend the Constitution.
The announced plans and actions underway by the U.S. EPA, a part of the executive branch, to regulate use of carbon dioxide by U.S. citizens according to standards agreed and referenced by international organizations is an un-Constitutional, illegal delegation of Presidential duty and beyond his Constitutional authority. Congress may propose legislation and the President may sign that legislation into law, for example the Clean Air Act, but that law is un-Constitutional if that legislation and the ensuing regulations and policies require compliance with international standards or organizations which are not the subject of a treaty duly ratified by the Senate. The Kyoto Treaty proposed by Al Gore and President Clinton were rejected 95-0 by the U.S. Senate. The sovereignty issue is similar to U.S. repeated refusal to allow its soldiers, politicians or citizens to be subject to international laws for certain war crimes since the U.S. Senate has refused to ratify a treaty on that matter.
Keep in mind that the major countries and organizations with which President Obama and his czars are negotiating these illegal climate agreements do not themselves have a constitution and many are not even governments. The E.U. Constitution has never been ratified. The United Nations has no constitution and it is neither a government nor a democratic institution, but rather a set of treaties.
Treaty or no treaty, the three branches of the U.S. government were not granted authority from the U.S. states and citizens to delegate their Constitutional duties and responsibilities to an international organization. The scientific, economic and political merits of international climate agreements such as COP 15, the Kyoto Treaty and the standards such as those referenced by the U.S. EPA in its Final Endangerment Finding have never been validated in this country, nor are they subject of a duly ratified treaty. There is substantial scientific evidence which disproves both the internationally acclaimed standards and the need for such regulations. In fact there are many U.S. scientists who vigorously repudiate the proposed international standards and the scientific basis for those standards and no U.S. court of law has decided a case based on scientific merit. The U.S. law known as the Clean Air Act requires the EPA to regulate green house gases if the EPA finds that green house gases are a danger to public health. The U.S. Supreme Court ruled on administrative law regarding the Clean Air Act without consideration of scientific merit. The EPA’s Endangerment Finding heavily referenced UN IPCC documents, many of which are not peer reviewed, but instead are scientifically disputed and based on corrupted data, and the EPA has not held open scientific meetings or debates on the scientific merit of these standards. Essentially, the U.S. EPA and the U.S. President are attempting to delegate their duties and responsibilities to a non-U.S., non-governmental agency. The President is attempting to hand over sovereign rights of U.S. citizens to an international body. This is clearly un-Constitutional.
Judith Curry’s Climate etc.
This thread provides an opportunity to put forth skeptical arguments related to the topics broadly covered by the IPCC WG I Report The Physical Science Basis. This thread is designed for academic and other professional researchers as well as citizen scientists.
From academic and other professional researchers, I am looking for:
- a published paper that you feel has received insufficient attention or has otherwise been marginalized
- a manuscript that you believe has been unfairly rejected for publication
- other reports or analyses that you think are significant and would like feedback on
From citizen scientists, I am looking for
- a website or link to a manuscript with your analyses
Please don’t submit half baked ideas, I am looking for ideas that are fairly well developed with supporting analyses. Make Climate Etc. look good for attempting this
Format: Limit your post to 750 words and provide web links to your analyses, manuscript, or more extensive argument. Use your 750 words to identify which aspect of the climate problem you are addressing and succinctly describe your argument, evidence, and method of analysis. Use your 750 words to convince the reader to actually click on your links and look at your material in more detail. Please make sure you have posted a brief biosketch at Denizens thread.
See post here.
Please take Judith up on the challenge.
By Cliff Ollier
I taught an introductory course in Geology at the University of the South Pacific in 1977. Each of the countries that participated in USP was invited to send 2 students. They had varying interests, and it was amusing to watch how they woke up when we were teaching geology relating to their own job. Some were interested in gold mining, others in highways and landslides, some in coastal erosion, others in active volcanoes. It was rather a surprise when the sole student from Tuvalu approached me one day and said “Sir, this is all wasted on me. My island is just made of sand.” Any news from Tuvalu always struck a chord from that moment.
Since then, of course, Tuvalu has become “hot news” as the favourite island to be doomed by sea level rise driven by global warming, allegedly caused in turn by anthropogenic carbon dioxide. If you look up Tuvalu on the internet you are inundated with articles about its impending fate. Tuvalu has become the touchstone for alarm about global warming and rising sea level.
The geological background
There may have been good reason to think that Tuvalu was doomed anyway. Charles Darwin, who was a geologist before he became a biologist, gave us the Darwin theory of coral islands which has been largely substantiated since his time. The idea is this: When a new volcano erupts above sea level in the tropical ocean, corals eventually colonise the shore. They can grow upwards and outwards (away from the volcanic island) but they can’t grow above sea level. The coral first forms a fringing reef, in contact with the island. As it grows outwards a lagoon forms between the island and the living reef, which is then a barrier reef. If the original volcano sinks beneath the waves a ring of coral betrays its location as an atoll.
But besides the slow sinking of the volcanic base there are variations of sea level due to many causes such as tectonics (Earth movements) and climate change. If sea level rises the coral has to grow up to the higher sea level. Many reefs have managed this to a remarkable extent. Drilling on the coral islands Bikini and Eniwetok shows about 1500m thickness of limestone and therefore of subsidence. Coral cannot start growing on a deep basement, because it needs sunlight and normally grows down to only 50 m.
If the island is sinking slowly (or relative sea level rising slowly) the growth of coral can keep up with it. In the right circumstances some corals can grow over 2 cm in a year, but growth rate depends on many factors.
Sometimes the relative subsidence is too great for the coral to keep pace. Hundreds of flat-topped sea mountains called guyots, some capped by coral, lie at various depths below sea level. They indicate places where relative sea level rise was too fast for coral growth to keep pace.
Sea level and coral islands in the last twenty years
What about the present day situation? The alarmist view that Tuvalu is drowning has been forced upon us for twenty years, but the island is still there. What about the changes in sea level?
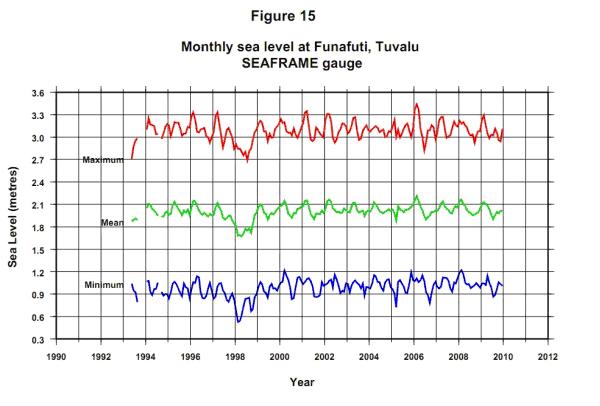
Rather than accept my interpretation, look at the data for yourself. First take a regional view. For a number of well-studied islands it can be located here.The Tuvalu data is provided here. The results are shown graphically in their Figure 15 and reproduced below, enlarged here.
These island data have never been published in a “peer reviewed” journal. They are only available on the Australian Bureau of Meteorology website in a series of Monthly Reports, as in the examples given above. Some measure of the reliability and responsibility may be gauged from the disclaimer at the start of the document:
Disclaimer: The views expressed in this publication are those of the authors and not necessarily those of the Australian Agency for International Development (AusAID). (But the names of the authors are not provided).
As you can see, apart from a low in the early records, which seem to be associated with a tropical cyclone, there seems to be no great change in sea level since the early 1990s.
Explaining it away
Vincent Gray explained in his newsletter, NZCLIMATE AND ENVIRO TRUTH NO 181 13th August 2008, that something had to be done to maintain rising sea level alarm, and it was done by in a paper by John R Hunter. Hunter first applies a linear regression to the chart for Tuvalu. He gets -1.0plus/minus 13.7mm/yr so Tuvalu is actually rising! The inaccuracy is entirely due to the ENSO (El Nino-Southern Oscillation) effect at the beginning. He then tries to incorporate old measurements made with inferior equipment and attempts to correct for positioning errors. He gets a “cautious” estimate for Tuvalu of 0.8 plus/minus 1.9mm/yr. He then tries to remove ENSO to his own satisfaction, and now his “less cautious” estimate is 1.2 plus/minus 0.8mm/yr.
Does this show the island is rising? Just look at the inaccuracy. The commonsense interpretation of the sea level graphs is surely that Tuvalu, and 11 other Pacific Islands, are not sinking over the time span concerned. The sea level is virtually constant.
Similar manipulation of sea level data is described in Church and others (2006), who consider the tropical Pacific and Indian Ocean islands. Their best estimate for sea level rise at Tuvalu is 2 plus/minus 1 mm/yr from 1950-2001. They wrote “The analysis clearly indicates that sea-level in this region is rising.” Does this square with simple observation of the data in Figure 15? They further comment: “We expect that the continued and increasing rate of sea-level rise and any resulting increase in the frequency or intensity of extreme-sea-level events will cause serious problems for the inhabitants of some of these islands during the 21st century.” The data in Figure 15 simply do not support this excessive alarmism.
Models and ground truth
Before getting on to the next part of the story I shall digress on to the topic of “models’ versus “ground truth’. The past twenty years might be seen as the time of the models. Computers abounded, and it was all too easy to make a mathematical model, pump in some numbers, and see what the model predicted. It became evident very early that the models depended on the data that was fed in, and we all know the phrase “Garbage in, Garbage out”. But the models themselves do not get the scrutiny they should. Models are invariably simplifications of the natural world, and it is all too easy to leave out vital factors.
“Ground Truth’ is what emerges when the actual situation in a place at the present time, regardless of theories or models. It is a factual base that may help to distinguish between different models that predict different outcomes - just what did happen, and what can we see today.
In the case of Tuvalu’s alleged drowning, we are usually presented with a simple model of a static island and a rising sea level. As Webb and Knetch expressed it: “Typically, these studies treat islands as static landforms”. “However, such approaches have not incorporated a full appreciation of the contemporary morphodynamics of landforms nor considered the style and magnitude of changes that may be expected in the future. Reef islands are dynamic landforms that are able to reorganise their sediment reservoir in response to changing boundary conditions (wind, waves and sea-level)”.
In simple language we have to include coral growth, erosion, transport and deposition of sediment and many other aspects of coral island evolution. The very fact that we have so many coral islands in the world, despite a rise in sea level of over 100 m since the last ice age, shows that coral islands are resilient - they don’t drown easily.
The actual growth of islands in the past twenty years
Webb and Kench studied the changes in plan of 27 atoll islands located in the central Pacific. They found that the total change in area of reef islands (aggregated for all islands in the study) is an increase in land area of 63 hectares representing 7% of the total land area of all islands studied. The majority of islands appear to have either remained stable or increased in area (86%).
Forty three percent of islands have remained relatively stable (< plus/minus 3% change) over the period of analysis. A further 43% of islands (12 in total) have increased in area by more than 3%. The remaining 15% of islands underwent net reduction in island area of more than 3%.
Of the islands that show a net increase in island area six have increased by more than 10% of their original area. Three of these islands were in Funafuti; Funamanu increased by 28.2%, Falefatu 13.3% and Paava Island by 10%. The Funafuti islands exhibited differing physical adjustments over the 19 years of analysis. Six of the islands have undergone little change in area (< 3%). Seven islands have increased in area by more than 3%. Maximum increases have occurred on Funamanu (28.2%), Falefatu (13.3%) and Paava (10.1%). In contrast, four islands decreased in area by more than 3%.
Conclusion
In summary Webb and Kench found island area has remained largely stable or increased over the timeframe of their study, and one of the largest increases was the 28.3% on one of the islands of Tuvalu. This destroys the argument that the islands are drowning.
Vincent Gray, an IPCC reviewer from the start, has written SOUTH PACIFIC SEA LEVEL: A REASSESSMENT, which can be seen here. For Tuvalu he comments that “If the depression of the 1998 cyclone is ignored there was no change in sea level at Tuvalu between 1994 and 2008; 14 years. The claim of a trend of + 6.0 mm/yr is without any justification”.
References:
Church, J.A., White, N.J. and Hunter, J.R., 2006. Sea-level rise at tropical Pacific and Indian Ocean islands. Global and Planetary Change, v. 53, p. 155-168.
Webb, A. P., Kench, P. S. 2010. The dynamic response of reef islands to sea level rise: evidence from multi-decadal analysis of island change in the central pacific, Global and Planetary Change, v. 72, p. 234-246.
By John O’Sullivan
Mainstream media embarks on lame attempt to trash academic that exposed climate fraudsters in damning congressional report. Malicious claims have no legal foundation.
The story featured in USAToday (November 23, 2010) centers on the controversial Wegman Report (2006) that indicated fraudulent use of data in science papers of global warming doomsayers, Michael Mann and Ray Bradley (M&B).
Congressional report author, Dr. Edward Wegman of George Mason University, is accused of plagiarism in his devastating report. The document did much damage not only to the credibility of the two climatologist’s involved, but an entire international clique of government funded researchers.
It was heightened fears over global warming that saw climate researchers benefit handsomely from $80 billion spent on climate research.
Wegman’s accusers are two self-styled “plagiarism experts” - Pace University climate writer Andrew Revkin and retired computer scientist, John Mashey of Portola Valley, California. The accusation was first made a year ago and the “experts” appear to have no qualification or legal training in this field, although they are both known environmental activists.
Iconic Hockey Stick Graph Shaped from Data Abuse
Mann and Bradley’s (M&B) studies were first touted in 1998 by doomsaying global warmists as proof that modern temperatures were unprecedented. The UN’s Intergovernmental Panel on Climate Change (IPCC) subsequently trumpeted the ‘Hockey Stick’ graph based on those findings and it became the iconic image of environmentalists lobbying for drastic cuts in human emissions of carbon dioxide.
However, independent analysts, Canadians Ross McKitrick and Steve McIntyre, discredited M&B’s studies. Their own statistical analysis indicated the climatologists had misused data. The findings precipitated a congressional probe that affirmed wrongdoing by M&B.
Non-story With No Legal Legs to Stand on
Under law, Bradley has no case against Wegman and these latest allegations are ineptly contrived. As we shall see below, the claims cannot be backed up by bona fide copyright lawyers for good reason.
The pro-green media appear to endorse the argument that Wegman ought to have compiled his document according to academic standards rather than the legal and constitutional ones applicable under congressional committee privilege - a patently absurd proposition.
But under the ‘fair use’ doctrine and rules that apply to reports commissioned by Congress Wegman’s conduct is faultless. His report correctly cites Bradley 35 times and in the reference section under, “BIBLIOGRAPHY Academic Papers and Books”, Bradley again appears 13 times. As the law stands Wegman is bulletproof and there’s no plagiarism or copyright infringement here.
Skeptics have countered the claims by saying they know the real reason for the last-ditch strategy: to distract public attention away from the faked science.
The Wegman Report was supplied to investigators in the Energy and Commerce Committee and the Subcommittee on Oversight and Investigations. Both bodies sought independent verification of the damning analysis of Mann et al. (1998, 1999) [MBH98, MBH99] conducted by McIntyre and McKitrick (2003, 2005a, 2005b) [MM03, MM05a, MM05b].
Alarmist Cover Up of Climate Change Fraud Still Persists
Ironically, from Wegman there is a good legal case to be made against M&B. Indeed, evidence shows that Bradley implicates himself; he appears to have something to hide in leaked correspondence between him and a third party. The third party turned whistleblower to make public the following damning email they received from Bradley:
“I filed a complaint with George Mason University (where Wegman is a Professor) & they have set up a committee to investigate my complaint. [A] recent letter from their Vice-Chancellor indicates that they expect the committee to report their findings by the end of September.
That’s the long & short of it. I have told the University that I am prepared to drop this matter if Wegman makes a request to have his report withdrawn from the Congressional Record. No response on that.
Thanks
Ray [Bradley]”
That was one of many attempts to stymie independent investigators. As for Michael Mann, we see the extent of his behind the scenes conniving in this leaked email:
“Let’s let our supporters in higher places use our scientific response to push the broader case against McIntyre and McKitrick” (Michael Mann: October 31, 2003).
With so many “friends in high places” Bradley and Mann have been able to evade justice for years - but is time running out?
Mann is repeatedly contemptuous of requests for him to make public all his calculations used for his hockey stick graph. Even those who fail to comprehend the science can easily determine that these actions are not those of honest scientists eager to help ‘save the planet.’
But a persistent Virginia Attorney General, Ken Cuccinelli remains hot on Mann’s trail demanding full disclosure. But all the while, apologists like Mashey and Revkin insist crooks like M&B have “academic freedom” to save them from the long arm of the law.
But public tolerance for charlatanism has waned. In the recent mid-term elections American voters have installed a large new crop of Republicans in the House giving them a mandate to punish such fraud. In conclusion, what we are witnessing here is a lame attempt to create a distraction story by an embittered crop of losing adversaries mourning over their bled out climate corpse. And if I were Dr. Wegman I’d run this all by a good libel lawyer - for Mashey and Revkin pay back could be a b**ch! See post here.