


Klaus Wolter, CDC
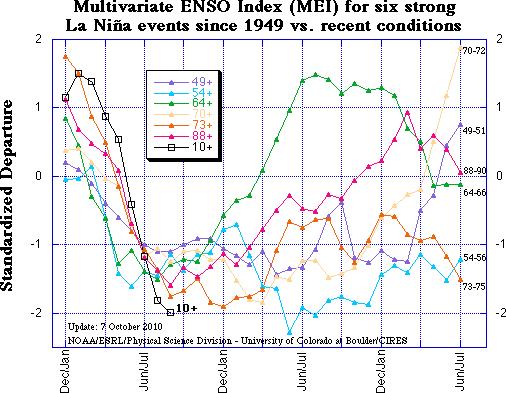
Discussion and comparison of recent conditions with historic La Nina events
See enlarged here.
In the context of recent plunge of the MEI into strong La Nina conditions, this section features a comparison figure with strong La Nina events that all reached at least minus one standard deviations by June-July, and a peak of at least -1.4 sigma over the course of an event. The most recent bigger La Nina events of 1998-2001 and 2007-09 did not qualify, since they either did not reach the required peak anomaly (the first one) or became strong too late in the calendar year (both).
The most recent (August-September) MEI value shows a continued drop from earlier this year, reaching -1.99, or 0.18 sigma below last month’s value, and 3.39 standard deviations below February-March, a record-fast six-month drop for any time of year, while slowing down a bit at the shorter time scales. The most recent MEI rank (lowest) is clearly below the 10%-tile threshold for strong La Nina MEI rankings for this season. One has to go back to July-August 1955 to find lower MEI values for any time of year.
Negative SST anomalies are covering much of the eastern (sub-)tropical Pacific in the latest weekly SST map. Many of these anomalies are in excess of -1C.
For an alternate interpretation of the current situation, I highly recommend reading the latest NOAA ENSO Advisory which represents the official and most recent Climate Prediction Center opinion on this subject. In its latest update (7 October 2010), La Nina conditions are expected to last at least into the Northern Hemisphere spring of 2011.
There are several other ENSO indices that are kept up-to-date on the web. Several of these are tracked at the NCEP website that is usually updated around the same time as the MEI, in time for this go-around. Nino regions 3 and 3.4 showed persistent anomalies above +0.5C from June 2009 through April 2010, with a peak of +1.6C for Nino 3 and +1.8C for Nino 3.4 in December 2009, only to drop to about -0.5C or lower in both regions by early June 2010, reaching just shy of -1.0C for the month of July, and below -1.5C for September Nino 3.4 anomalies and below -1.2C for Nino 3. For extended Tahiti-Darwin SOI data back to 1876, and timely monthly updates, check the Australian Bureau of Meteorology website. This index has often been out of sync with other ENSO indices in the last few years, including a jump to +10 (+1 sigma) in April 2010 that was ahead of any other ENSO index in announcing La Nina conditions. After a drop to +2 in June, July rebounded to +20.5, August continued at an impressive +18.8, only to be followed by an even more impressive +25.0. The last time that this index showed higher values in September was back in 1917, which was also the only time on record that this happened for this month. An even longer Tahiti-Darwin SOI (back to 1866) is maintained at the Climate Research Unit of the University of East Anglia website, however with less frequent updates (currently through March 2010). Extended SST-based ENSO data can be found at the University of Washington-JISAO website, currently updated through May 2010 (which ended up just slightly below the long-term mean value).
Stay tuned for the next update (by November 5th) to see where the MEI will be heading next. After peaking seven months ago at +1.5, it has dropped just about as fast as it can, and continues to correlate highest with 1970, of the ‘analog’ cases shown here. Given the continued drop in the MEI into exceptionally strong territory, La Nina conditions are guaranteed well into 2011.
By Bill Steffen
Barrow, Alaska - where they already have 3” of snow on the ground. At Barrow, they’ve had light snowfall nine days in a row. Northway, Alaska also reports 2” of snow on the ground. I’ve been on record for several months saying this winter was going to be colder than last winter over Alaska and a good portion of Canada (and warmer from Texas to Florida and up at least as far as Washington, D.C.) and that the cold would start early...and it has.
Get a load of these low temperatures in September: -11F near Beaver Village, -10 near Chalkyitsik. Chicken, Alaska was -5. Bettles reached ZERO on Monday, tying the coldest temperature ever recorded there in September. Eielson AFB near Fairbanks was +3, and that was the coldest temperature they have ever had in any September (the average low for Fairbanks now is 28). Daily records were set at Eagle (0), Gulkana (3), King Salmon (17) and Cold Bay (31).
St. Paul Is. reported a north wind at 33 mph with gusts to 46. Juneau (named for Joe Juneau, an occasionally drunk miner) had a cold rain and an east wind at 28 mph with gusts to 38 mph as I write this. Enjoy the mild air while we’ve got it. The Alaska cold is going to meet the southern warmth over the Great Lakes this winter. The fun should start in November.
Read more here.
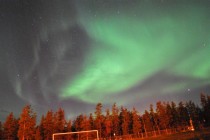
Yukon Aurora - Ted Lambert, posted on Spaceweather.com
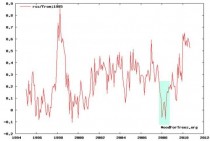
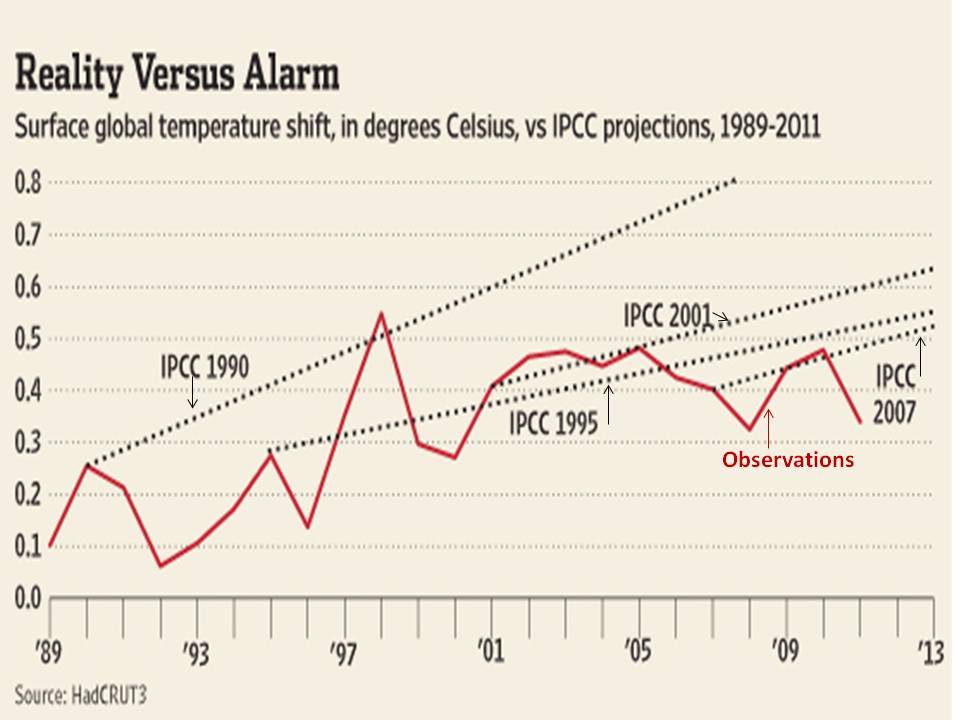
By Steven Goddard, Real Science

Enlarged here. Source is here.
“What is clear, though, is that the warmest 12-month period in the GISS analysis was reached in mid-2010,” El Hansen said.
Besides the fact that his statement is almost undoubtedly incorrect, he also carefully cherry-picked a strong El Nino for his 12-month period (red rectangle.)
That is two strikes so far, and here is strike three. In 2008, temperatures did the opposite during a La Nina. They got very cold (blue rectangle.)
Enlarged here.
How did El Hansen react to this equal and opposite event?
“Undoubtedly, the cooling trend through the year was due to the strengthening La Nina, and the unusual coolness in January was aided by a winter weather fluctuation. The reason to show these is to expose the recent nonsense that has appeared in the blogosphere, to the effect that recent cooling has wiped out global warming of the past century, and the Earth may be headed into an ice age. On the contrary, these misleaders have foolishly (or devilishly) fixated on a natural fluctuation that will soon disappear.
So here is how the game works. You cherry-pick a twelve month El Nino period, adjust the temperatures up, call it the hottest year ever, call any differing opinions corrupt, and then wave off a complimentary cold period as just weather.
El Diablo.
See post here.
ICECAP NOTE: What Hansen and his cohorts are ignoring is that in the cold PDO mode we are now in, El Nino blips will be fewer and farther between and with more La Ninas the trend in temperatures will be down. Add a Eddy Solar Minimum and you will see the downtrend accelerate.
By Paul Chesser, American Spectator
Commenter Susan made me aware in my earlier blog post that 350.org’s Bill McKibben, a partner with 1010.org, has issued a statement that claimed his group had nothing to do with their gross-out, kill-the-deniers video, and called it “disgusting.” From his statement, which he issued after learning about the video after he (surprise!) climbed off a plane in Boston:
Climate skeptics are going to make a big deal of this. The video represents the kind of stupidity that really hurts our side, reinforcing in people’s minds a series of preconceived notions, not the least of which is that we’re out-of-control elitists. Not to mention crazy, and also with completely misplaced sense of humor....
Crazy? Now where would we get that idea, Bill? Maybe from your lamentations at church in Copenhagen:
“Those damned shriveled ears of corn. I’ve done everything I can think of, and millions of people around the world have joined us at 350.org in the most international campaign there ever was. But I just sat there thinking: It’s not enough. We didn’t do enough. I should have started earlier. People are dying already; people are sitting tonight in their small homes trying to figure out how they’re going to make the maize meal they have stretch far enough to fill the tummies of the kids sitting there waiting for dinner. And that’s with 390 parts per million CO2 in the atmosphere.”
----------
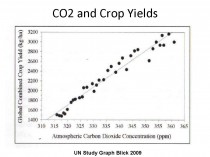
ICECAP NOTE: Actually the CO2 helped. NASA satellites have shown greening of the middle latitudes in recent decades due to increasing CO2 with an estimated 30% increase in yields and 10% more arable lands. See also the UN plot of yields as CO2 has increased.
McKibben, the UN and the other alarmists want us to turn back the clock and reverse this. In addition, controls on agriculture are proposed to reduce irrigation, fertilization and some groups oppose farm animals that produce methane. The enviros oppose genetically modified plants - but the revolution that has occurred in hybrids has allowed for more drought resistent, insect resistant plants and better crops under less than ideal conditions.
Recall that 1988 had very similar conditions of a strong La Nina following a strong El Nino. The hot summer had a major drought that led to over $40 billion in crop losses. Even with warmer temperatures in some places this year, the crop yields may have been at record levels. CO2 has little or no effect on climate but has been a boon to agriculture. We need a new organization - maybe 1010.org should be transformed. We should target a CO2 level of 1010 ppm. Plants would love it.

Bill McKibben Below return to post
-----------
Or from that last book you wrote—“Eaarth:”
“The world hasn’t ended, but the world as we know it has—even if we don’t quite know it yet,” [McKibben] writes. “It’s a different place. A different planet. It needs a new name.” Since it’s earth-like, he says, let’s call it “Eaarth.”
Or perhaps from your political instincts:
The task at hand is keeping the planet from melting. We need everyone—beginning with the president—to start explaining that basic fact at every turn.”
Yeah Bill—flyin’ all over the place to give speeches, talkin’ ‘bout death and destruction...just where would we get the idea that you’re all crazy elitists? And then you say stuff like this today:
We’ve known the (1010.org video) creators for years--they put out a statement apologizing for their lapse. But it’s the kind of mistake that will haunt and hurt efforts.
McKibben’s so elitist and crazy that he doesn’t even realize it was not a mistake; it was absolutely intentional, with a lot of people devoting weeks, if not months, of planning into it.
It was not a mistake because it revealed what the alarmists really are.
Read more here.
University of Utrecht, 24 September 2010
Large-scale groundwater extraction for irrigation, drinking water or industry results in an annual rise in sea levels of approximately 0.8 mm, accounting for about one-quarter of total annual sea-level rise (3.1 mm). According to hydrologists from Utrecht University and the research institute Deltares, the rise in sea levels can be attributed to the fact that most of the groundwater extracted ultimately winds up in the sea. The hydrologists explain their findings in an article to be published in the near future in the journal Geophysical Research Letters.
Groundwater extraction is more common in more arid regions of the world, where there is less available surface water. It is used for crop irrigation, drinking water or industrial purposes. Aquifer levels will decline if over a prolonged period more groundwater is extracted at more locations than can be replenished by means of rainwater recharge. As a consequence, rivers and wetlands will run dry and aquifer levels will fall to such a depth that pumping becomes impossible. Aquifer depletion can eventually spell ecological disaster or even lead to famine.
Rising sea levels
With the knowledge that most of the extracted groundwater eventually winds up in the sea, the researchers at Utrecht University and Deltares calculated the contribution groundwater extraction makes to rising sea levels. Researcher Marc Bierkens says, “We calculated it at eight-tenths of a millimetre per year. This is surprisingly large when compared to the current annual rise in sea levels, which the IPCC estimates at 3.1 mm.” About half of the current rise in sea levels can be attributed to thermal expansion, a little over one quarter to run off from glaciers and ice caps, and the remaining quarter to groundwater depletion. “Although the role of groundwater depletion in rising sea levels had already been acknowledged, it was not addressed in the most recent IPCC report due to a lack of reliable data to illustrate the severity of the situation. Our study confirms that groundwater depletion is, in fact, a significant factor.”
Groundwater depletion
The researchers looked at a combination of information to identify the areas in the world where groundwater extraction leads to groundwater depletion. An estimate of the amount of groundwater extracted annually in most of the world’s countries could be obtained from a database of the International Groundwater Resources Assessment Centre (IGRAC), which is affiliated with Deltares. Combining this information with the estimated demand for water, based on population density and data on irrigated areas, the researchers were able to produce a map of global groundwater extraction. A water balance model was then used to map out global groundwater aquifer recharge, i.e. precipitation that seeps through the soil to recharge groundwater aquifers. By subtracting the figures of the groundwater extraction map from the figures of the groundwater aquifer recharge map, the researchers were able to compile a map of global groundwater depletion.
Depletion worst in certain countries
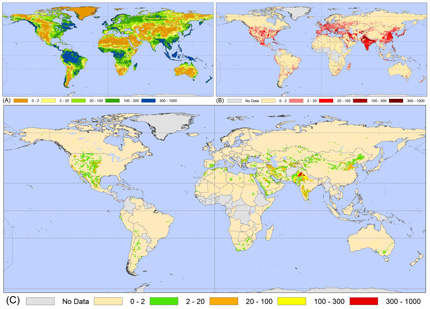
According to Bierkens, “The study reveals that depletion is the most acute in areas of India, Pakistan, the US and China, which are also the regions without sustainable levels of food production and water consumption and which are expected to experience major problems in the long run.” The hydrologists estimate that global groundwater extraction and depletion have increased by 312 km3 to 734 km3 and 126 km3 to 283 km3 per year, respectively, since 1960. See post here.
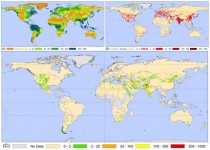
Enlarged here. The figure in the upper left-hand corner illustrates aquifer recharge (i.e. rainwater recharge), the figure in the upper right hand corner shows the severity of global groundwater extraction and the large figure below depicts global groundwater depletion. In this figure, “1000” denotes one cubic kilometre of water. The grey areas are regions for which there is no available data on groundwater extraction.
By James Delingpole
Steve McIntyre has been named one of the 50 People Who Matter by the left-wing journal New Statesman. He comes in at number 32. (Below a motley crew including Osama Bin Laden, Hugo Chavez, David Cameron, Julian Assange, Barack Obama, and the like). (H/T Roddy Campbell)

Here’s what his entry says:
When the mining expert Stephen McIntyre challenged the basis of climate science on his blog, he became a figurehead for many climate-change sceptics.
His subsequent involvement in the 2009 “Climategate” controversy at the University of East Anglia (he was referred to in the hacked emails over 100 times) emboldened the sceptics further and changed global opinion: the number of people who believe man is responsible for global warming has fallen.
The influence might not be positive, but there’s no doubt he has shaped the debate.
But what’s much more interesting than the entry - because, let’s be honest, who really gives a toss what some dreary, ailing left-wing rag thinks - is the response to that stupid, priggish suggestion at the end that “the influence might not be positive.”
I hope the moron who wrote it is now squirming with embarrassment. He/she/it certainly should be after reading the thoroughly disgusted comments below.
Says the first:
“The influence might not be positive...”
So, McIntyre is wrong? May I ask for your evidence? Oh do tell. Put your money where your mouth is. Put your reputation on the line.
And the second:
If, by challenging the basis of climate change science, Stephen McIntyre has been influential in changing global opinion on the HYPOTHESIS of anthropogenic global warming, then it is a very certain positive influence. For policy makers to take drastic action based on an unproven hypothesis is absurd and Stephen has shown, by auditing or attempting to audit the climate scientists’ work, that the science is not at the level of accuracy, repeatability, and certainty required as the bases for taking such actions.
And the third:
We all owe Steve a debt of gratitude for shining some light on the obfuscations of climate science, before even more millions are wasted on what may well be a non-problem.
On and on the comments go - all of them positive. If these are regular New Statesman readers - and presumably at least some of them must be - then it affords yet another fascinating insight into how even those on the left are decreasingly convinced by the case for Man-Made Global Warming theory.
But let’s put aside politics for a moment for Steve McIntyre (who privately veers to the left rather than the right) is scrupulously apolitical. Read his blogs; read in the Hockey Stick Illusion the lengths he and Ross McKitrick went to, the vilification they endured, the walls of denial and silence and obfuscation and rudeness they had to climb over, in order to reveal the truth about Michael Mann’s silly hockey stick propaganda exercise. The truth: that’s all Steve McIntyre has ever cared about. His service to it is selfless and heroic.
If there’s any justice, one day he and McKitrick will share a Nobel Prize,
If there’s any justice. Yeah, right.
See post here.
By Paul Chesser, the Washington Times
Sen. Jeff Bingaman, New Mexico Democrat, and Sen. Sam Brownback, Kansas Republican (and the party’s gubernatorial nominee) must be gluttons for punishment.
Mandates to buy things - pushed by Washington - have fouled the political air. The public, which is shown in polls to hate Obamacare, hate most the part that obligates them to buy health insurance. What else do they despise? The ban on the incandescent light bulb, which begins to take effect in 2012 and will force everyone to buy higher-priced mercury-filled compact fluorescents for the rest of their lives. More than a few people hope for a repeal of both measures after the November elections.
So Americans are tired of the dictating, but what do the aforementioned senators do? They dictate more, with a proposed law that will force you to procure part of your electricity from windmills, solar farms and other costly sources. It’s called a Renewable Electricity Standard (RES), brought to you by politicians who think they know what’s good for you.
It works this way: The nation’s biggest utilities (think Exelon, Duke Energy, Xcel Energy), which supply the majority of the country’s power, are coerced into generating a minimum percentage of their electricity from alternative energy. It’s 15 percent under the Bingaman-Brownback bill. It costs much more for these resources - even after heavy subsidies from government - so the utilities must pass on the rate increases to their customers.
A study by the Washington-based Institute for Energy Research found that states with their own binding renewable electricity standards have 40 percent higher electricity prices than do states without such mandates. It is impossible to determine how much the extra costs are attributable to an RES (they are still relatively new), but the states that have them - mostly on the West Coast and in the upper Midwest and the Northeast - are generally known for greater government energy-market regulation than are those who don’t have them - mostly in the South. You get the picture.
But the implications won’t stop with the rise you see on your monthly power bill. Business and industry, which provide the products and services you consume every day, will not absorb these extra costs for the overall cause to “go green.” They will instead incorporate them in their charges to you.
So also will governments face larger electric bills, with schools, facilities and public buildings hit with the additional charges. There goes more spending of taxpayer dollars, again.
And don’t forget: Politicians love and alternative-energy companies need the subsidies that keep the solar and wind businesses alive. Without that massive infusion from taxpayers, they - the lawmakers without ribbon-cuttings and the rent-seekers without corporate welfare - could not survive.
Indeed, this summer, the American Wind Energy Association (AWEA) showed how dependent alternative energy interests are on taxpayers after the Senate omitted a national Renewable Electricity Standard from its energy bill. In a July 27 press release, AWEA stated, “The U.S. wind industry is in distress. Today we announced that with only 700 megawatts added in the second quarter, wind power installations to date this year have dropped by 57 percent and 71 percent from 2008 and 2009 levels, respectively, and manufacturing investment also continues to lag below 2008 and 2009 levels. An RES is a critical component to ensure the U.S. wind industry thrives.”
Understand? Squiggly light bulbs don’t sell without a government mandate. Windmills don’t sell without a mandate. And every other harebrained energy-generating scheme (like chicken-excrement incinerators) doesn’t sell without a mandate. Yet in about 30 states they get them - and subsidies, too.
Unfortunately, there may be enough of Mr. Bingaman’s and Mr. Brownback’s Senate colleagues to get a national renewable electricity standard passed - maybe even during a lame-duck session this year. While it doesn’t surprise that nearly all the Democrats are on board, Reuters reports that support from several Republicans could make a filibuster shutoff easy. The news service identified Alaska’s Lisa Murkowski, Nevada’s John Ensign, Maine’s Susan Collins and Olympia Snowe, Tennessee’s Bob Corker, Alabama’s Jeff Sessions, and Iowa’s Charles E. Grassley as members who have backed RESs in the past and might do so again.
Pretty amazing in this electoral season when “Throw the bums out” is the theme because people are fed up with government diktats. Will the Beltway establishment ever get it? Read more here.
Paul Chesser is a special correspondent for the Heartland Institute.
By Joseph D’Aleo
Last winter despite a strong El Nino was very cold (all-time coldest in some areas) in many parts of the Northern Hemisphere. A strong La Nina has come on during the summer, a very hot one (all-time in some of the very same areas where the winter was very cold). Other areas had record cool summer. The anomalies were not so much a case of extremes just persistence of the same pattern due to a stuck jet stream configuration.
Persistence is a characteristic of low solar years. The last several years have seen a lot of persistence within seasons. Strong El Ninos and La Ninas also tend to exhibit higher persistence.
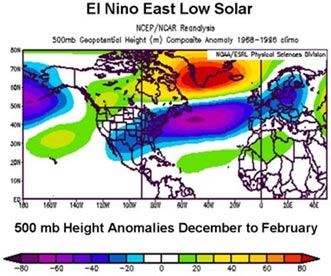
What about this winter? Well with a strong La Nina, cold PDO, warm Atlantic (AMO), QBO transitioning to westerly and a still low solar suggests the following.
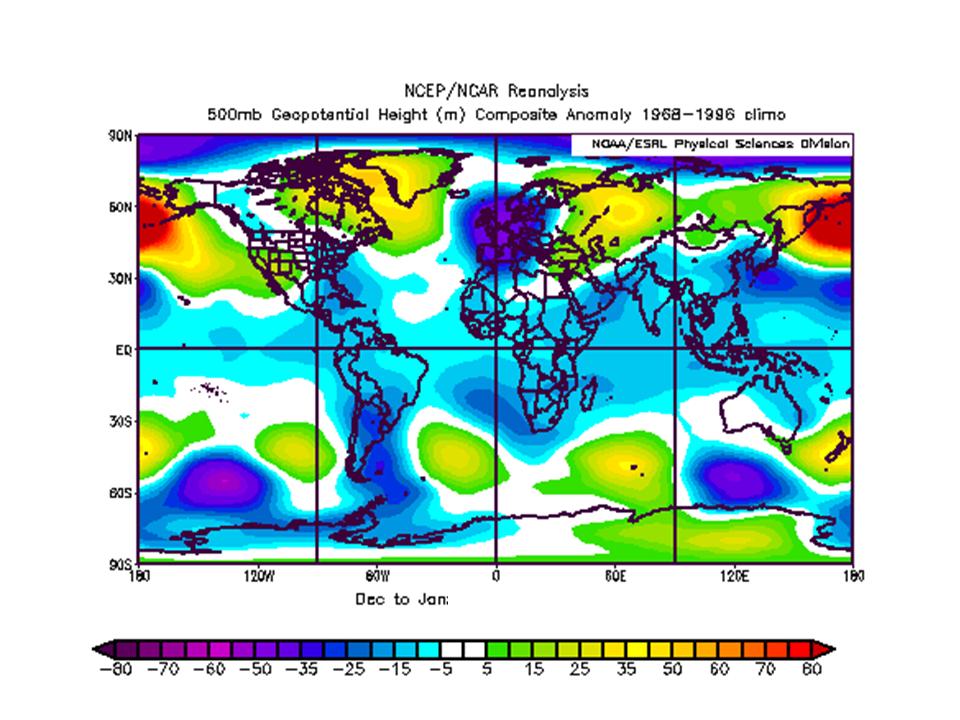
The 500mb geopotential height anomalies for the globe for December/January:

Enlarged here.
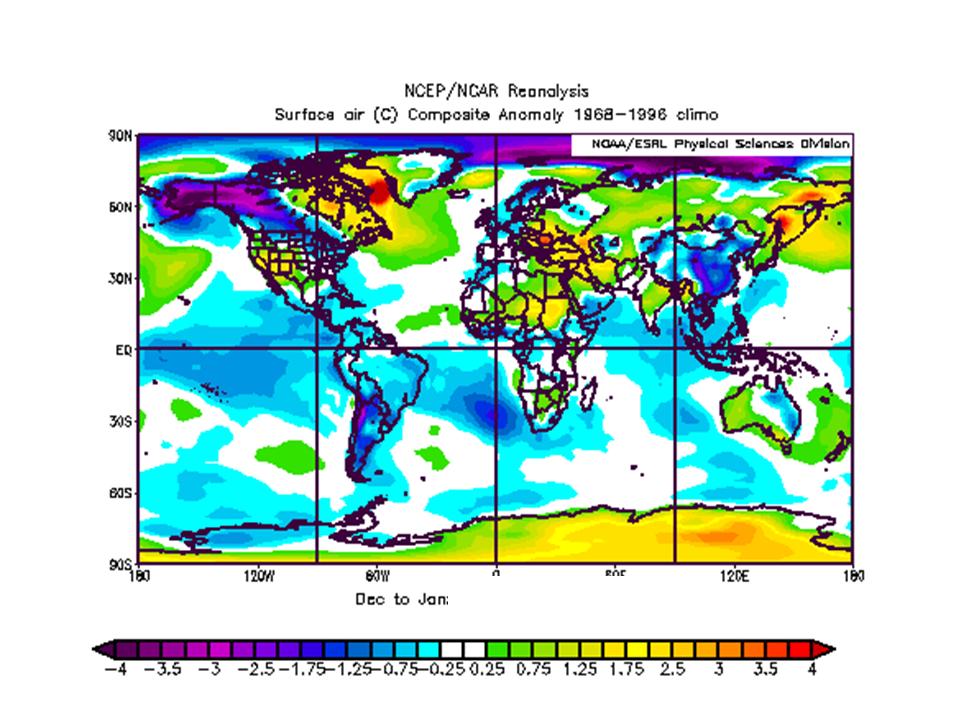
The surface temperature anomalies globally for December/January:

Enlarged here.
The 500 mb geopotential height anomaly for February/March:
Enlarged here.
The surface temperature anomaly for February/March:
Enlarged here.
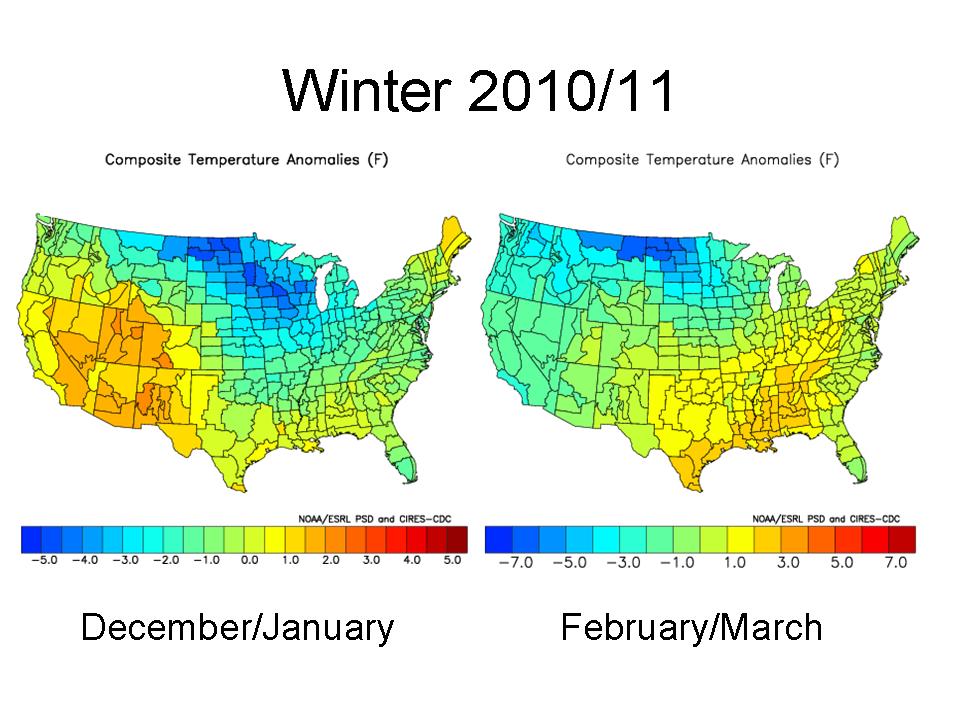
The winter (December/January and then February/March) for the United States:
Enlarged here.
For the US, this implies another cold winter for the upper Midwest, probably again heavy snows for the northwest, Rockies, Northern Plains, Midwest and northern New York and New England with ice storm threat(s) further south.
The same for Europe and western Asia:
Enlarged here.
This should mean more snow and cold for Great Britain and eventually much of Europe where they are getting used to weather more like the Dalton Minimum with snowy winters and long cold spells.
The winter should start out cold in central and eastern United States, Western Europe and China. A cool summer start seems in the cards for South America. The late winter looks very cold in Europe and western Asia, while the cold retreats west in the United States. Blocking in the Arctic/North Atlantic, last year at a 60 year record level, appears to be again a major factor.
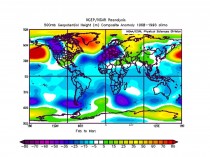
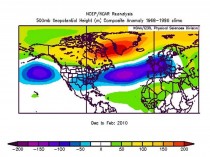
If you ask does this approach work, see how it worked last year when in the fall we predicted this pattern (height anomalies which correspond to surface temperature anomalies) for the winter at 500mb (enlarged here):
This is what the 500mb anomalies actually looked like (enlarged here):
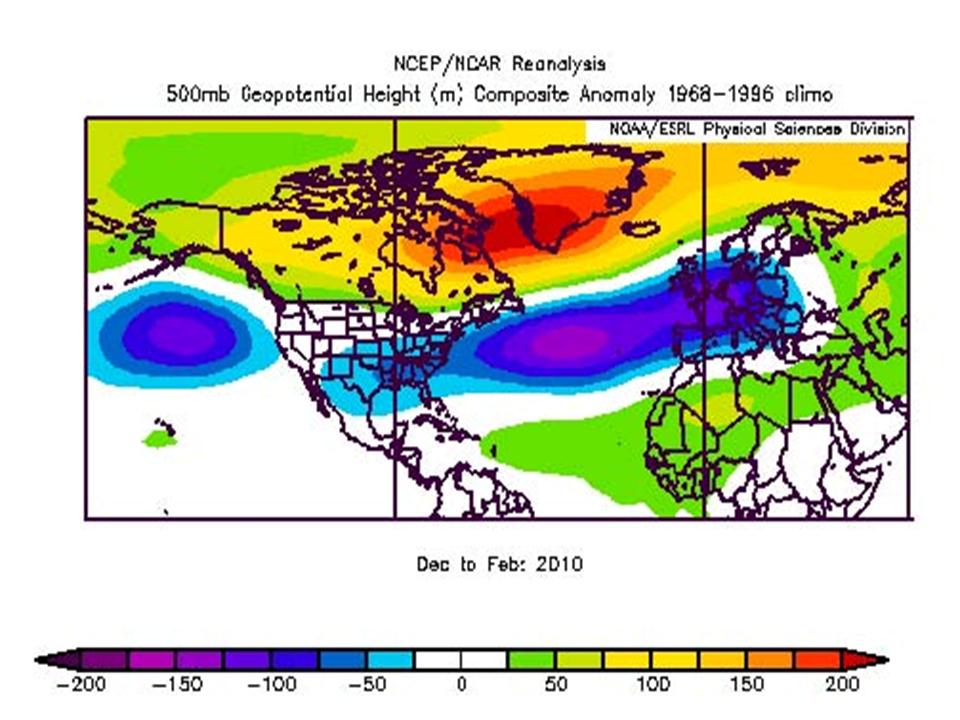
More to come. PDF
See Joe Bastardi’s take on it here. Joe nailed last winters heavy snow and cold in the south up to the Mid-Atlantic.