


By Piers Akerman, Daily Telegraph
PRIME Minister Kevin Rudd, the man who said he would never “knowingly” tell a lie, should begin the new Parliamentary session Tuesday with a few admissions of deceit. His massively exaggerated claims of catastrophic climate change caused by human activity have been thoroughly rejected by the UK chief scientist, John Beddington. Even Australia’s chief scientist, Penny Sackett, has been unable to provide any evidence to support her wild December claim that there are about five years to avoid dangerous climate change damage.
Both scientific chiefs are now calling for absolute openness and rigour in the presentation of climate science evidence. Professor Beddington says scientists should be more open about the uncertainty of predicting the rate of climate change but has he told his Australian counterpart, Professor Sackett?
This is scientific backdown with a capital “B”.
Before the Copenhagen fiasco, Mr Rudd was certain that human-induced climate change was the greatest moral challenge of our times. Now he is mute on the topic. So much for the need for the emissions trading legislation he plans to re-introduce this week. So much for his often-proclaimed decisiveness. So much for the need for certainty.

The Himalayan glaciers may not be melting, as the Intergovernmental Panel on Climate Change (IPCC) and Mr Rudd falsely claimed, but the UN’s credibility, and that of Rudd and his Climate Change Minister Penny Wong, has evaporated. In Britain, the Information Commissioner’s Office has found the University of East Anglia’s Climate Research Unit broke the Freedom of Information law throughout 2007 and 2008. The unit was one of the principal sources the IPCC, the Australian Government and CSIRO has relied upon for its human-induced global warming propaganda.
Little wonder that climate change scientists on both sides of the debate are going back to the original data to try and find material that has not been tampered with. Of course, Mr Rudd was such a proponent of man-made global warming that he gave $1 million late last year to the Tata Energy Research Institute. This is the Indian organisation run by the chairman of the IPCC, Dr Rajendra Pachauri, who was recently forced to admit that the IPCC claim in its 2007 report that Himalayan glaciers could disappear by 2035 had no scientific basis, and its inclusion in the report reflected a “poor application” of IPCC procedures.
In fact, they represented worse than a “poor application” of procedures; they represented zero application of anything but a desire to present propaganda on the behalf of governments pushing to impose a new global body on nations participating in the Copenhagen conference that would oversee wealth redistribution and enforce punitive carbon emission levels on the wealthier nations.
It’s all there in copies of the draft agreement Australia had a hand in preparing before the conference and can now be found with a couple of mouse clicks on the internet. Dr Pachauri has his fingers in many odious pies, due to the expanding worldwide business connections he’s made since becoming chairman of the IPCC. He is now a very wealthy man. Could Mr Rudd explain why it was necessary to present this individual with $1 million of Australian taxpayers’ funds without any justification or accountability?
As the Wall Street Journal sagely observed last week, while the harm from global warming is speculative, the harm from global warmists is real. In the two years Mr Rudd has been in office, he has shown no skill in any area (discounting his co-authorship of a children’s book about his dog and his cat) beyond giving away the wealth of the nation.
He rapidly went through the surplus that was painstakingly amassed by the previous Howard-Costello government. Then he started to spend funds he didn’t have to protect the nation from the fallout of the global fiscal collapse. The problem was that, despite his claims, the collapse was not global. Australia came through virtually unscathed because of the strength of financial regulation brought in by the Howard-Costello and the Hawke-Keating governments and the rapacious demand for commodities from the growth markets of Asia.
It is increasingly obvious that Mr Rudd is not a diplomat’s bootlace, as our foreign relations are at their lowest ebb in decades. Nor does he understand numbers. He doesn’t even know how many Australians there are, selling the population short by one million when he told The 7.30 Report on Thursday there were 21 million of us.
As for finances, he is now going to give $100 million to Afghanistan, with $25 million earmarked for the Taliban. Should our troops there be writing cheques or firing bullets? All of these are serious issues but in the lead-up to this week’s parliamentary session, the Labor Government, led by Deputy Prime Minister Julia Gillard, has chosen to focus on the sex lives of teenage girls.
The new Opposition leader Tony Abbott has a smorgasbord of issues with which to confront the Rudd Government, which is a master of spin and obfuscation. Like a good editor, Abbott and his team must cut through the verbiage. It is important he does not get distracted by the frippery with which elements of the media are obsessed, but concentrates on the matters that are important to Australians. Read more here.
By Anthony Watts
There has been a lot of buzz about the Menne et al 2010 paper “On the reliability of the U.S. Surface Temperature Record” which is NCDC’s response to the surfacestations.org project. One paid blogger even erroneously trumpeted the “death of UHI” which is humorous, because the project was a study about station siting issues, not UHI. Anybody who owns a car with a dashboard thermometer who commutes from country to city can tell you about UHI.

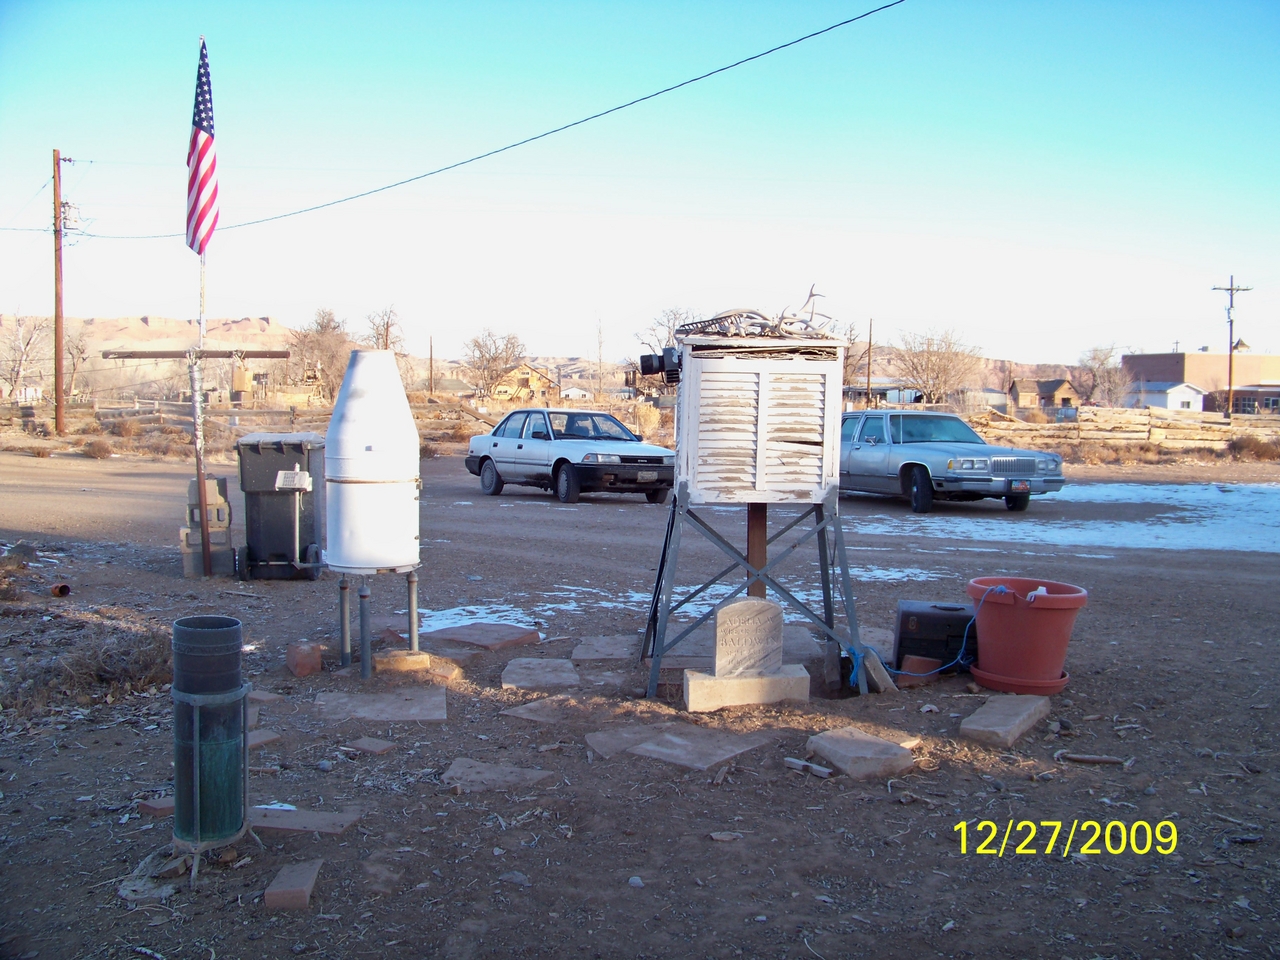
Image: NOAA USHCN COOP station at Hanksville, UT, sited over a grave. Photo by surfacestations volunteer Juan Slayton.
Larger image here.
There’s also claims of this paper being a “death blow” to the surfacestations project. I’m sure in some circles, they believe that to be true. However, it is very important to point out that the Menne et al 2010 paper was based on an early version of the surfacestations.org data, at 43% of the network surveyed. The dataset that Dr. Menne used was not quality controlled, and contained errors both in station identification and rating, and was never intended for analysis. I had posted it to direct volunteers to so they could keep track of what stations had been surveyed to eliminate repetitive efforts. When I discovered people were doing ad hoc analysis with it, I stopped updating it.
Our current dataset at 87% of the USHCN surveyed has been quality controlled.
There’s quite a backstory to all this.
In the summer, Dr. Menne had been inviting me to co-author with him, and our team reciprocated with an offer to join us also, and we had an agreement in principle for participation, but I asked for a formal letter of invitation, and they refused, which seems very odd to me. The only thing they would provide was a receipt for my new data (at 80%) and an offer to “look into” archiving my station photographs with their existing database. They made it pretty clear that I’d have no significant role other than that of data provider. We also invited Dr. Menne to participate in our paper, but he declined.
The appearance of the Menne et al 2010 paper was a bit of a surprise, since I had been offered collaboration by NCDC’s director in the fall. In typed letter on 9/22/09 Tom Karl wrote to me:
“We at NOAA/NCDC seek a way forward to cooperate with you, and are interested in joint scientific inquiry. When more or better information is available, we will reanalyze and compare and contrast the results.”
“If working together cooperatively is of interest to you, please let us know.”
I discussed it with Dr. Pielke Sr. and the rest of the team, which took some time since not all were available due to travel and other obligations. It was decided to reply to NCDC on a collaboration offer.
On November 10th, 2009, I sent a reply letter via Federal Express to Mr. Karl, advising him that we would like to collaborate, and offered to include NCDC in our paper. In that letter I also reiterated my concerns about use of the preliminary surfacestation data (43% surveyed) that they had, and spelled out very specific reasons why I didn’t think the results would be representative nor useful.
We all waited, but there was no reply from NCDC to our reply to offer of collaboration by Mr. Karl from his last letter. Not even a “thank you, but no”.
Then we discovered that Dr. Menne’s group had submitted a paper to JGR Atmospheres using my preliminary data and it was in press. This was a shock to me since I was told it was normal procedure for the person who gathered the primary data the paper was based on to have some input in the review process by the journal.
NCDC uses data from one of the largest volunteer organization in the world, the NOAA Cooperative Observer Network. Yet NCDC director Karl, by not bothering to reply to our letter about an offer he initiated, and by the journal not giving me any review process opportunity, extends what Dr. Roger Pielke Senior calls “professional discourtesy” to my own volunteers and my team’s work. See his weblog on the subject:
Professional Discourtesy By The National Climate Data Center On The Menne Et Al 2010 paper
I will point out that Dr. Menne provided thanks to me and the surfacestations volunteers in the Menne et al 2010 paper, and I hear through word of mouth, also in a recent verbal presentation. For that I thank him. He has been gracious in his communications with me, but I think he’s also having to answer to the organization for which he works and that limited his ability to meet some of my requests, like a simple letter of invitation.
Political issues aside, the appearance of the Menne et al 2010 paper does not stop the surfacestations project nor the work I’m doing with the Pielke research group to produce a peer reviewed paper of our own. It does illustrate though that some people have been in a rush to get results. Texas state Climatologist John Neilsen-Gammon suggested way back at 33% of the network surveyed that we had a statistically large enough sample to produce an analysis. I begged to differ then, at 43%, and yes even at 70% when I wrote my booklet “Is the US Surface Temperature Record Reliable?”, which contained no temperature analysis, only a census of stations by rating.
The problem is known as the “low hanging fruit problem”. You see this project was done on an ad hoc basis, with no specific roadmap on which stations to acquire. This was necessitated by the social networking (blogging) Dr. Pielke and I employed early in the project to get volunteers. What we ended up getting was a lumpy and poorly spatially distributed dataset because early volunteers would get the stations closest to them, often near or within cities.
The urban stations were well represented in the early dataset, but the rural ones, where we believed the best siting existed, were poorly represented. So naturally, any sort of study early on even with a “significant sample size” would be biased towards urban stations. We also had a distribution problem within CONUS, with much of the great plains and upper midwest not being well represented.
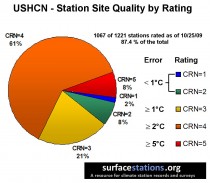
This is why I’ve been continuing to collect what some might consider an unusually large sample size, now at 87%. We’ve learned that there are so few well sited stations, the ones that meet the CRN1/CRN2 criteria (or NOAA’s 100 foot rule for COOPS) are just 10% of the whole network. See our current census:
When you have such a small percentage of well sited stations, it is obviously important to get a large sample size, which is exactly what I’ve done. Preliminary temperature analysis done by the Pielke group of the the data at 87% surveyed looks quite a bit different now than when at 43%.
It has been said by NCDC in Menne et al “On the reliability of the U.S. surface temperature record” (in press) and in the June 2009 “Talking Points: related to “Is the U.S. Surface Temperature Record Reliable?” that station siting errors do not matter. However, I believe the way NCDC conducted the analysis gives a false impression because of the homogenization process used. As many readers know, the FILNET algorithm blends a lot of the data together to infill missing data. This means temperature data from both well sited and poorly sited stations gets combined to infill missing data. The theory is that it all averages out, but when you see that 90% of the USHCN network doesn’t meet even the old NOAA 100 foot rule for COOPS, you realize this may not be the case.
Here’s a way to visualize the homogenization/FILNET process. Think of it like measuring water pollution. Here’s a simple visual table of CRN station quality ratings and what they might look like as water pollution turbidity levels, rated as 1 to 5 from best to worst turbidity.
In homogenization the data is weighted against the nearby neighbors within a radius. And so a station might start out as a “1” data wise, might end up getting polluted with the data of nearby stations and end up as a new value, say weighted at “2.5”. Even single stations can affect many other stations in the GISS and NOAA data homogenization methods carried out on US surface temperature data here and here.
Larger image here.
See full post and comments here.
By Viv Forbes, Carbon Sense Coalition
Our American friends remember The Alamo, we see Gallipoli and North Africa among defining moments in national pride and self-sacrifice against seemingly insurmountable odds.

Viv Forbes, rallying the troops
These initial bloody defeats led state and nations on to ultimate victory against powerful foes. It’s drawing a long bow to compare any of those to the political battle now being fought on global warming, but one prominent climate realist has done that, and it’s sure to grab some attention.
Federal Parliament resumes next week, an emissions trading scheme will be revisited for the third time, and a mass rally of farmers pushing for land rights in the wake of Peter Spencer’s solo “Tower of Hope” protest will converge on Canberra.
At the same time, head of the Carbon Sense Coalition, Viv Forbes, is rallying his troops with comparisons to El Alamein, the battle which proved a turning point in halting the Nazi’s World War II advance in North Africa and Europe. Forbes, a wiry, whip-tough grazier and pastoralist, is also a qualified geologist and soil scientist who runs a stud of Sherana sheep, cattle and goats on his property at Rosevale in southeast Queensland.
He holds a mantra in common with other leading climate realists such as Professors Ian Plimer, Bob Carter and hereditary British Peer Lord Christopher Monckton, now visiting Australia on a lecture tour: “Carbon dioxide is not a pollutant but a natural trace gas essential to all plant and animal life on earth”. They point to times in Earth’s history when concentrations of CO2 were much higher, plants thrived, coral reefs grew prolifically and polar bears survived. They do not believe man’s “greenhouse gas emissions” are a major driver of global warming."Forbes relentlessly churns out newsletters packed with controversial prose, such as his latest effort:
“Like the British Eighth Army in North Africa in the 1940’s, climate realists have been in continual retreat since the Climate War started. Led by Al Gore’s trained regiments using Nobel Prize gunpowder, backed by academic and government snipers using manipulated temperature data, financed by endless conveys carrying tax payer funds, reinforced by a steady barrage of scare forecasts from the media, and legislative carpet bombing from pliant politicians, the Green Army looked invincible. But suddenly the tide turned.
“What started with the Climategate scandals was followed by the defeat of the Ration-N-Tax Scheme in the Australian Senate and the defeat of the IPCC in Copenhagen. Then we had the IPCC fraud regarding Himalayan glaciers and the serial failures of the weather forecasts from the alarm-promoting British Met Office. Now data manipulation scandals are unfolding in USA, New Zealand and Australia.
“And finally, with the sound defeat of a key Obama Senate candidate in the US, we are seeing the end of the climate equivalent of the long Battles of El Alamein.
“We hope Churchill’s comment is apt today:” Before Alamein we never saw a victory. After Alamein we never saw a defeat. We must not relax after these small victories. In Australia, the Rudd/Wong/Turnbull Axis will never surrender. Already there is talk that the Greens, supported by Turncoat Liberals may allow the Ration-N-Tax Scheme to pass in the Australian Senate.
“It is time to go on the offensive...”
Forbes tells his followers to alert people in politics, business, government, media and the unions they face a revolt of their supporters if they provide “uncritical support for the global warming agenda”.
“We must tell every politician who votes for any legislation based on the disgraced propaganda from the IPCC that he/she will be relentlessly punished in pre-selections, elections and fund raising. Let them know that we will actively work to replace them with more rational politicians and parties.
“There is a political sea change coming and those politicians and parties who do not switch in time will be swept out with the tide.” He also has in his sights businesses relying on subsidies, market mandates or carbon taxes to profit from “artificial industries” such as carbon trading, carbon credits, wind farms, solar power, carbon sequestration or bio-fuels. Union leaders must be warned they should expect a revolt from their members when hidden costs of the global warming agenda start hitting their jobs.
“Warn those academics and bureaucrats who produce scare forecasts on demand they will be called to account for damages they have caused. Protest property confiscation. Take the lead from people like Peter Spencer and use every weapon available against those who destroy or confiscate assets with changes in coastal zoning laws, bans on development, clearing weeds and regrowth, or sterilisation of farms and grasslands with declaration of political parks and non-development areas”.
Forbes says this battle will be international and Australia, Canada and United States are key battlegrounds. Read more hereIcecap enthusiastically supports the efforts of Viv Forbes and the many others fighting to save Australia and world from government control over all aspects of our life and the destruction of the world’s economies He writes about the huge enthusiastic turnout of ordinary men and women for the Monckton-Plimer meetings in working towns like Newcastle. Many were union members concerned for their jobs. May their voices be heard loud and clear in parliament.
By Anthony Watts, Watts Up With That
The IPCC “Flavor of the day"-gate is now the Amazon Rain Forest. What will tomorrow’s flavor be? James Delingpole of the Telegraph says this better than I ever could, so I’ll provide his summary here. Note that there are plenty more cases of unsubstantiated non peer reviewed references in the IPCC report, a list of which you can see here. For those wondering what “Load of porkies” means, see this.
Delingpole relays North’s analysis:
Here’s the latest development, courtesy of Dr Richard North - and it’s a cracker. It seems that, not content with having lied to us about shrinking glaciers, increasing hurricanes, and rising sea levels, the IPCC’s latest assessment report also told us a complete load of porkies about the danger posed by climate change to the Amazon rainforest.
This is to be found in Chapter 13 of the Working Group II report, the same part of the IPCC fourth assessment report in which the “Glaciergate” claims are made. There, is the startling claim that (below capture, enlarged here):

At first sight, the reference looks kosher enough but, following it through, one sees (below, enlarged here):
![]()
This, then appears to be another WWF report, carried out in conjunction with the IUCN - The International Union for Conservation of Nature.
The link given is no longer active, but the report is on the IUCN website here. Furthermore, the IUCN along with WWF is another advocacy group and the report is not peer-reviewed. According to IPCC rules, it should not have been used as a primary source.
It gets even better. The two expert authors of the WWF report so casually cited by the IPCC as part of its, ahem, “robust” “peer-reviewed” process weren’t even Amazon specialists. One, Dr PF Moore, is a policy analyst:
“My background and experience around the world has required and developed high-level policy and analytical skills. I have a strong understanding of government administration, legislative review, analysis and inquiries generated through involvement in or management of the Australian Regional Forest Agreement process, Parliamentary and Government inquiries, Coronial inquiries and public submissions on water pricing, access and use rights and native vegetation legislation in Australia and fire and natural resources laws, regulations and policies in Indonesia, Vietnam, Thailand, South Africa and Malaysia.
And the lead author Andy Rowell is a freelance journalist (for the Guardian, natch) and green activist:
Andy Rowell is a freelance writer and Investigative journalist with over 12 years’ experience on environmental, food, health and globalization issues. Rowell has undertaken cutting-edge investigations for, amongst others, Action on Smoking and Health, The Campaign for Tobacco-Free Kids, Friends of the Earth, Greenpeace, IFAW, the Pan American Health Organization, Project Underground, the World Health Organization, World in Action and WWF.
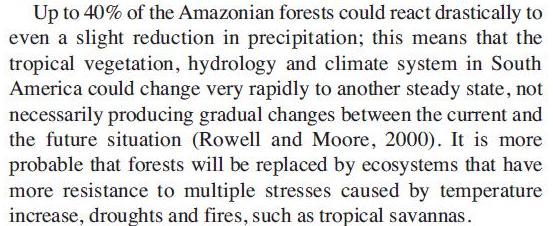
But the IPCC’s shamelessness did not end there. Dr North has searched the WWF’s reports high and low but can find no evidence of a statement to support the IPCC’s claim that “40 per cent” of the Amazon is threatened by climate change. (Logging and farm expansion are a much more plausible threat).
Read Delingpole’s blog here, North’s Blog here. I recommend adding them to your blog roll. I have.
-------------------
IPCC Statements on Trends in Diaster Losses
By Roger Pielke Jr.
The IPCC has issued a statement in response to the Sunday Times article on errors in the IPCC treatment of disaster losses and climate change. The IPCC statement (PDF) is a remarkable bit of spin and misinformation. Here it is with my comments:
Geneva, 25 January 2010
IPCC STATEMENT ON TRENDS IN DISASTER LOSSES
The January 24 Sunday Times article on errors in the IPCC treatment of disaster losses and climate change. The IPCC statement (PDF) is a remarkable bit of spin and misinformation. Here it is with my comments:” title="Sunday Times “>Sunday Times ran a misleading and baseless story attacking the way the Fourth Assessment Report of the IPCC handled an important question concerning recent trends in economic losses from climate-related disasters. The article, entitled “UN Wrongly Linked Global Warming to Natural Disasters”, is by Jonathan Leake.
The Sunday Times article gets the story wrong on two key points. The first is that it incorrectly assumes that a brief section on trends in economic losses from climate-related disasters is everything the IPCC Fourth Assessment Report (2007) has to say about changes in extremes and disasters.
RESPONSE: This is pure misdirection and is irrelevant. The issue here is specific to how the IPCC handled the rising costs of disasters and its relationship to increasing temperature. It is not about the general theme of extremes.
In fact, the Fourth Assessment Report reaches many important conclusions, at many locations in the report, about the role of climate change in extreme events. The assessment addresses both observations of past changes and projections of future changes in sectors ranging from heat waves and precipitation to wildfires. Each of these is a careful assessment of the available evidence, with a thorough consideration of the confidence with which each conclusion can be drawn.
RESPONSE: All of this verbiage is irrelevant to the issue.
The second problem with the article in the Sunday Times is its baseless attack on the section of the report on trends in economic losses from disasters. This section of the IPCC report is a balanced treatment of a complicated and important issue.
RESPONSE: Asserting balance does not make it so. The facts here are what the IPCC should respond to: The IPCC report highlighted a single non-peer reviewed study to make a claim that (a) that study did not support, and (b) that was countered by the entirety of the peer reviewed literature (much of which went uncited). My work was misrepresented in the text and in the IPCC response to reviewers. The latter included an outright lie. The only balance that was achieved was between misrepresentation and error. It clearly makes the point that one study detected an increase in economic losses, corrected for values at risk, but that other studies have not detected such a trend. The tone is balanced, and the section contains many important qualifiers.
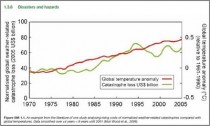
RESPONSE: This statement is remarkable for its untruths. (1) The “one study” did not detect a trend over the full period of record, only a cherrypicked subset, and when that paper was published it explicitly stated that it could not find a signal of increasing temperatures in the loss record, (2) The IPCC report did not note that other studies had not found a trend, except when citing my work in passing, and then undercutting it in error by mistakenly citing the 2004 and 2005 hurricane seasons to suggest something different (and untrue). (3) The Chapter includes the following figure, which has absolutely no scientific support whatsoever:
In writing, reviewing, and editing this section, IPCC procedures were carefully followed to produce the policy-relevant assessment that is the IPCC mandate.
RESPONSE: Carefully followed procedures? Let’s review: (a) The IPCC relied on an unpublished, non-peer reviewed source to produce its top line conclusions in this section, (b) when at least two reviewers complained about this section, the IPCC ignored their compalints and invented a response characterizing my views. (c) When the paper that this section relied on was eventually published it explicitly stated that it could not find a connection between rising temperatures and the costs of disasters.
This press release from the IPCC would have been a fine opportunity to set the scientific and procedural record straight and admit to what are obvious and major errors in content and process. Instead, it has decided to defend the indefensible, which any observer can easily see through. Of course there is no recourse here as the IPCC is unaccountable and there is no formal way to address errors in its report or its errors and misdirection via press release. Not a good showing by the IPCC. Read more here.
See also this Paul Chesser American Spectator story Discredited IPCC Also Reveals Media’s Malpractice.
Richard Foot, Canwest News Service
Call it the mystery of the missing thermometers.
Two months after “climategate” cast doubt on some of the science behind global warming, new questions are being raised about the reliability of a key temperature database, used by the United Nations and climate change scientists as proof of recent planetary warming.
Two American researchers allege that U.S. government scientists have skewed global temperature trends by ignoring readings from thousands of local weather stations around the world, particularly those in colder altitudes and more northerly latitudes, such as Canada.
In the 1970s, nearly 600 Canadian weather stations fed surface temperature readings into a global database assembled by the U.S. National Oceanic and Atmospheric Administration (NOAA). Today, NOAA only collects data from 35 stations across Canada.
Worse, only one station—at Eureka on Ellesmere Island—is now used by NOAA as a temperature gauge for all Canadian territory above the Arctic Circle.
The Canadian government, meanwhile, operates 1,400 surface weather stations across the country, and more than 100 above the Arctic Circle, according to Environment Canada. Yet as American researchers Joseph D’Aleo, a meteorologist, and E. Michael Smith, a computer programmer, point out in a study published on the website of the Science and Public Policy Institute, NOAA uses “just one thermometer [for measuring] everything north of latitude 65 degrees.”
Both the authors, and the institute, are well-known in climate-change circles for their skepticism about the threat of global warming.
Mr. D’Aleo and Mr. Smith say NOAA and another U.S. agency, the NASA Goddard Institute for Space Studies (GISS) have not only reduced the total number of Canadian weather stations in the database, but have “cherry picked” the ones that remain by choosing sites in relatively warmer places, including more southerly locations, or sites closer to airports, cities or the sea—which has a warming effect on winter weather.
Over the past two decades, they say, “the percentage of [Canadian] stations in the lower elevations tripled and those at higher elevations, above 300 feet, were reduced in half.”
Using the agency’s own figures, Smith shows that in 1991, almost a quarter of NOAA’s Canadian temperature data came from stations in the high Arctic. The same region contributes only 3% of the Canadian data today.
Mr. D’Aleo and Mr. Smith say NOAA and GISS also ignore data from numerous weather stations in other parts of the world, including Russia, the U.S. and China.
They say NOAA collects no temperature data at all from Bolivia—a high-altitude, landlocked country—but instead “interpolates” or assigns temperature values for that country based on data from “nearby” temperature stations located at lower elevations in Peru, or in the Amazon basin.
The result, they say, is a warmer-than-truthful global temperature record.
“NOAA . . . systematically eliminated 75% of the world’s stations with a clear bias towards removing higher latitude, high altitude and rural locations, all of which had a tendency to be cooler,” the authors say. “The thermometers in a sense, marched towards the tropics, the sea, and to airport tarmacs.”
The NOAA database forms the basis of the influential climate modelling work, and the dire, periodic warnings on climate change, issued by James Hanson, the director of the GISS in New York.
Neither agency responded to a request for comment Wednesday from Canwest News Service. However Hanson did issue a public statement on the matter earlier this week.
“NASA has not been involved in any manipulation of climate data used in the annual GISS global temperature analysis,” he said. “The agency is confident of the quality of this data and stands by previous scientifically-based conclusions regarding global temperatures.”
In addition to the allegations against NOAA and GISS, climate scientists are also dealing with the embarrassment this week of the false glacier-melt warning contained in the 2007 report of the UN Panel on Climate Change. That report said Himalayan glaciers are likely to disappear within three decades if current rates of melting continue.
This week, however, the panel admitted there is no scientific evidence to support such a claim.
The revelations come only two months after the “climategate” scandal, in which the leak or theft of thousands of e-mails—private discussions between scientists in the U.S. and Britain—showed that a group of influential climatologists tried for years to manipulate global warming data, rig the scientific peer-review process and keep their methods secret from other, contrary-minded researchers.
Read more here. See interview of programmer Michael Smith with John Coleman here.
By Roger Pielke Sr.
There is an article in Science magazine on January 13 2010 titled
Exclusive: 2009 Hottest Year on Record in Southern Hemisphere by Eli Kintisch.
It reads
The United States may be experiencing one of the coldest winters in decades, but things continue to heat up in the Southern Hemisphere. Science has obtained exclusive data from NASA that indicates that 2009 was the hottest year on record south of the Equator. The find adds to multiple lines of evidence showing that the 2000s were the warmest decade in the modern instrumental record.
Southern Hemisphere temperatures can serve as a trailing indicator of global warming, says NASA mathematician Reto Ruedy of the Goddard Institute for Space Studies in New York City, given that part of the globe is mostly water, which warms more slowly and with less variability than land. Ruedy says 2009 temperatures in the Southern Hemisphere were 0.49C warmer than the period between 1951 and 1980, with an error of +/- 0.05C.
That makes 2009 the warmest year on record in that hemisphere. That’s significant because the second-warmest year, 1998, saw the most severe recorded instance in the 20th century of El Nino, a cyclic warming event in the tropical Pacific. During El Nino events, heat is redistributed from deep water to the surface, which raises ocean temperatures and has widespread climatic effects. But last year was an El Nino year of medium strength, which Ruedy says might mean that the warmer temperatures also show global, long-term warming as well as the regional trend.
The data come a month after announcements by the National Oceanic and Atmospheric Administration (NOAA) and by the World Meterological Organization that the decade of the 2000s was warmer than the 1990s. (NOAA estimates that the decade was 0.54C warmer than the 20th century average. The 1990s, by comparison, was 0.36C warmer by their measure.)
Meanwhile, NOAA is expected to announce possible record highs in the tropics when it releases its final report on 2009 temperatures on Friday. “This is one of the coldest winters we’ve experienced in a while up here in the northern latitudes,” says Derek Arndt of NOAA’s National Climatic Data Center in Asheville, North Carolina. “But we’re piling up a lot of heat in the tropics.”
However, their claim fails the reality check when even a cursory examination of the data (the “multiple lines of evidence") is made.
For example, see

See larger image here.
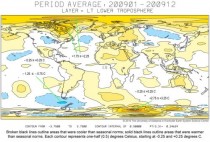
See larger image here.
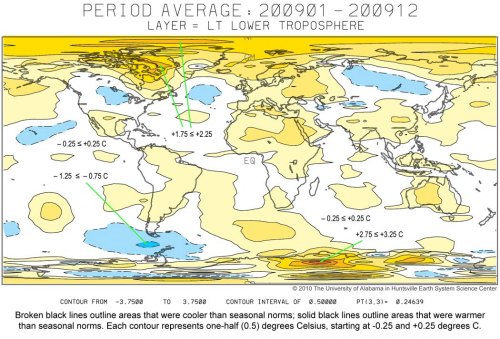
which I originally posted on January 8 2010.
John Christy has also provided the Southern Hemisphere lower tropospheric MSU derived temperature anomalies and 2010 was the 4th warmest in the period 1979-2009: The other years and their anomalies are 1998 (+0.41); 2002 (+0.30); 2005 (+0.24) and 2009 (+0.21). The anomaly of 1998 was almost twice the anomaly of 2009 in the Southern Hemisphere. The RSS MSU anomalies are also in close agreement with the UAH MSU data that John has provided.
The Science article perpetuates the focus on an inappropriately narrow assessment of global (and hemispheric) warming. This is misleading policymakers, and, with respect to Science magazine itself, is confirming that it is not presenting a balanced view of climate science. See post here.
By Dr. Michael J. Economides
It was a rubbing-the-eyes-in-disbelief headline even from an administration whose energy secretary, Steven Chu, suggested that America’s energy dilemma could be solved by painting roofs white, and whose interior secretary, Ken Salazar, talked of garnering 3,000 megawatts of wind-power capacity off the East Coast. (The current total electricity capacity from all U.S. energy sources is about 1,000 megawatts.)
Under the title “U.S. raises concern over China oil policy,” David Shear, deputy assistant secretary of state for East Asian and Pacific Affairs, told the House Armed Services Committee on Jan. 13:
“We are pursuing intensive dialogue with the Chinese on the subject of energy security, in which we have raised our concerns about Chinese efforts to lock up oil reserves with long-term contracts.”
Shear was responding to Republican Rep. Roscoe Bartlett of Maryland, who said he was “worried that the Chinese were aggressively buying up oil all over the world and might not share it with other countries in the future.”
Well, what do you know? The Obama administration, whose entire energy posture going back into the presidential campaign has been both ideologically and practically stridently anti-oil, both as an industry and as a form of energy, has suddenly become “concerned” about China’s oil grab.
This is, to say the least, disingenuous.
The U.S. government under Barack Obama has yet to acknowledge once, in spite of widely held estimates, that oil will continue to account for 40% of world energy demand 25 years from now — this while total world energy demand will increase by 50%, at least.
Nor has the administration, mired in Kyoto and Copenhagen global climate rhetoric, acknowledged that fossil fuels, oil, gas and coal will still account by then for over 85% of world energy demand, a largely unchanged contribution from what it is today.
Instead there is constant rhetoric about solar (the president’s favorite during the campaign), wind and “advanced biofuels” which, when combined, are not likely to account for more than 1% or 2% of the world energy demand over the next several decades.
In a Newsweek editorial last April 4, Chu expressed the administration’s energy philosophy and policy: “We must move beyond oil because the science on global warming is clear and compelling: Greenhouse-gas emissions, primarily from fossil fuels, have started to change our climate. We have a responsibility to future generations to reduce those emissions to spare our planet the worst of the possible effects.”
By Kirk Myers, Seminole County Examiner
Enjoy the January thaw while it lasts. The country may be headed for another deep freeze that could rewrite February’s record books and bring a repeat of the cold and snowy weather that froze half the nation in late December and early January.
“February is going to go down in memory as a month that was as cold and stormy as December,” predicts Joe Bastardi, chief long-range meteorologist for Accuweather. “It might turn out to be one of the coldest Februaries in the last 115 years.”
Bastardi’s frosty prediction is unlikely to warm the spirits of people living in the eastern half of the country, where some areas are still defrosting from an unseasonably frigid December - the 14th coldest in 115 years.
The blast of cold air was set in motion by a weather phenomenon known as the Arctic Oscillation (AO), which entered a severe “negative phase” (the most negative since 1950) late last year, bringing a colder weather pattern to many regions in the Northern Hemisphere. Since the AO went negative, record-setting snows and frigid temperatures have gripped Europe, China, India and a large swath of the United States.
The brutally cold weather brought snow flurries to Florida while other parts of the country east of the Rockies shivered in sub-zero temperatures. The same freakish weather swept across parts of China last week, producing heavy snows and frigid temperatures and triggering a coal shortage and electricity rationing. In Britain, more snowy weather is expected following arctic-like conditions earlier in the month that buried parts of the country in heavy snow, snarling roads and stranding thousands of motorists.
More unseasonably cold weather could be just around the corner, says Joe D’Aleo, a meteorologist for the Intellicast weather service and the executive director of the International Climate Environmental Change Assessment Project (ICECAP).
“The latest GEM and ECMWF [European Center for Medium Range Weather Forecasts] model runs are showing colder weather for the remainder of the winter. By the last week of January, we should see cold filling into Canada and then diving back down into the states,” he says.
Will the next arctic air mass make its way as far south as Florida? It depends on the strength and set-up of “blocking” high pressure ridges in the polar regions, according to D’Aleo. During the last big freeze, blocking highs re-directed the jet stream southward, funneling bitterly cold air across the Midwest and into the deep south.
“If the blocking highs are strong, and there is extensive leftover snow cover blanketing the northern states, we could see much colder temperatures in Florida,” D’Aleo says.
The early January outbreak of cold weather in Florida lingered for more than a week, breaking temperature records up and down the state and dusting Orlando and Tampa with snow.
Tom Terry, chief meteorologist for WFTV-Channel 9 in Orlando, doesn’t think Central Florida will see a replay of those arctic conditions.
“We usually get another cold snap in February around the time of the Daytona 500, but I don’t think we’ll see unseasonably cold temperatures. If we get close to what we experienced in early January, it would be truly remarkable,” he says.
Bastardi says the surge of cold air into Florida later this winter won’t be as intense or as long as the polar express that froze the Sunshine State in early January. Still, he predicts temperatures well below normal.
“I think February in Florida will be much colder than usual, and I wouldn’t be surprised if it snowed again in some places.”
This winter’s outbreak of cold across much of the northern hemisphere - and the decline in global temperatures in recent years - would appear to bolster the credibility of skeptics who claim global warming has ended and the planet has entered a period of global cooling.
So which is it? Is the earth warming or cooling? According to Bastardi, “We will get our answer in the next 20 to 30 years.”
In the meantime, he is predicting an American Pie February: “February made me shiver with each newspaper I’d deliver . . . .” Read more here.
-------------------------
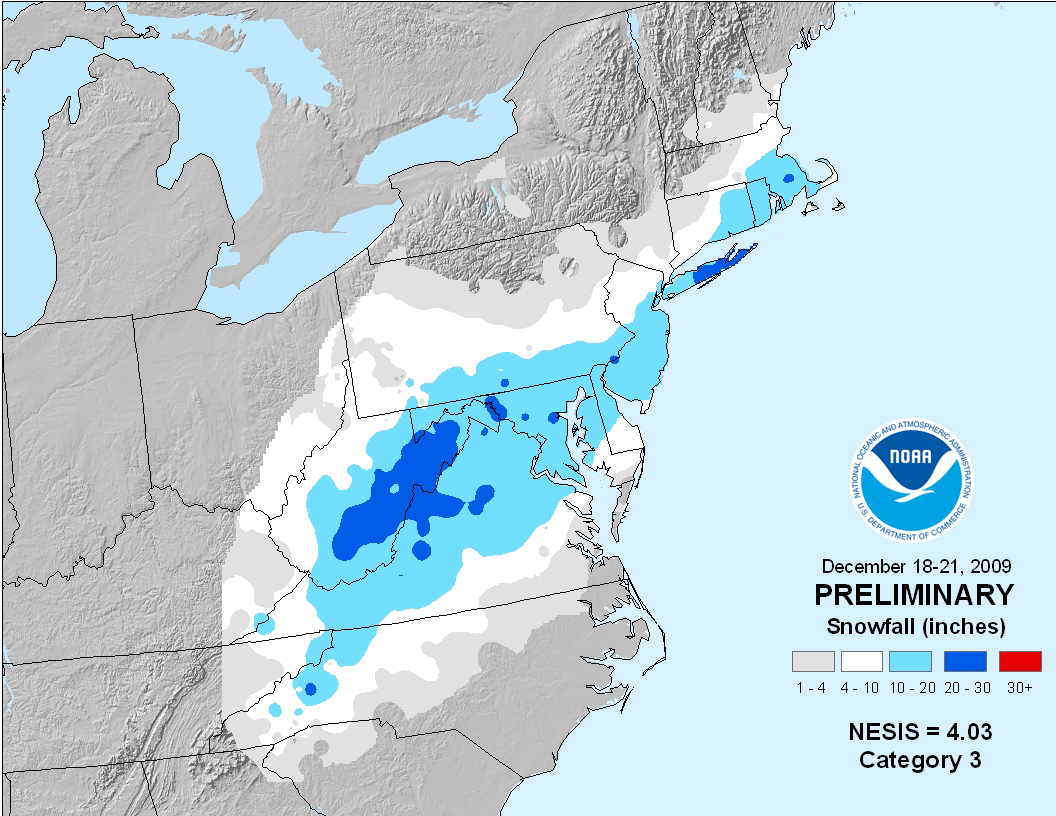
NOAA Ranks December Snowstorm a Category 3 on the Northeast Snowfall Impact Scale
To the surprise of no one affected by the Dec. 18-20, 2009 system that dumped heavy snow from the mid-Atlantic to southern New England, NOAA has rated the storm a Category 3 or “Major” winter storm on NOAA’s Northeast Snowfall Impact Scale, also known as NESIS (snowfall below, enlarged here).
NESIS characterizes and ranks Northeast snowstorms, using data calculated by NOAA’s National Climatic Data Center, based on the following factors: how much snow falls (must deposit at least 10 inches); the scale of the area impacted; and the population of the impacted area. NESIS ranks these storms on a five-tier scale ranging from Category 1 “Notable” to Category 5 “Extreme.”
“While snowfall from the December storm ranked in the top ten for Washington, Baltimore and Philadelphia, the storm only provided a glancing blow to the New York City and Boston metropolitan areas and overall affected a relatively small area. This led to it being classified as a Category 3,” said Louis Uccellini, director of the National Centers for Environmental Prediction - a division of NOAA’s National Weather Service - and co-developer of NESIS with Paul Kocin also with NCEP in Camp Springs, Md. Both Uccellini and Kocin are published winter weather experts.

Satellite image of the snowcover enlarged here.
“Last month’s storm was one of only five in the past decade that ranked Category 3 or higher,” added Kocin. The others being: December, 2002 (Category 3); February, 2003 (Category 4); January, 2005 (Category 4); February, 2006 (Category 3) and February, 2007 (Category 3).
Topping the NESIS scale - and the only storms rated Category 5 - are the “Superstorm” on March, 1993 followed by the “Blizzard of ‘96” in January, 1996. The scale, developed in 2004, catalogues storms dating back to 1888.
NOAA understands and predicts changes in the Earth’s environment, from the depths of the ocean to the surface of the sun, and conserves and manages our coastal and marine resources. See story here.