


By Rosie Manins
Theories of climate change were challenged during an Environment Court appeal hearing for Meridian Energy’s proposed $2 billion Project Hayes wind farm yesterday. As a witness for appellant Roch Sullivan, climate scientist Prof Christopher de Freitas was questioned on his evidence, which had been contested in the evidence of other climate witnesses called in the hearing.
Prof Freitas, of the University of Auckland, said there was no evidence to suggest carbon dioxide was the major driver of climate change. “Climate is not responding to greenhouse gases in the way we thought it might. If increasing carbon dioxide is in fact increasing climate change, its impact is smaller than natural variation. People are being misled by people making money out of this,” Prof de Freitas said.
He said mild warming of the climate was beneficial, especially in a country such as New Zealand, which had a prominent agricultural industry. “One could argue that carbon dioxide is quite beneficial. There may be benefits of wind farming that I may not be aware of, but there is no data to show benefits in terms of mitigating potential dangerous changes in climate by offsetting carbon dioxide,” he said.
Prof de Freitas said the Kyoto Protocol was a “politically and economically motivated instrument to deal with a perceived problem”. “I don’t think anyone will benefit one way or another by adhering to it. It’s not a well-formulated treaty the so-called or claimed environmental benefits, I am not aware of,” he said.
Prof de Freitas was questioned by Meridian Energy lawyer Hugh Rennie QC, about an article published in The New Zealand Herald in 2004, in which Prof de Freitas expressed his thoughts on wind power, the Kyoto Protocol, and climate change.
Prof de Freitas admitted there was debate about climate change, when questioned during cross-examination by Central Otago District Council lawyer Graeme Todd. “The debate centres on causes. There is a possibility climate change could be impacted by human beings, but it is not a significant impact,” he said.
In response to a question by commissioner Alex Sutherland, Prof de Freitas said the jury was out on climate change, and preemptive action could be dangerous. “There’s no basis for alarm. We might be shooting ourselves in the foot if we act on what turns out to be a bubble-less pot,” he said. Read more here.
Climate scientist Prof Christopher de Freitas, of Auckland
By Frank Lansner, civil engineer, biotechnology
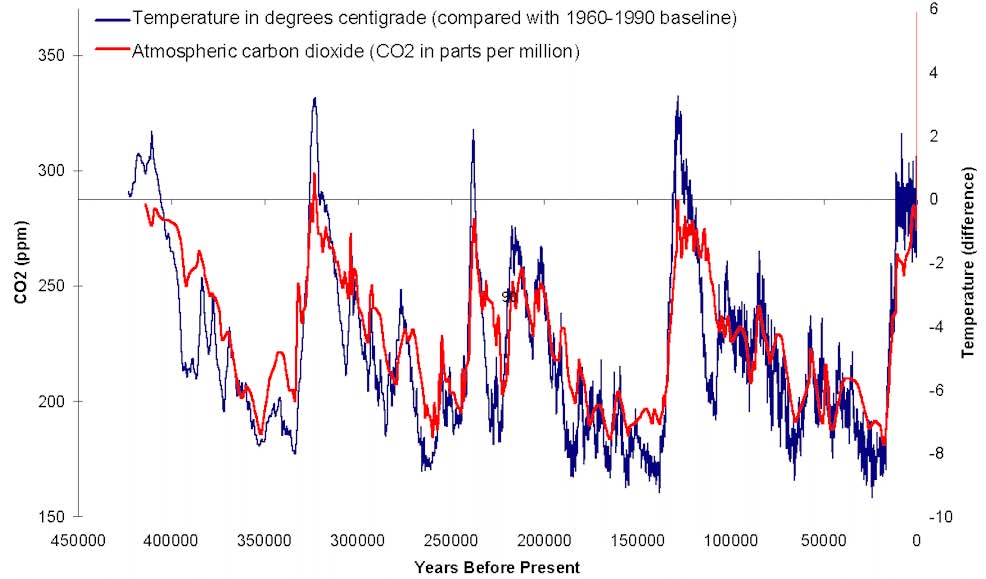
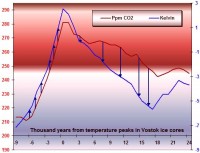
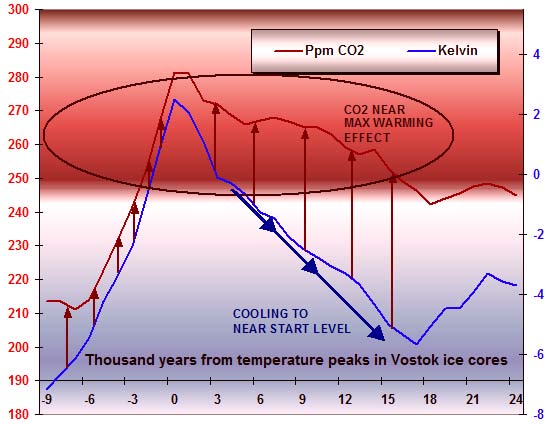
It is general accepted that CO2 is lagging temperature in Antarctic graphs. To dig further into this subject therefore might seem a waste of time. But reality is, that these graphs are still widely used as an argument for the global warming hypothesis. But can the CO2-hypothesis be supported in any way using the data of Antarctic ice cores? At first glance in figure 1, the CO2 lagging temperature would mean that it’s the temperature that controls CO2 and not vice versa.
But this is the climate debate, so massive rescue missions have been launched to save the CO2-hypothesis. So explanation for the unfortunate CO2 data is as follows: First a solar or orbital change induces some minor warming/cooling and then CO2 raises/drops. After this, it’s the CO2 that drives the temperature up/down. Hansen has argued that: The big differences in temperature between ice ages and warm periods is not possible to explain without a CO2 driver.
Very unlike solar theory and all other theories, when it comes to CO2-theory one has to PROVE that it is wrong. So let’s do some digging. The 4-5 major temperature peaks seen on Fig 1. have common properties: First a big rapid temperature increase, and then an almost just as big, but a less rapid temperature fall. To avoid too much noise in data, I summed up all these major temperature peaks into one graph:
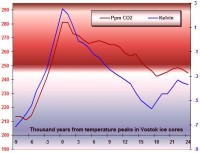
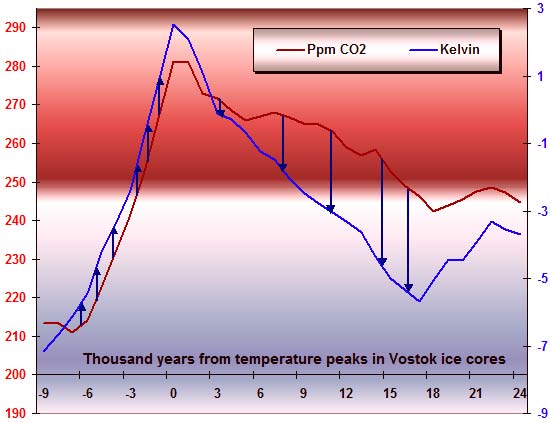
This graph of actual data from all major temperature peaks of the Antarctic vostok data confirms the pattern we saw in fig 1, and now we have a very clear signal as random noise is reduced.The well known Temperature-CO2 relation with temperature as a driver of CO2 is easily shown.
Below is a graph where I aim to illustrate CO2 as the driver of temperature:
Except for the well known fact that temperature changes precede CO2 changes, the supposed CO2-driven raise of temperatures works ok before temperature reaches max peak. No, the real problems for the CO2-rescue hypothesis appears when temperature drops again. During almost the entire temperature fall, CO2 only drops slightly. In fact, CO2 stays in the area of maximum CO2 warming effect. So we have temperatures falling all the way down even though CO2 concentrations in these concentrations where supposed to be a very strong upwards driver of temperature. Read more here.
By Jennifer Marohasy
YESTERDAY, a former chief at NASA, Dr John S. Theon, slammed the computer models used to determine future climate claiming they are not scientific in part because the modellers have “resisted making their work transparent so that it can be replicated independently by other scientists”.
Today, a founder of the International Journal of Forecasting, Journal of Forecasting, International Institute of Forecasters, and International Symposium on Forecasting, and the author of Long-range Forecasting (1978, 1985), the Principles of Forecasting Handbook, and over 70 papers on forecasting, Dr J. Scott Armstrong, tabled a statement declaring that the forecasting process used by the Intergovernmental Panel on Climate Change (IPCC) lacks a scientific basis.
What these two authorities, Drs Theon and Armstrong, are independently and explicitly stating is that the computer models underpinning the work of many scientific institutions concerned with global warming, including Australia’s CSIRO, are fundamentally flawed.
In today’s statement, made with economist Kesten Green, Dr Armstrong provides the following eight reasons as to why the current IPCC computer models lack a scientific basis:
1. No scientific forecasts of the changes in the Earth’s climate.
Currently, the only forecasts are those based on the opinions of some scientists. Computer modeling was used to create scenarios (i.e., stories) to represent the scientists’ opinions about what might happen. The models were not intended as forecasting models (Trenberth 2007) and they have not been validated for that purpose. Since the publication of our paper, no one has provided evidence to refute our claim that there are no scientific forecasts to support global warming.
We conducted an audit of the procedures described in the IPCC report and found that they clearly violated 72 scientific principles of forecasting (Green and Armstrong 2008). (No justification was provided for any of these violations.) For important forecasts, we can see no reason why any principle should be violated. We draw analogies to flying an aircraft or building a bridge or performing heart surgery-given the potential cost of errors, it is not permissible to violate principles.
2. Improper peer review process.
To our knowledge, papers claiming to forecast global warming have not been subject to peer review by experts in scientific forecasting.
3. Complexity and uncertainty of climate render expert opinions invalid for forecasting.
Expert opinions are an inappropriate forecasting method in situations that involve high complexity and high uncertainty. This conclusion is based on over eight decades of research. Armstrong (1978) provided a review of the evidence and this was supported by Tetlock’s (2005) study that involved 82,361 forecasts by 284 experts over two decades.
Jump to #8 Be conservative and avoid the precautionary principle.
One of the primary scientific principles in forecasting is to be conservative in the darkness of uncertainty. This principle also argues for the use of the naive no-change extrapolation. Some have argued for the precautionary principle as a way to be conservative. It is a political, not a scientific principle. As we explain in our essay in Appendix 2, it is actually an anti-scientific principle in that it attempts to make decisions without using rational analyses. Instead, cost/benefit analyses are appropriate given the available evidence which suggests that temperature is just as likely to go up as down. However, these analyses should be supported by scientific forecasts.
The reach of these models is extraordinary, for example, the CSIRO models are currently being used in Australia to determine water allocations for farmers and to justify the need for an Emissions Trading Scheme (ETS) - the most far-reaching of possible economic interventions. Yet, according to Dr Armstrong, these same models violate 72 scientific principles. Read all 8 points here.
By Bob Tisdale
It should easy to attribute the warming to ENSO events. It’s already been done.
The recently released paper by Steig et al (2009) “Warming of the Antarctic ice-sheet surface since the 1957 International Geophysical Year generated a lot of buzz on the climate blogs today.
But I found the post at RealClimate by Michael Mann and Eric Steig, co-authors of the study, the most enlightening. In it they wrote, “Our paper - by itself - does not address whether Antarctica’s recent warming is part of a longer term trend. There is separate evidence from ice cores that Antarctica has been warming for most of the 20th century, but this is complicated by the strong influence of El Nino events in West Antarctica. In our own published work to date (Schneider and Steig, PNAS) we find that the 1940s [edit for clarity: the 1935-1945 decade] were the warmest decade of the 20th century in West Antarctica, due to an exceptionally large warming of the tropical Pacific at that time.” The title of the linked Schneider and Steig, PNAS paper is Ice cores record significant 1940s Antarctic warmth related to tropical climate variability.
Abstract:
“Although the 20th Century warming of global climate is well known, climate change in the high-latitude Southern Hemisphere (SH), especially in the first half of the century, remains poorly documented. We present a composite of water stable isotope data from high-resolution ice cores from the West Antarctic Ice Sheet. This record, representative of West Antarctic surface temperature, shows extreme positive anomalies in the 1936-45 decade that are significant in the context of the background 20th Century warming trend. We interpret these anomalies-previously undocumented in the high-latitude SH - as indicative of strong teleconnections in part driven by the major 1939-42 El Nino. These anomalies are coherent with tropical sea-surface temperature, mean SH air temperature, and North Pacific sea-level pressure, underscoring the sensitivity of West Antarctica’s climate, and potentially its ice sheet, to large-scale changes in the global climate.”
It would seem logical to conclude that the current bout of warming in the Western Antarctic could be attributable to the recent almost three-decade-long bout of ENSO activity that has been dominated by El Nino events.
The following are graphs of Antarctic and Southern Ocean TLT [AHU MSU] created from data available through the KNMI Climate Explorer Website. Keep in mind that the MSU satellite data does not reach the entire Antarctic, which is something I found curious about the use of satellite data for the University of Washington study. (They must be supplementing the sparse surface measurements with it.) In fact, RSS only lists data as far South as 70S. AHU extrapolates, smoothes, estimates, whatever, to provide data for the rest of the Antarctic. Regardless, here are additional graphs of the AHU TLT data for the Antarctic to add to the ones I put up yesterday for those discussing the Antarctic off-topic on the previous thread.
Here are the East and West TLT anomalies from 90S to 60S with linear trends. The trend in the west is flat, and the trend in the east toward cooling:

Larger image here.
Full post (most interesting) here.
By Anthony Watts, Watts Up With That
Yes more anecdotal evidence of a colder winter in the northern hemisphere. This is the second time in 5 years. A USATODAY story says it was “the first time ever in 2004. Even the BBC reported it. There seems to be some confusion on the precendence between news organizations. In the 2004 stories, USATODAY says “first time ever” while BBC says “every 20 to 30 years”. I would tend to believe the Abu Dhabi local newspaper (over the BBC) who now says “second time in recorded history” in their story below. - Anthony
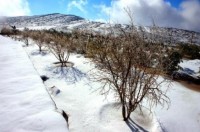
This is the frozen north of the UAE
by Anna Zacharias of The National, in Abu Dhabi
RAS AL KHAIMAH : Snow covered the Jebel Jais area for only the second time in recorded history yesterday. So rare was the event that one lifelong resident said the local dialect had no word for it.
According to the RAK Government, temperatures on Jebel Jais dropped to -3°C on Friday night. On Saturday, the area had reached 1°C. Major Saeed Rashid al Yamahi, a helicopter pilot and the manager of the Air Wing of RAK Police, said the snow covered an area of five kilometres and was 10cm deep.
“The sight up there this morning was totally unbelievable, with the snow-capped mountain and the entire area covered with fresh, dazzling white snow,” Major al Yamahi said. “The snowfall started at 3pm Friday, and heavy snowing began at 8pm and continued till midnight, covering the entire area in a thick blanket of snow. Much of the snow was still there even when we flew back from the mountain this afternoon. It is still freezing cold up there and there are chances that it might snow again tonight.”
Aisha al Hebsy, a woman in her 50s who has lived in the mountains near Jebel Jais all her life, said snowfall in the area was so unheard of the local dialect does not even have a word for it. Hail is known as bared, which literally translates as cold. “Twenty years ago we had lots of hail,” said Ms al Hebsy. “Last night was like this. At four in the morning we came out and the ground was white.”
Jebel Jais was dusted in snow on Dec 28, 2004, the first snowfall in living memory for Ras al Khaimah residents. “I had flown there in 2004 when it snowed, but this time it was much bigger and the snowing lasted longer as well,” said Major al Yamahi.
At the base of the mountains, residents also reported severe hail on Friday night. “We had hail. Last night was very cold, but there can only be snow on Jebel Jais because it’s the tallest,” said Fatima al Ali, 30, a resident of a village beneath the mountains.
See Anthony’s post here.
By Gaia Vince
With his 90th birthday in July, a trip into space scheduled for later in the year and a new book out next month, 2009 promises to be an exciting time for James Lovelock. But the originator of the Gaia theory, which describes Earth as a self-regulating planet, has a stark view of the future of humanity. He tells Gaia Vince we have one last chance to save ourselves - and it has nothing to do with nuclear power
Your work on atmospheric chlorofluorocarbons led eventually to a global CFC ban that saved us from ozone-layer depletion. Do we have time to do a similar thing with carbon emissions to save ourselves from climate change?
Not a hope in hell. Most of the “green” stuff is verging on a gigantic scam. Carbon trading, with its huge government subsidies, is just what finance and industry wanted. It’s not going to do a damn thing about climate change, but it’ll make a lot of money for a lot of people and postpone the moment of reckoning. I am not against renewable energy, but to spoil all the decent countryside in the UK with wind farms is driving me mad. It’s absolutely unnecessary, and it takes 2500 square kilometres to produce a gigawatt - that’s an awful lot of countryside.
What about work to sequester carbon dioxide?
That is a waste of time. It’s a crazy idea - and dangerous. It would take so long and use so much energy that it will not be done.
Do you still advocate nuclear power as a solution to climate change?
It is a way for the UK to solve its energy problems, but it is not a global cure for climate change. It is too late for emissions reduction measures.
So are we doomed?
There is one way we could save ourselves and that is through the massive burial of charcoal. It would mean farmers turning all their agricultural waste - which contains carbon that the plants have spent the summer sequestering - into non-biodegradable charcoal, and burying it in the soil. Then you can start shifting really hefty quantities of carbon out of the system and pull the CO2 down quite fast.
Would it make enough of a difference?
Yes. The biosphere pumps out 550 gigatonnes of carbon yearly; we put in only 30 gigatonnes. Ninety-nine per cent of the carbon that is fixed by plants is released back into the atmosphere within a year or so by consumers like bacteria, nematodes and worms. What we can do is cheat those consumers by getting farmers to burn their crop waste at very low oxygen levels to turn it into charcoal, which the farmer then ploughs into the field. A little CO2 is released but the bulk of it gets converted to carbon. You get a few per cent of biofuel as a by-product of the combustion process, which the farmer can sell. This scheme would need no subsidy: the farmer would make a profit. This is the one thing we can do that will make a difference, but I bet they won’t do it.
Read more of the interview here.
By Jennifer Marohasy, Politics and Environment Blog
WITHIN the scientific community it has generally been accepted that as a continent, Antarctica, has been getting colder – or at least not warming. Those who subscribe to the general consensus that climate change is driven by manmade carbon dioxide emissions, and that the world is generally getting warmer, have claimed this is not inconsistent with their greenhouse gas theory or the United Nation’s Intergovernmental Panel on Climate Change (IPCC) models. They have explained that Antarctica is a general exception to the global trend because of a loss of ozone in the polar stratosphere. When communicating with the general public, however, some high profile scientists, including from the CSIRO, have been so bold as to falsely claim even the Antarctic is warming. Perhaps because they wanted to avoid appearing inconsistent or having to explain such an annoying exception to the generally accepted global warming trend over the last 100 or so years.
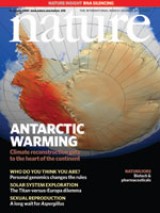
Now the prestigious journal Nature has published an article explaining that the Antarctic has been generally warming and at about the same rate as the rest of the planet. This news made the cover of the latest issue of the journal with a dramatic graphic illustration of the new reconstruction of Antarctic surface temperature trends for 1957–2006.
One of the authors of the new paper, Michael Mann, director of the Earth System Science Center at Pennsylvania State University, has explained that he is pleased that the previous inconvenience of a cooling trend in Antarctica can now be dismissed. Indeed he now has a paper published in the prestigous and peer-reviewed journal Nature claiming as much. But this does not necessarily make it true.
Dr Mann is famous for managing to falsely recreate past temperatures so they accord with the popular global warming consensus. Indeed Dr Mann is responsible for the infamous hockey-stick graph that suggested the medieval warm period did not exist.
In this new study Dr Mann and others have combined incomplete data from both satellites and weather stations with some complicated statistics to generate a model of climate for the continent for the period 1957-2006.
Bill Kininmonth, formerly of the Australian Bureau of Meteorology, was interviewed on Australian national radio as part of a segment on the new findings. Mr Kininmonth explained that there has been no reduction in the cycle of Antarctic sea ice and that he was general sceptical that the west Antarctic ice sheet was likely to melt - a claim made earlier in the segment by Dr Barry Brook from Adelaide University.
In apparent contravention of ABC Broadcasting principles, the comment from Mr Kininmonth has been expunged from the transcript and the podcast.
It seems computer models can remove evidence of cooling and editors can remove comment from climate change sceptics - but of course the truth does not cease to exist because it is ignored. Read more from Jennifer and see reference links and formal complaint lodged by Art Raiche to the ABC about the removal of Dr. Kininmonth’s comments here.
By Roger Pielke Sr. Climate Science
Bruce Hall has an excellent presentation of temperature records in the United States on his weblog ”Updating Statewide Monthly Temperature Extremes”.
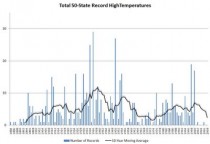
Among his valuable comments, he writes “The U.S. analysis showed that the late 1990s were indeed hot and had a greater than normal expected level of statewide monthly records. What it also showed, however, was that the 1930s had a much higher frequency of those records. Finally, it showed a sharp tailing off of such extremes beginning with the new century. I have completed the review of the high temperature extremes through 2008 and there were no additional statewide month high temperature records. An analysis of the 2005 - 2008 data for minimum temperature records will be started shortly.
One of premises of global warming theory is that: These new peaks do not in themselves prove global warming, say scientists - but global warming makes them much more likely. “As you get a warming trend in temperatures, which is what we are observing, the risk of exceeding extreme temperatures increases dramatically,” said Peter Stott of the Met Office’s Hadley Centre for Climate Prediction and Research. [quoted in The Independent; 19 July 2006]
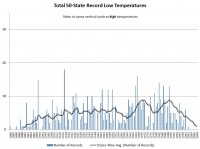
These charts summarize the annual number of new monthly, statewide records. There is a limit of 600 maximum and 600 minimum records for this data set… 50 states times 12 months. New records are set and replace old records if the temperature ties or exceeds the old record ... a slight bias toward newer records.
These graphs are most extraordinary for the 2001 - 08 period because, according to the information available from NOAA, there has been almost a total absence of either new maximum or new minimum statewide records. It is as if 2001-08 was as “ordinary” as possible. There was no evidence of extreme warming or cooling based on temperature extremes.
I was so surprised by the outcome that I double-checked the data and reports. I found only two previously excluded minimum temperature records; Maine, January 1999, -55°F and Utah, January 2002, -62°F. These replaced records of several decades ago. One maximum record for Oklahoma in May 2000 had been reported as 114°F in Weatherford and for some reason was now showing up as 112°F in Altus. I did not change my information because the NOAA daily records did not verify the change in the monthly records… not sure why.
The number of reporting sites vary from month to month in the database for some reason, but the number hovers around 190,000. That should certainly cover the geographic area reasonably well. As far as I can tell, the historical data for these records have not been adjusted upward or downward as has some analytical data used to show an upward trend increase recently… the records are the records.
See larger image here.
See larger image here.
It looks as if the 1st decade of the 21st century… at least for the U.S.... could be viewed as the most climatically boring rather than among the warmest… anti-climactic? So I ask again: where’s the global warming? The only heating seems to be among the politics of climate… and that may be cooling down.