By Willis Eschenbach on Climate Audit
A new method is proposed for determining if a group of datasets contain a signal in common. The method, which I call Correlation Distribution Analysis (CDA), is shown to be able to detect common signals down to a signal:noise ratio of 1:10. In addition, the method reveals how much of the common signal is contained by each proxy. I applied the method to the Mann et al. 2008 (hereinafter M2008) proxies. I analysed all (N=95) of the M008 proxies which contain data from 1001 to 1980. These contain a clear hockeystick shaped signal. CDA shows that the hockeystick shape is entirely due to Tiljander proxies plus high-altitude southwestern US “stripbark” pines (bristlecones, foxtails, etc). When these are removed, the hockeystick shape disappears entirely.
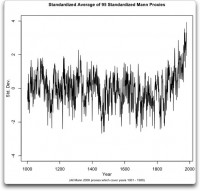
Here is the plot with all the proxies:

Hmmm … that looks suspiciously like the original MBH98 results, the infamous “HockeyStick”. Once we remove the four Tiljander proxies, it is obvious that the whole edifice is built on a few closely related high-elevation, moisture limited pine trees located in the southwestern US. These tree rings make up no less than 19 of the 21 remaining top proxies after Ti ljander is removed. In other words, the bristlecones are back and with a vengeance.
I guess the deal is that no self-respecting paleoclimate reconstruction would be complete without the bristlecone pines (PILO), which make up no less than 12 of the remaining top 21 (after Tiljander is removed). In addition we have the bristlecone’s cousins, the limber pine (PIFL) and the foxtail pine (PIBA). All of these records contain are from similar ecosystems and contain similar signals. The overwhelming majority were collected by Graybill. His work has been called into serious question by LInah Abadneh’s thesis, wherein she was unable to replicate his results.
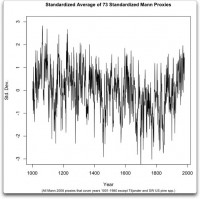
If I ran the zoo, I’d throw out all of those high altitude pine tree ring records. They are known to have problems, their use has been recommended against, and the principle investigator’s work is under a cloud. I would omit them. After removing the Tiljander and the southwestern US pines, the average looks like this:

Read full post and see Willis’s methods for the analysis here.
Read more papers on why Mann and his hockey stick must hold the Guinness Book of World Record listing for most often debunked scientist and theory.


