


Dr Roy Spencer
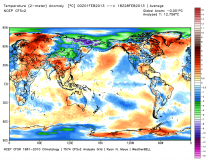
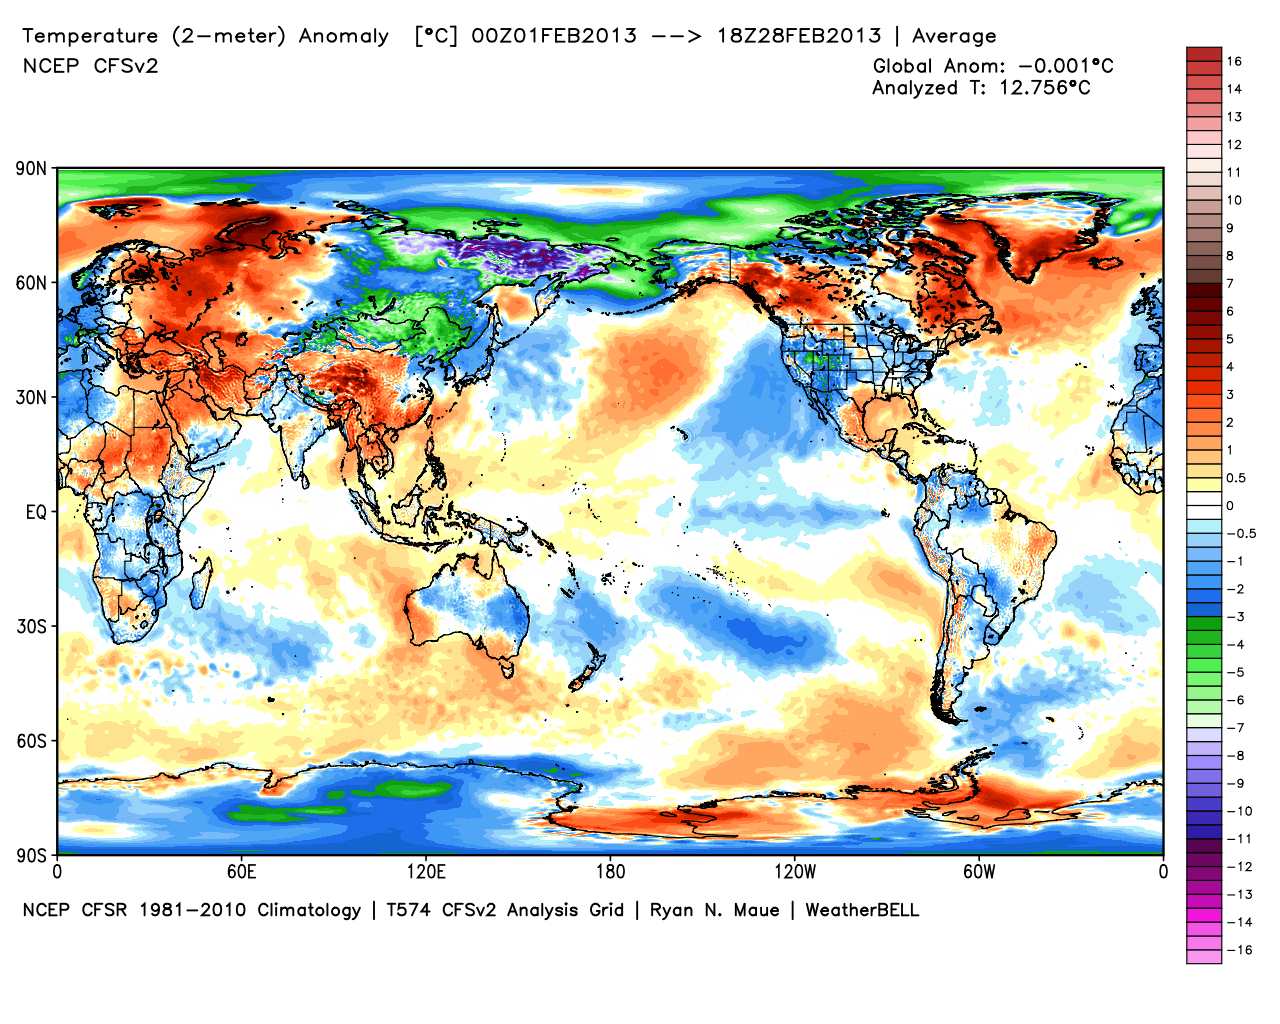
Ryan Maue at weatherbell.com has this CFS v2 global February analysis.
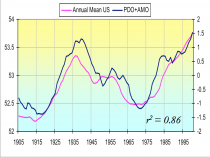
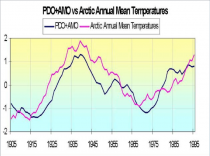
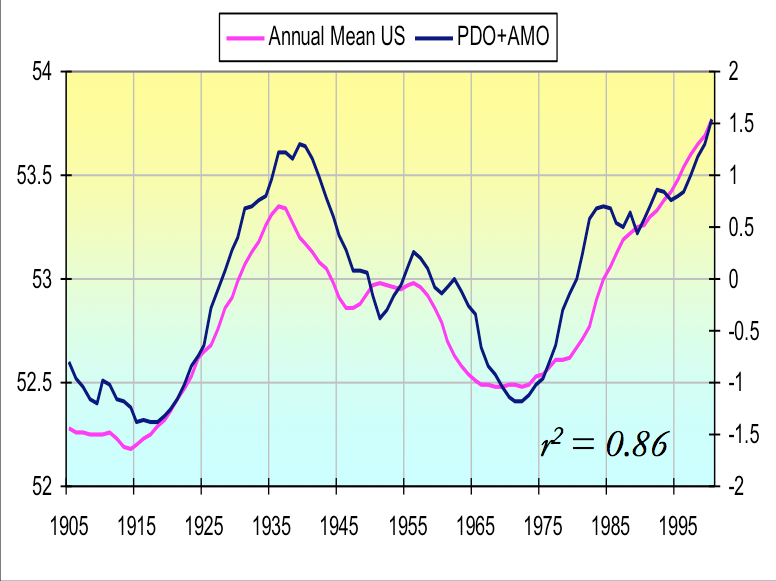
I thought you would enjoy Dr Roy Spencer's analysis of the February data and the links to ENSO. The climate world admits to the ENSO influence, but dares not talk about the multidecdal PDO and AMO because that would raise the possibility of someone realizing global temperatures change naturally due to variations of these cycles. it they blame the lack of warming since 1998 on the PDO, then they can't not admit the warming from 1979 to 1998 could be largely doe to the +PDO and dominiance of El Ninis (3 to 1 over La Ninas). It is very clear in the US and arctic temperatures.
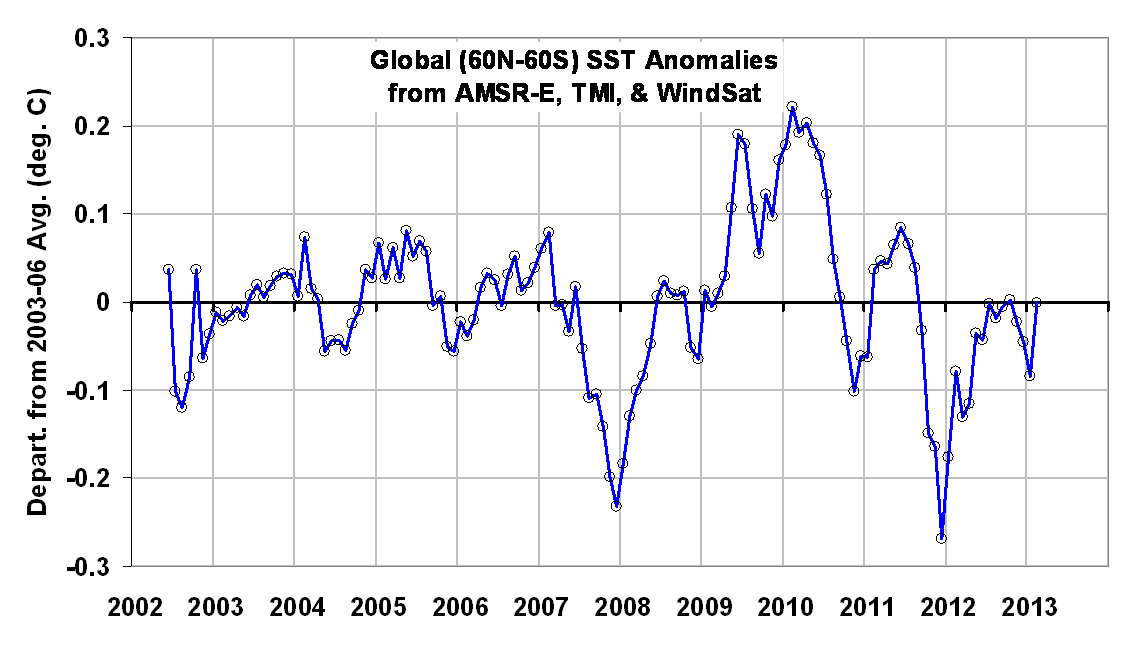
Global Microwave Sea Surface Temperature Update for Feb. 2013: -0.01 deg. C
March 4th, 2013
The global average sea surface temperature (SST) update for Feb. 2013 is -0.01 deg. C, relative to the 2003-2006 average: (click for large version)

The anomalies are computed relative to only 2003-2006 because those years were relatively free of El Nino and La Nina activity, which if included would cause temperature anomaly artifacts in other years. Thus, these anomalies cannot be directly compared to, say, the Reynolds anomalies which extend back to the early 1980s. Nevertheless, they should be useful for monitoring signs of ocean surface warming, which appears to have stalled since at least the early 2000’s. (For those who also track our lower tropospheric temperature ["LT"] anomalies, these SST anomalies average about 0.19 deg. C cooler over 2003 to 2006.)
The SST retrievals come from Remote Sensing Systems (RSS), and are based upon passive microwave observations of the ocean surface from AMSR-E on NASA’s Aqua satellite, the TRMM satellite Microwave Imager (TMI), and WindSat. While TMI has operated continuously through the time period (but only over the tropics and subtropics), AMSR-E stopped nominal operation in October 2011, after which Remote Sensing Systems patched in SST data from WindSat. The various satellite datasets have been carefully intercalibrated by RSS.
Despite the relatively short period of record, I consider this dataset to be the most accurate depiction of SST variability over the last 10+ years due to these instruments’ relative insensitivity to contamination by clouds and aerosols at 6.9 GHz and 10.7 GHz.
------------
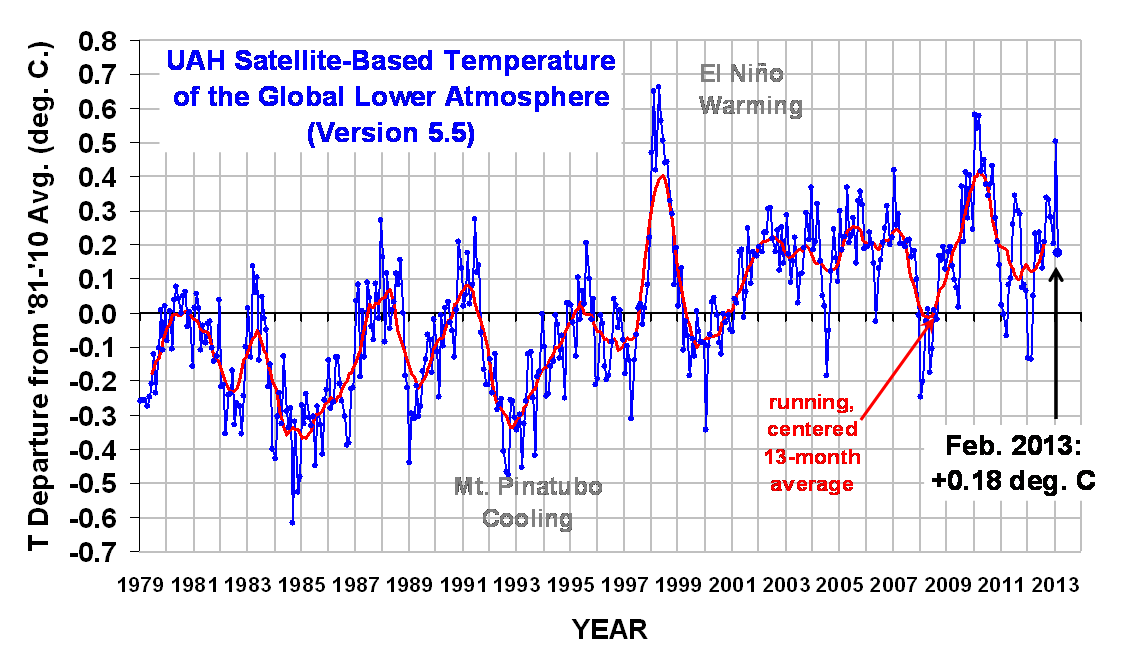
Our Version 5.5 global average lower tropospheric temperature (LT) anomaly for February, 2013 is +0.18 deg. C, a large decrease from January’s +0.50 deg. C. (click for large version):
These large month-to-month changes are not that uncommon, especially during Southern Hemisphere summer, and are due to small variations (several percent) in the convective heat flux from the ocean surface to the atmosphere.
The global, hemispheric, and tropical LT anomalies from the 30-year (1981-2010) average for the last 14 months are:
YR MON GLOBAL NH SH TROPICS
2012 1 -0.134 -0.065 -0.203 -0.256
2012 2 -0.135 +0.018 -0.289 -0.320
2012 3 +0.051 +0.119 -0.017 -0.238
2012 4 +0.232 +0.351 +0.114 -0.242
2012 5 +0.179 +0.337 +0.021 -0.098
2012 6 +0.235 +0.370 +0.101 -0.019
2012 7 +0.130 +0.256 +0.003 +0.142
2012 8 +0.208 +0.214 +0.202 +0.062
2012 9 +0.339 +0.350 +0.327 +0.153
2012 10 +0.333 +0.306 +0.361 +0.109
2012 11 +0.282 +0.299 +0.265 +0.172
2012 12 +0.206 +0.148 +0.264 +0.138
2013 1 +0.504 +0.555 +0.453 +0.371
2013 2 +0.176 +0.369 -0.016 +0.169
-------------
Tropical SSTs Since 1998: Latest Climate Models Warm 3x Too fast
February 21st, 2013
Following up on yesterday’s post, I’d like to address the more general question of tropical sea surface temperatures since 1998. Why haven’t they warmed? Of course, much has been made by some people about the fact that even global average temperatures have not warmed significantly since the 1997/98 El Nino event.
Using the Tropical Rain Measuring Mission (TRMM) Microwave Imager (TMI) SSTs available from Remote Sensing Systems (all 15 GB worth), here I will statistically adjust tropical SSTs for El Nino and La Nina activity, and see how the resulting trend since 1998 compares to the latest crop of IPCC CMIP5 model runs. We will restrict the analysis to 20N to 20S latitude band, which is the usual latitudinal definition of “tropical”.
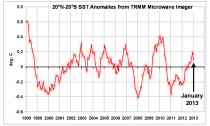
The resulting TRMM TMI SST anomalies since January 1998 through last month look like this:
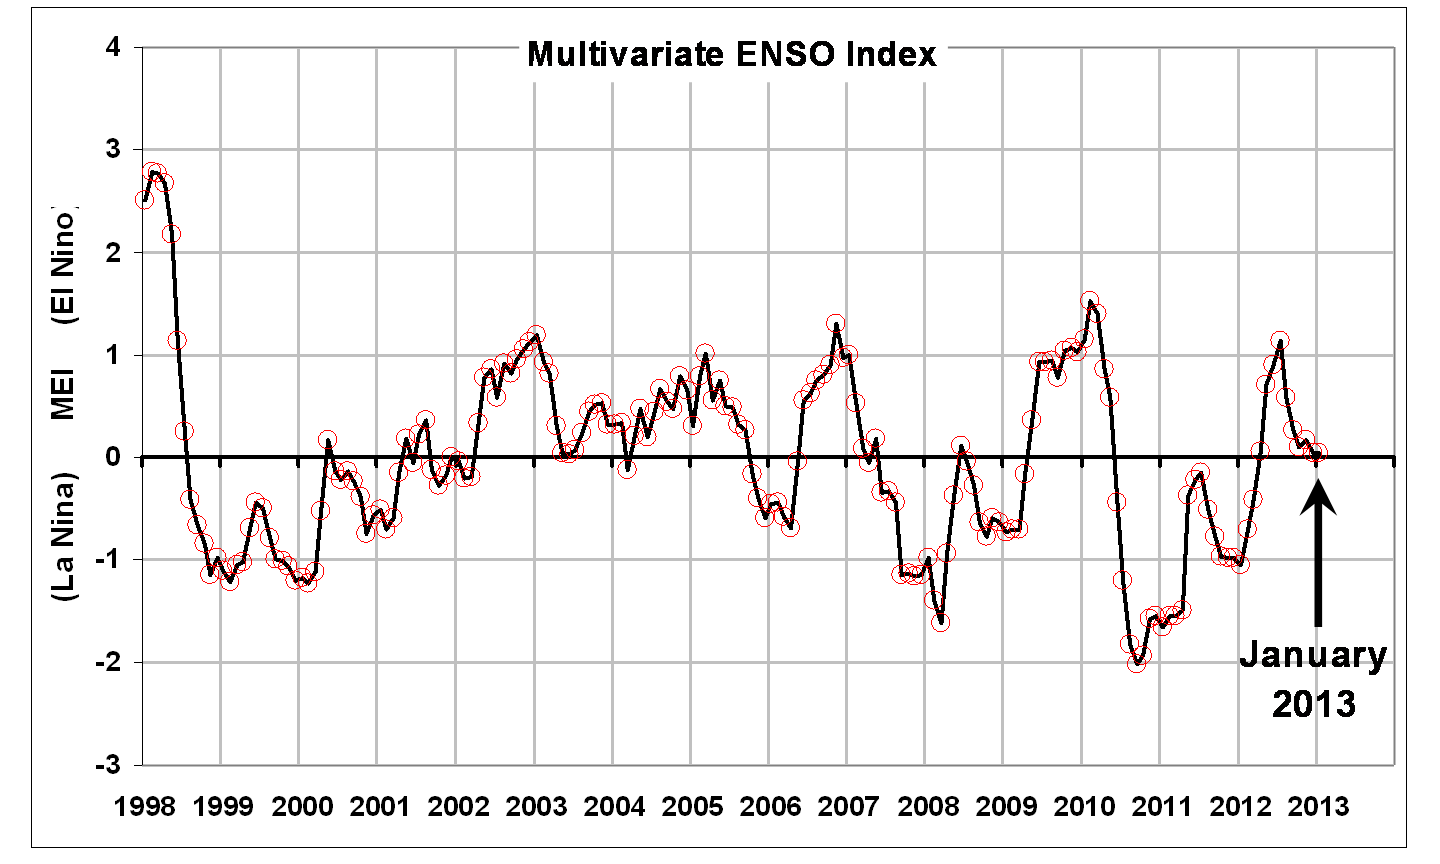
The up and down variations are clearly related to El Nino and La Nina activity, as evidenced by this plot of the Multivariate ENSO Index (MEI):
We can then plot these SST and MEI data against each other…
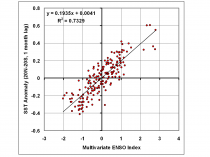
...and use this statistical relationship to estimate SST from MEI, and then subtract that from the original SST data to get an estimate (however crude) of how the SSTs might have behaved without the presence of El Nino and La Nina activity (the blue line):
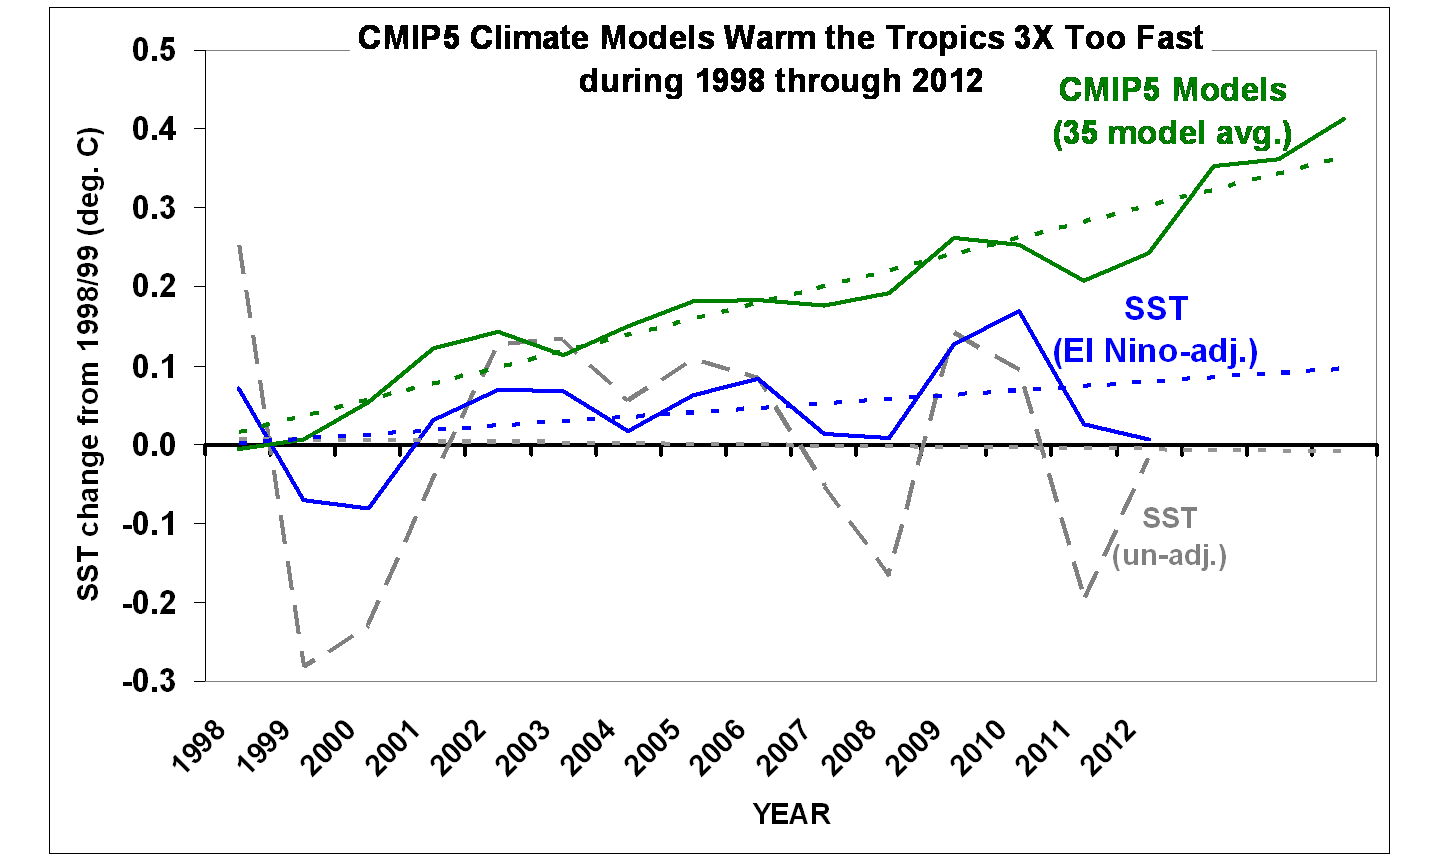
Note that I have now averaged the monthly data to yearly, and this last plot also shows an average of 35 CMIP5 climate models SSTs during 1998-2012 for the same (tropical) latitude band, courtesy of John Christy and the KNMI climate explorer website. Also note I have plotted all three time series as departures from their respective 1998/99 2-year average.
The decadal linear temperature trends are:
un-adj. SST: = -0.010 C/decade
MEI-adj. SST: +0.056 C/decade
CMIP5 SST: +0.172 C/decade
So, even after adjusting for El Nino and La Nina activity, the last 15 years in the tropics have seen (adjusted) warming at only 1/3 the rate which the CMIP5 models create when they are forced with anthropogenic greenhouse gases.
Now, one might object that you really can’t adjust SSTs by subtracting out an ENSO component. OK, then, don’t adjust them. Since the observed SST warming without adjustments is essentially zero, then the models warm infinitely faster than the observations. There.
Why Have the Models Warmed Too Fast?
My personal opinion is that the models have cloud feedbacks (and maybe other feedbacks) wrong, and that the real climate system is simply not as sensitive to increasing CO2 as the modelers have programmed the models to be.
But there are other possibilities, all theoretical:
1) Ocean mixing: a recent increase in ocean vertical mixing would cause the surface to warm more slowly than expected, and the cold, deep ocean to very slowly warm. But it is debatable whether the ARGO float deep-ocean temperature data are sufficiently accurate to monitor deep ocean warming to the levels we are talking about (hundredths of a degree).
2) Increasing atmospheric aerosols: This has been the modelers’ traditional favorite fudge factor to make climate models keep from warming at an unrealistic rate...a manmade aerosol cooling effect “must be” cancelling out the manmade CO2 warming effect. Possible? I suppose. But blaming a LACK of warming on humans seems a little bizarre. The simpler explanation is feedbacks: the climate system simply doesn’t care that much if we put aerosols *OR* CO2 in the atmosphere.
3) Increasing CO2 doesn’t cause a radiative warming influence (radiative forcing) of the surface and lower atmosphere.
I’m only including that last one because, in science, just about anything is possible. But my current opinion is that the science on radiative forcing by increasing CO2 is pretty sound. The big uncertainty is how the system responds (feedbacks).