


By Steve McIntyre, Climate Audit
Did Jones et al 1990 “fabricate” its quality control claims? This hard-hitting question is asked by Doug Keenan. He cites the following claims from Jones et al 1990 and Wang et al: “(1) The stations were selected on the basis of station history: we chose those with few, if any, changes in instrumentation, location or observation times. [Jones et al.] and (2) They were chosen based on station histories: selected stations have relatively few, if any, changes in instrumentation, location, or observation times….” [Wang et al.]
Keenan observed that those statements are vital for the papers. For many years, no one knew what stations were used in Jones et al 1990. Only after recent FOI actions in the UK publicized here at CA did a list of the stations used in Jones et al 1990 become available in March 2007, after years of obstruction. Since then, Keenan has corresponded recently with both Jones and Wang, seeking a valid explanation of the above claims. His conclusion:
The essential point here is that the quoted statements from Jones et al. and Wang et al. cannot be true and could not be in error by accident. The statements are fabricated. Keenan refers to earlier discussion of the China sites at climateaudit, noting that questions about these claims were raised here (for example, here here and here . Since then, we’ve also looked at adjustments in the USHCN, GHCN and GISS networks, observing that adjustments for station history are often very substantial, in many cases exceeding the total estimated AGW effect of the last century. So adjustment and homogeneity are not small and irrelevant issues for temperature histories, but are fundamental representations.
Read full blog entry and comments here.
Dr Vincent Gray, June 2007
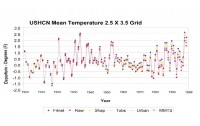
Reliable global, regional and local temperature records show that temperatures variability is cyclic, with a period of about 60 years. The temperature does not display a distinguishable “trend”. The most reliable records show peak temperatures around 1940 and 2005 and low temperatures around 1910 and 1970. These records are incompatible with a belief that there is a distinguishable upwards “trend’ caused by greenhouse gas emissions.
See full story here.
World Climate Report
File this one under “we been telling you this for years.” The headline of the University of Washington press release reads “The woes of Kilimanjaro: Don’t blame global warming.” The press release was prepared to announce an article in an upcoming issue of American Scientist magazine (linked to by the press release), by Phil Mote (University of Washington research scientist and State Climatologist of Washington) and Georg Kaser (glaciologist at the University of Insbruck, Austria)
The press release begins: The “snows” of Africa’s Mount Kilimanjaro inspired the title of an iconic American short story, but now its dwindling icecap is being cited as proof for human-induced global warming. However, two researchers writing in the July-August edition of American Scientist magazine say global warming has nothing to do with the decline of Kilimanjaro’s ice, and using the mountain in northern Tanzania as a “poster child” for climate change is simply inaccurate.
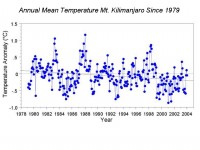
Now we have been writing this very same things for years. We started way back in March 2002, when, in our Virtual Climate Report series (not currently available on-line), we debunked the Kilimanjaro-is-melting-because-of-anthropogenic-global-warming idea as an “urban legend.” But no matter how often that we point out that the hard evidence and scientific literature do not support blaming anthropogenic global warming on the declining snows of Kilimanjaro, it never seems to get through the true believers. Evidence the four page spread in Al Gore’s Inconvenient Truth dedicated to pictures of the diminishing ice fields of the mountain, including a picture of Gore’s glacier guru Dr. Lonnie Thompson standing next to the “pitiful last remnants of one of its [Kilimanjaro’s] great glaciers.” See full report here.
Note: here is the plot of temperatures over the last 29 years at Mt. Kilimanjaro. Temperatures have cooled about 0.3C during that time.
Steve McIntyre, Climate Audit
If you are not a climate scientist (or a realclimate reader), you would almost certainly believe, from your own experience, that cities are warmer than the surrounding countryside - the “urban heat island”. From that, it’s easy to conclude that as cities become bigger and as towns become cities and villages become towns, that there is a widespread impact on urban records from changes in landscape, which have to be considered before you can back out what portion is due to increased GHG.
One of the main IPCC creeds is that the urban heat island effect has a negligible impact on large-scale averages such as CRU or GISS. The obvious way of proving this would seem to be taking measurements on an urban transect and showing that there is no urban heat island. Of course, Jones and his associates can’t do that because such transects always show a substantial urban heat island. So they have to resort to indirect methods to provide evidence of “things unseen”, such as Jones et al 1990, which we’ve discussed in the past.
The newest entry in the theological literature is Parker (2004, 2006), who, once again, does not show the absence of an urban heat island by direct measurements, but purports to show the absence of an effect on large-scale averages by showing that the temperature trends on calm days is comparable to that on windy days. My first reaction to this, and I’m sure that others had the same reaction was: well, so what? Why would anyone interpret that as evidence one way or the other on UHI?
Read more here.
Sherwood, Keith and Craig Idso, CO2 Science
In a recent interview broadcast on National Public Radio’s Morning Edition program, NASA Administrator Michael Griffin was asked if he was concerned about global warming. His response - “I am not sure that it is fair to say that it is a problem we must wrestle with” - prompted a prominent NASA scientist, James Hansen, to tell ABC News that Griffin’s remark was “an incredibly arrogant and ignorant statement,” and that it indicated “a complete ignorance of understanding the implications of climate change.” Equally upset was Princeton University’s Michael Oppenheimer, who said that he was “shocked” by the Administrator’s statement and that he felt that he “ought to resign.”
As a public service to help people better evaluate Hansen’s characterization of Griffin, plus Oppenheimer’s call for Griffin to resign, we are devoting this week’s entire issue of CO2 Science to a comprehensive evaluation of Hansen’s 26 April 2007 testimony to the Select Committee of Energy Independence and Global Warming of the United States House of Representatives, which Hansen entitled “Dangerous Human-Made Interference with Climate.” Before any more calls are made for Griffin’s resignation, our critique of Hansen’s testimony, linked below, should be carefully studied. It is very possible that Oppenheimer’s invitation for Griffin to resign might more appropriately be extended to someone else.
Note story can be found in this section below or on CO2 Science here.
U.S. statistics:
During 1999--2003, a total of 3,442 deaths resulting from exposure to extreme heat or hyperthermia were reported (annual mean: 688).
During 1999--2002, a total of 4,607 death certificates (annual mean: 1536) in the United States had extreme cold or hypothermia to the underlying cause of death.
However, as an independent observer, I will say that though deaths directly from heat or cold are not a major threat to the U.S. population for the few deaths that occur from extreme temperatures, there would probably be a net reduction of overall extreme temperature deaths if the U.S. average temperatures increased somewhat.
What is not shown in these statistics is the very large number of deaths due to respiratory infections that occur primarily during cold weather periods. That factor is why, if our climate is warming, we will be healthier as a nation with a higher average annual temperature… shorter, milder winters. See Hall of Record Blogspot.
World Climate Report, June 5, 2007
The greenhouse crowd had a field day following the active North Atlantic hurricane season of 2005, and they continue to do their best blaming any unusual tropical storm activity on global warming. Katrina remains the poster child for the link between warmer conditions and hurricanes. In the Gore film, Al explains how simple it is – warmer water will generate more storms and storms that are more powerful (and then run the Katrina footage – it seems to work every time). However, the North Atlantic hurricane season of 2006 was somewhat of a dud, so the blame machine is more than ready to go in 2007. You may have heard that tropical storm Andrea formed weeks before the 2007 official hurricane season (June 1 – November 30) got underway, and now with tropical storm Barry, we have two storms early on, and of course, global warming is to blame.
Perhaps not. The 2007 IPCC Climate Change 2007: The Physical Science Basis is now out, and in their Summary for Policymakers we find “...Multi-decadal variability and the quality of the tropical cyclone records prior to routine satellite observations in about 1970 complicate the detection of long-term trends in tropical cyclone activity. There is no clear trend in the annual numbers of tropical cyclones.” So despite the alarmist hype, the IPCC continues to insist that there is no trend upward in the number of tropical cyclones.
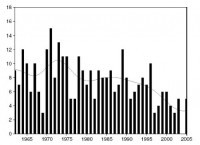
A recent issue of the International Journal of Climatology contains an article providing more evidence in support of this stance. A plot of the number of tropical cyclones impacting Hainan Island shows a highly statistically significant decrease over the period of historical records. In commenting on the figure below, Wu et al. note “A statistically significant decreasing trend at a rate ?0.9 per decade (equivalent to 13% reduction per decade) is obvious in the time series.” Furthermore, they write “Before 1978, the number of impacting TCs was greater than nine. After 1978, however, there were only 2 years (1989, 1996) when the impacting TCs were more than nine. There were only 4 years in the period 1962–2005, in which TCs made no impact on the land on the Hainan Island–and these all occurred after 1978.” They obviously missed the memo from the greenhouse crusade about how hurricanes, typhoons, and tropical cyclones are increasing – time for another showing of the Gore film! Read full story here.
By Sherwood and Craig Idso, Center for the Study of Carbon Dioxide and Global Change
A critique of the 26 April 2007 testimony of James E. Hansen made to the Select Committee of Energy Independence and Global Warming of the United States House of Representatives entitled “Dangerous Human-Made Interference with Climate”.
After a careful study of the claims made by James Hansen in his testimony of 26 April 2007 to the Select Committee of Energy Independence and Global Warming of the US House of Representatives, we find that much of what he contends is contradicted by real-world observations. Although Hansen speaks of a sea level rise this century measured in meters, due to “the likely demise of the West Antarctic ice sheet,” the most recent and comprehensive review of potential sea level rise due to contributions arising from the wastage of both the Antarctic and Greenland ice sheets suggests a century-long rise of only 35 millimeters, based on the results of 14 satellite-derived estimates of imbalances of the polar ice sheets that have been obtained since 1998. In addition, whereas Hansen claims that the rate of sea level rise is accelerating, century-scale data sets indicate that the mean rate-of-rise of the global ocean has either not accelerated at all over the latter part of the 20th century or has actually slowed.
Another of Hansen’s claims that is at odds with reality is that atmospheric greenhouse gas concentrations are “skyrocketing,” for several studies of methane (which has historically provided a climate forcing equivalent to approximately half that provided by CO2) have demonstrated that its atmospheric concentration actually stabilized several years ago and has ceased to rise further.
Hansen also foresees a warming-induced “extermination of a large fraction of plant and animal species,” with many at high latitudes and altitudes being “pushed off the planet.” However, as demonstrated by the scientific studies we cite, warming - especially when accompanied by an increase in the atmosphere’s CO2 concentration - typically results in an expansion of the ranges of terrestrial plants and animals, leading to increases in biodiversity almost everywhere on the planet. Likewise, where Hansen sees nothing but “destruction of coral reefs and other ocean life” in response to a predicted CO2-induced acidification of the world’s oceans, real-world observations suggest just the opposite.
Note: In the very thorough paper, the Idso’s carefully look at each of the opinions made by Hansen in his testimony versus scientific reality.