


Social Issues Research Centre
A new mantra is beginning to occupy pride of place in debates on all environmental issues, whether they be to do with food safety, genetic engineering or global warming - the precautionary principle. Originating in 1960s Germany as Vorsorgeprinzip (literally foresight planning) it has been increasingly seized upon by green activists and other romantics since the 1970s as an unanswerable credo - when considering technological innovation, exercise caution with regard to its potential consequences.
In itself the precautionary principle sounds harmless enough. We all have the right to be protected against unscrupulous applications of late twentieth century scientific advances - especially those which threaten our environment and our lives. But the principle goes much further than seeking to protect us from known or suspected risks. It argues that we should also refrain from developments which have no demonstrable risks, or which have risks that are so small that they are outweighed, empirically, by the potential benefits that would result. In the most recent application of the doctrine it is proposed that innovation should be prevented even when there is just a perception of a risk among some unspecified people.
We have seen the impact of this thinking in recent debates on genetically modified crops, ‘novel’ foods, ‘greenhouse’ gasses and even the mythical ability of cellular phones to fry the brains of those who use them. At every stage the opponents of technological progress argue that just because there is no evidence of harm, that does not mean that something is not harmful. We have to ‘prove’ that it is not harmful before we embrace it.
This form of pre-scientific thinking presents a serious obstacle to rational discussion. The absence of an effect can never be proved , in the way that I cannot prove that there are no fairies at the bottom of my garden. All I can say are two things: firstly, sustained observation over the past 20 years has revealed no evidence of their presence, and secondly the existence of fairies, in my garden or elsewhere, is very unlikely on a priori grounds. This is how science works - precisely in accord with the principles of Karl Popper that hypotheses cannot be proved, only refuted.
The precautionary principle is, however, a very useful one for consumer activists precisely because it prevents scientific debate. The burden of evidence and proof is taken away from those who make unjustified and often whimsical claims and placed on the scientific community which, because it proceeds logically and rationally, is often powerless to respond. This is what makes the principle so dangerous. It generates a quasi-religious bigotry which history should have has taught us to fear. Its inherent irrationality renders it unsustainable.
Everything in life involves a risk of some kind. Throughout our evolution and development we have sought to minimise and manage risk, but not to eliminate it. Even if this were possible, it would undoubtedly be undesirable. A culture in which people do not take chances, where any form of progress or development is abandoned ‘just to be on the safe side’, is one with a very limited future. The very nature and structure of all human societies are what they are because individuals, in co-operation with each other, have taken their chances - seeking the rewards of well-judged risk-taking to the enervating constraints of safe options. Had the precautionary principle been applied the Pilgrim Fathers would never have set sail for America in their fragile ships. Life-saving advances in medicine would have been halted when the first patient died on the operating table.
The champions of the precautionary principle, of course, will argue that what we choose to regard as modern progress is nothing more than the manifestation of greed and exploitation. But in their vehement critique of the interests and power of ‘big business’ - forces which they see as inexorably apocalyptic - they cling to a naive and romantic vision of agrarian idylls which have never existed and can never exist. In doing so, they offer no sustainable solutions to the potential problems which are recognised by us all. Their rhetoric, however, is sufficiently seductive to win over those whose anxieties about food, health and the environment have been generated and nurtured by those very same people who now purport to offer a solution. Create an unfounded scare, provoke fears, sell them the precautionary principle - a style of marketing of which ‘big business’ would be proud.
In reality, the precautionary principle presents a serious hazard to our health which extends way beyond the generation of unnecessary neuroses. The biggest correlate of our health and well being is our standard of living, as measured in conventional economic and physical terms. People in technologically advanced societies suffer fewer diseases and live longer than those in less developed nations. The biggest killer in the world is not genetically modified soya, pesticide residues or even tobacco. It is something which is given the code Z59.5 in the International Classification of Disease Handbook and accounts for more deaths world-wide than any other single factor. It is defined as ‘Extreme Poverty’.
The narrow philosophy which surrounds the precautionary principle is fundamentally conservative in both political and literal senses. It offers little prospect for those who are disadvantaged in our societies - those who have far more real concerns in their daily lives than to be worried about whether the beef that they cannot afford has a remote chance of being contaminated with BSE. By seeking to dismantle the industrialised-based processes which generate wealth and health, the eco-activists can only make their plight much more profound.
In one sense, though, the precautionary principle might have some utility. If we apply the precautionary principle to itself - ask what are the possible dangers of using this principle - we would be forced to abandon it very quickly. See post here.
By Alan Moran

Under pressure from local election defeats, the French Government has abandoned its plans to introduce a carbon tax, having suddenly discovered it would, “damage the competitiveness of French companies”.
Kevin Rudd once described reducing carbon dioxide emissions as the great moral dilemma of our time. Like Barack Obama, he has now switched off this agenda and turned to health.
This reflects a global declining interest in the matter perhaps as a result of scientific advisers having been discredited following demonstrable evidence that they had, at the very least, over-egged the cake.
The battle against measures to reduce carbon emissions is however hardly over. The issue has fuelled too many careers in politics, science, public service and the media for its beneficiaries to quietly move on. Recent public relations barrages by the CSIRO and gatherings in Canberra and Melbourne of the many beneficiaries of the scare is being repeated around the world.
And the policy momentum is on-going. We are still incurring wasteful expenditures, including on intrinsically uneconomic renewables, the will-of-the-wisp of carbon capture and storage, and draconian energy saving regulations.
But any new proposals for suppressing carbon emissions will simply be the wrapping paper for new taxes. And France’s experience shows that even this is a risky policy approach.
So what was it all about? What was on the alarmists’ minds behind the spurious rhetoric about a re-emergence of long-suppressed diseases, increasing numbers of cyclones, disappearance of Arctic ice and the extinction of local colonies of butterflies? It was certainly not the cost to humanity of a warmer climate. Even pessimistic assumptions used by the official estimates put the costs as low. And those estimates were invariably carefully buried in hundreds of pages of diagrams, tables and trivia.
The IPCC assessment was for little economic change with temperature rises of 1 to 3C, adding, “(By 2050) global mean losses could be 1 to 5% of GDP for 4C of warming.” This was in the context of GDP that is estimated to more than double. For Australia, the costs of doing nothing by the end of the century were estimated by Treasury at 5 per cent of GDP. Significant though this may be, it is dwarfed by the increase in GDP - sixfold - that is estimated to take place under business-as-usual.
Treasury also estimated the costs of taking action to reduce our per capita emissions to 12 per cent of those presently prevailing would be just a few percentage points of national income. This rested on Pollyanna modelling assumptions about new technologies that would burst upon us and compensate for the forced total restructuring of the nation’s industrial structure and the progressive elimination of coal, our greatest export industry.
The centralised control that climate restraint would entail led people like Lord Monckton and Czech President Vaclav Klaus to see the whole climate debate as a replay of long standing conflicts between those who want to direct our lives and those who are especially attached to individual liberty.
There are, indeed, many public officials who stood to gain from stoking the global warming flames. Global warming was also an outlet for people concerned about the inequities and injustices of the modern world. Many of these aspire to a simpler pre-industrial arcadia, though their main spokesmen, the Gore’s, Pachauri’s, and Prince Charles’s would want to exempt themselves from the privations involved.
Even though the alarmists claim their opponents received massive financial support, they could never identify this. That’s because there was none - support for the sceptical view would have amounted to less than one per cent of that accruing to the alarmists. This lack of support for skeptics may be due to individual liberty being nowadays so readily taken for granted. The enlargement of the state both within the economy and within our lives has not been seen, by-and-large, as excessively intrusive.
Nonetheless, as well as begetting a new class of drones, the greenhouse scare has created a serious diversion of resources. This includes all the entrepreneurs who have seen better opportunities in lobbying for assistance for everything from pink batts to carbon storage schemes.
Potential greenhouse taxes also mean additional energy costs and risks to energy intensive developments that lie at the heart of Australia’s comparative advantage. The threat of such taxes makes it impossible for any private sector business in Australia to contemplate building a new coal fired power station. Yet, if we are to avoid economic stagnation we will need additional conventional power supplies. This is because we are unlikely to see the need for these becoming redundant. Forecasts of improved efficiency of wind, new sources of power and vast new economies denting demand for electricity will not eventuate. Commercially developed new gas fired generation remains possible in a political environment where a carbon tax is threatened. However this is more expensive than coal power and undermines Australia’s cost competitiveness.
The corollary is that new investment in electricity generation will require government indemnification guarantees against the possibility of a carbon tax. This in turn means government control over new capital expenditures and takes us back to the past of politically managed investments gradually unravelling the vast productivity increases that privatisation has brought.
Alan Moran is the director deregulation at the Institute of Public Affairs.
SEPP
A recent News Feature in 2010 Nature [pp 284-287] discusses what it calls “The Real Holes in Climate Science.” The problem is that it misses the “real holes” and therefore echoes the IPCC mantra that warming in the last thirty years is anthropogenic.
The author, Quirin Schiermeier, bases his views on the ‘RealClimate’ blog and some of its authors. Needless to say, he has not talked to any climate skeptics. To give a better view of his bias: In his opinion, the leaked CRU emails do not challenge the “scientific consensus” on climate change but only show “rude behavior and verbal faux pas.” The holes he identifies are the conventional ones:
* Regional climate prediction - although this does not stop alarmists from attempting to publish such predictions that promote catastrophic futures
* Precipitation - everyone would agree that this is a “real hole” in climate science—difficult to fill until we understand better the formation of clouds
* Aerosols - even the IPCC admits there are huge errors when assessing particles such as sulfates, black carbon, sea salt and dust, all of which have different optical properties and can also produce indirect effects on clouds.
* The tree ring controversy: QS brings back the hockeystick and blithely ignores the fact that it has been thoroughly discredited. He still insists that the 20th century is unusual in terms of temperature rise. He asserts that the emails that mention “hide the decline” and “Mike’s Nature trick” merely refer to the divergence issue between tree ring data and instrument data. He says that “many scientists are tired of the criticisms” - perhaps because they have run out of excuses.
He finally quotes Susan Solomon, the former co-chair of the IPCC 2007 Science Team, as claiming that “multiple lines of evidence support AGW” - without listing any.
QS tries to dispose of what he calls “Enduring climate myths [by skeptics]” - which all happen to be facts:
* Climate models cannot provide useful information about the real world
* Global warming stopped ten years ago
* Temperatures were higher in pre-industrial times
* Temperature records taken in the lower atmosphere indicate that the globe is not warming
* A few degrees of warming are not a big deal
* Measured increases in temperature reflect the growth of cities around weather stations rather than global warming
* But the real holes in climate science are these facts, never mentioned by QS or by the IPCC:
* The absence of ‘fingerprint’ data that would indicate a substantial warming from CO2
* The absence of data for positive feedbacks that might amplify the effects of greenhouse gases like CO2
* The empirical evidence that shows the control of climate fluctuations on a decadal scale by solar activity by way of cosmic rays.
By Pascal Fletcher, Reuters
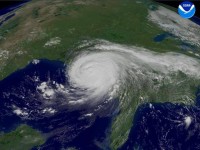
The 2010 Atlantic hurricane season will produce an above-average eight hurricanes, four of them major, posing a heightened threat to the U.S. coastline, the Colorado State University hurricane forecasting team predicted on Wednesday.In its second forecast in four months for the 2010 season, the leading storm research team founded by hurricane forecast pioneer William Gray said the six-month season beginning on June 1 would likely see 15 named tropical storms.
The team forecast a 69 percent chance of at least one major hurricane making landfall on the U.S. coastline in 2010, compared with a long-term average probability of 52 percent. Major hurricanes pack powerful sustained winds of at least 111 miles per hour (178 km per hour).
For the Gulf Coast, from the Florida Panhandle west to Brownsville, Texas, including the Gulf of Mexico oil patch, the probability of a major hurricane making landfall was seen at 44 percent versus a long-term average of 30 percent, the Colorado State University team said.
“While patterns may change before the start of the hurricane season, we believe current conditions warrant concern for an above-average season,” Gray said in a statement. An average Atlantic season has about 10 tropical storms, of which six become hurricanes.
The Colorado State University team also predicted a 58 percent chance of a major hurricane tracking into the Caribbean, where Haiti is vulnerable after a devastating January 12 earthquake that left more than a million people homeless.
‘EXTREME’ SEASON FEARED
The earlier forecast in December by Gray’s team had already predicted an “above-average” season producing 11 to 16 tropical storms, including six to eight hurricanes. It had said three to five of next year’s storms would become “major” hurricanes of Category 3 or higher on the Saffir-Simpson intensity scale.
Another forecaster, AccuWeather.com, last month also forecast a potentially “extreme” hurricane season this year, with “above-normal threats” to the U.S. coastline.
AccuWeather said five hurricanes, two or three of them major, were expected to strike the U.S. coast, forming out of an expected 16 to 18 tropical storms, almost all of them in the western Atlantic or Gulf of Mexico.
The 2009 season ended November 30 had only nine storms, including three hurricanes, and was the quietest since 1997 due in part to El Nino, the eastern Pacific warm water phenomenon that tends to suppress Atlantic hurricanes.
But Phil Klotzbach, lead forecaster with the Colorado State team—whose research is followed closely by energy and commodity markets—said El Nino was expected to dissipate fully by the start of this year’s storm season.
“The dissipating El Nino, along with the expected anomalously warm Atlantic ocean sea surface temperatures, will lead to favorable dynamic and thermodynamic conditions for hurricane formation and intensification,” said Klotzbach.
The Colorado State University team has repeatedly cautioned that extended-range forecasts for hurricane activity are imprecise and can often miss the mark. The university team originally expected the 2009 season to produce 14 tropical cyclones, of which seven would become hurricanes. But the season, which ended on November 30 and was the quietest since 1997, had only nine storms, including three hurricanes. See story here.
See Bill Gray and Phil Klotzbach’s detailed discussion here.
By E.M. Smith
We saw the France Monthly Anomalies chart in the Europe Atlantic Coastal series. It shows France dropping steadily in temperature anomalies until about 1990. Then we get a sudden “Hockey Stick” to get us back up to Zero. A nice “head fake” and we can rapidly “Hide The Decline”.
France Monthly Anomalies and Running Total by Segment
You can click here to get a nice large version to see just how nicely the “average of monthly anomalies” running total is steadily dropping. And how clearly the divergence is at The Pivot when it lifts off from the trend.
So we look at that trend line, and we’re clearly headed down. It drops about 1.5 C over the length of the graph to 1990. The “range” drops about 2 C on the annual average anomaly line. Then the 1990 pivot happens and we’re back to zero already. That “hockey blade” has one steep rise to it. Close to 1 C per decade. That “ain’t normal”.
So, how was it done? We had snow on the Mediterranean coast. It’s been darned cold. Yet, France got “sticked” What could you possibly do to “Hide The Decline” when it’s written on the front page of the news in pictures of snow? Perhaps find someplace without snow?
Well, I like to start from “first principles” when confronted with a “surprise”. For climate and weather data, that’s temperatures. So I went back to look AT the TEMPERATURES. In the final analysis, that’s all we really have. Everything else is some kind of imagining based on those temperatures. A derived product of some kind. So what do the temperatures look like? We saw them before in aggregate but now I’d like to see them in a bit more detail.
This graph is similar to the the anomaly “hair graph” in that it has information for each month kept separate. We are just averaging all the temperature data for each month for all of France. Then plotting the monthly average of temperatures.
Please note: I did not say “average temperature”. I said “average of temperatures”. An average temperature is meaningless. (Take two pots of water, one at 50 C the other at 0 C and mix them. What is the resultant temperature? You do not know. It depends on how big each pot is and if the 0 C water is frozen or not). So we don’t get an “average temperature”, we instead get an idea about the structure of the data. Are some of those pots big pots of ice? Or are some of them beach sand?
France Monthly Average of Temperatures
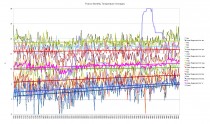
Very colorful, no?
OK, I’ve put trend lines on some of the months. What do you notice?
First off, summers are NOT getting hotter. It’s dead flat over the whole history of France. But we do note that at the very end we have a rise in those green July and August lines (and even the light blue June line takes a Hockey Blade climb away from the trend line. Yet Mar, April, September, November have no such “lift” at the end. We’re taking some “summer heat” but only when the sun is shining.
At the bottom of the chart we have winters steadily being warmer. Over a long period of time. We’ve been gradually moving thermometers to places that are less cold in winter (but until recently, not much warmer in summer). But at the end, while we don’t have a “Hockey Blade” rise to the tops, we do have a clipping of any excursions below zero. Those blue tops are about the same as they were in 1871 or 1910, but the bottoms have been raised. We’re not taking “cold excursions” anymore.
Finally, the magenta line in the middle is the average of all those monthly temperatures. So in it we see how all those temperatures interact. We can also see that both the low clips of the winter months and the “lift” to the sunny months comes as thermometers drop from about 1987 to 1995.
Seems pretty clear to me. More thermometers at places that get warm in the sun (think tarmac) and have the snow cleared away in the winter. Airports anyone? Read much more here.
Hockey Schtick
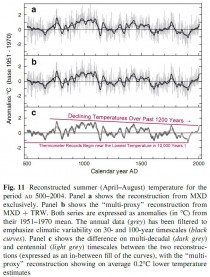
Two tenets of AGW theory are 1) tree-ring paleoclimate data reconstructs an accurate portrayal of the climate of the past [except when scientists don’t like what it shows, call it a “divergence problem” and hide the decline] and 2) the poles should show the most warming of all. Unfortunately, the Scots pines in the Tornetrask area (above, enlarged here) within the Arctic Circle in northern Sweden around 68.5N have not received the memo on AGW as of 2004. A 2008 paper shows that the updated Tornetrask data “show a trend of -0.3C over the last 1,500 years”. The trees also say that the end of the Little Ice Age in the late 1800’s was the lowest temperature over the past 1,500 years, and according to ice core data was the lowest temperature in the past 10,000 years. By pure chance, this exceptionally cold period is also the same time the global temperature record (HADCRU) begins in 1850. Thus, the global thermometer record showing increasing temperatures in the 20th century mostly represents the recovery from the lowest temperatures of the past 10,000 years during the Little Ice Age. The Tornetrask pines insist that the rate of temperature increase and temperature anomaly of the 20th century was not unprecedented and was less than that of the Medieval Warming Period (~850-1200AD).
From the abstract:
The new data show generally higher temperature estimates than previous reconstructions based on Tornetrask tree-ring data. The late-twentieth century, however, is not exceptionally warm in the new record: On decadal-to-centennial timescales, periods around ad 750, 1000, 1400, and 1750 were equally warm, or warmer. The 200-year long warm period centered on ad 1000 was significantly warmer than the late-twentieth century (p < 0.05) and is supported by other local and regional paleoclimate data. The new tree-ring evidence from Torneträsk suggests that this "Medieval Warm Period" in northern Fennoscandia was much warmer than previously recognized.
As the infamous Phil Jones recently admitted in an interview: "Of course, if the MWP was shown to be global in extent and as warm or warmer than today, then obviously the late 20th Century warmth would not be unprecedented. On the other hand, if the MWP was global, but was less warm than today, then the current warmth would be unprecedented". OK Phil, here ya go: Medieval Warming Period was Global.
See more by Steve McIntyre here. See the full post here.
Scientific Alliance Newsletter
Scientists should, by nature, be sceptics. They should take nothing for granted and form judgements only on the basis of evidence. And they should be prepared to change their minds if different evidence conflicts with their opinion. But there is a big difference between what is desirable and what happens in practice. The debate continues to rage about what does and does not constitute true scientific scepticism, and the main focus of this debate is, hardly surprisingly, climate change.
According to an opinion article by three authors from the University of Edinburgh published in Nature (Vol 464; page 673), ‘sceptics and deniers of climate change should not be confused’. The trouble is, the distinction is not an absolute, objective one; one man’s rational scepticism is another’s rampant denialism. The authors of this particular article (Jeremy Kemp, Richard Milne and Dave S Reay) nail their colours firmly to the mast in their opening paragraph:
‘Climate-change denial could have disastrous consequences, if it delays global action to cut carbon emissions. Denialism is gaining popularity because people have difficulty differentiating deniers’ twisted arguments from the legitimate concerns of genuine sceptics. We must stop deniers presenting themselves as the rightful regulators of scientific debate.’
What, we might ask, constitutes a ‘twisted argument’? In the authors’ words: ‘Deniers use strategies that invoke conspiracies, quote fake experts, denigrate genuine experts, deploy evidence selectively and create impossible expectations of what research can deliver. . . By contrast, scepticism starts with an open mind, weighs evidence objectively and demands convincing evidence before accepting any claim.’
Put like that, who could disagree? But implicit in this article is the understanding that the evidence is compelling enough to attempt to rejig the global economy and remove the human influence on natural systems as far as possible. Scepticism is acceptable as long as it relates to details, but anything which might lead to doubt about the central tenets of belief is beyond the pale and must be suppressed.
In this highly polarised debate, both extremes have been guilty of the sins of supposed deniers. Conspiracy theories? On one hand, the ‘denial industry’ is said to be funded by Big Oil, with no credence given to the reality that there are plenty of independent (and unpaid) thinkers who question the orthodoxy, on the other, the ‘climate change industry’ is the purview of a clique of politically motivated activist scientists, despite the evidence that large numbers of perfectly rational academic scientists also subscribe to the broad picture of AGW. Deploy evidence selectively? Is pointing out the poor correlation between temperature of the upper troposphere with the predictions of the GHG hypothesis worse than seizing on any evidence of warming and using it to repeat the message that only humans can be to blame?
Far healthier would be a proper dialogue between those with legitimate, evidence-based criticisms of mainstream science (and, despite the attempts at marginalisation, there are plenty of them) and those who are persuaded by the evidence for AGW but who are prepared to be open-minded. Unfortunately, the media headlines have tended to be captured by those who shout the loudest and this can only increase the polarisation.
In the meantime, opinions such as that in the Nature article seem to be part of a counter-offensive by the global warming lobby. Having been unable to steamroller critics into submission, they now recognise that they have to engage to some degree. But this has largely (and unsurprisingly) taken the form of acknowledgement that minor mistakes have been made coupled with renewed assertions that the enhanced greenhouse effect has been shown beyond reasonable doubt to be causing an upward trend in average global temperature. The article by Kemp et al seems to be an attempt at appearing sweetly reasonable - by distinguishing between sceptics (good) and ‘deniers’ (bad) - while actually implicitly branding anyone outside the mainstream as a ‘denier’. Perhaps we should be surprised that Nature should print something like this, at least without a counter-balancing viewpoint, but unfortunately the leading journals seem also to classify all who have rational doubts about AGW as ‘deniers’.
The warfare seems set to continue, but there seems to be no sign of public opinion firming in support of the IPCC view on climate change. Without that, it is going to be almost impossible for democratic governments to do anything very meaningful to cut carbon dioxide emissions apart from investing in nuclear power and R&D projects on a range of power-generation and energy-saving options. But that will not stop them continuing to levy new ‘green’ taxes while they can.
James Lovelock and democracy
Ever controversial, even at 90, James Lovelock is of the opinion, according to a headline in the Guardian, that ‘humans are too stupid to prevent climate change’. He also gave a radio interview in which, despite the bleak message, he sounded remarkably cheerful. Lovelock appears to have stepped back a little from his catastrophic vision of ‘global heating’ leaving a few million humans living in a few favoured places such as Antarctica and the British Isles, and now is in favour of adaptation.
But, in a rather worry insight into the mind of a leading Green, he also believes that democracy is an obstacle to decisive action, arguing that it should be ‘put on hold’ for a while, as in wartime. Representative democracy is indeed flawed, and dictatorships undoubtedly can be more decisive, but history is strewn with the unappealing debris of autocratic regimes which have put a cause ahead of the welfare of their citizens. The more radical of the environmentalists need to be discouraged from following their repressive tendencies.
By Richard Black, BBC
The Gulf Stream does not appear to be slowing down, say US scientists who have used satellites to monitor tell-tale changes in the height of the sea. Confirming work by other scientists using different methodologies, they found dramatic short-term variability but no longer-term trend.
A slow-down - dramatised in the movie The Day After Tomorrow - is projected by some models of climate change. The research is published in the journal Geophysical Research Letters.
The stream is a key process in the climate of western Europe, bringing heat northwards from the tropics and keeping countries such as the UK 4-6C warmer than they would otherwise be. It forms part of a larger movement of water, the Atlantic Meridional Overturning Circulation, which is itself one component of the global thermohaline system of currents.
Between 2002 and 2009, the team says, there was no trend discernible - just a lot of variability on short timescales. The satellite record going back to 1993 did suggest a small increase in flow, although the researchers cannot be sure it is significant. “The changes we’re seeing in overturning strength are probably part of a natural cycle,” said Josh Willis from Nasa’s Jet Propulsion Laboratory (JPL) in California. “The slight increase in overturning since 1993 coincides with a decades-long natural pattern of Atlantic heating and cooling.”
The first observations suggesting the circulation was slowing down emerged in 2005, in research from the UK’s National Oceanography Centre (NOC). Using an array of detectors across the Atlantic and comparing its readings against historical records, scientists suggested the volume of cold water returning southwards could have fallen by as much as 30% in half a century - a significant decline.
The surface water sinks in the Arctic and flows back southwards at the bottom of the ocean, driving the circulation. However, later observations by the same team showed that the strength of the flow varied hugely on short timescales - from one season to the next, or even shorter. But they have not found any clear trend since 2004.
The NOC team now has a chain of instruments in place across the Atlantic, making measurements continuously. “In four-and-a-half years of measurement, we have found there is a lot of variability, and we’re working to explain it,” said NOC’s Harry Bryden. The quantities of water involved are huge, varying between four million and 35 million tonnes of water per second.
The array is part of the UK-funded Rapid project, which aims to refine understanding of potentially large climate change impacts that could happen in short periods. Professor Bryden’s team calculates that their system is good enough to detect a long-term change in flow of about 20% - but it has not happened yet. He believes the JPL approach - using satellite altimeters, instruments that can measure sea height precisely, and the Argo array of autonomous floating probes - could potentially add useful data to that coming from long-term on-site monitoring arrays. But, he points out: “The method concentrates only on the upper [northward] flow - it doesn’t give you much information on the returning flow southward.”
Fantasy and reality
Driven by Hollywood, a popular image of a Gulf Stream slowdown shows a sudden catastrophic event driving snowstorms across the temperate lands of western Europe and eastern North America. That has always been fantasy - as, said Josh Willis, is the idea that a slow-down would trigger another ice age. “But the Atlantic overturning circulation is still an important player in today’s climate,” he added.

“Some have suggested cyclic changes in the overturning may be warming and cooling the whole North Atlantic over the course of several decades and affecting rainfall patterns across the US and Africa, and even the number of hurricanes in the Atlantic.”