


By Hans Schreuder
Chairperson and members of the NI Climate Change Committee, greetings and thank you for inviting me to present my oral evidence today, which comprises mostly a number of short pertinent quotations from eminent scientists.
Allow me though to first set the scene by going back one century to an equally momentous event. “The astonishing discovery that atoms are mainly empty was made in 1909 at Manchester University by the indefatigable Ernest Rutherford. He had great courage as a scientist and was prepared to fly in the face of convention. Forced to explain the atom’s mysterious emptiness, scientists had to jettison everything they had believed to be true for the previous two centuries. It was a seismic moment in the history of science.” End quote.
Fast forwarding now to 2009, Australian scientist Dr Jennifer Marohasy states the following: “Our understanding of the natural world does not progress through the straight forward accumulation of facts because most scientists tend to gravitate to the established popular consensus also known as the established paradigm. Thomas Kuhn describes the development of scientific paradigms as comprising three stages: prescience, normal science and revolutionary science when there is a crisis in the current consensus. When it comes to the science of climate change, we are probably already in the revolution state.” End quote.
From Dr Nasif Nahle, USA: “Throughout the last decade, supporters of the idea of an anthropogenic global warming or the impact of an anthropogenic “greenhouse” effect on climate have been insisting on an erroneous concept of the emission of energy from the atmosphere towards the surface. The global warming - greenhouse effect assumption states that half of the energy absorbed by atmospheric gases, especially carbon dioxide, is reemitted back towards the surface, heating it up. This solitary assumption is fallacious when considered in light of real natural processes.” End quote.
That is, the longstanding paradigm says that because of trace gases like CO2, the atmosphere heats the earth. But this isn’t true. From Meteorologist William DiPuccio, USA: “For any given area on the ocean’s surface, the upper 2.6m of water has the same heat capacity as the entire atmosphere above it! Considering the enormous depth and global surface area of the ocean (70.5%), it is apparent that its heat capacity is greater than the atmosphere by many orders of magnitude.” “The heat deficit shows that from 2003-2008 there was no positive radiative imbalance caused by anthropogenic forcing, despite increasing levels of CO2. Indeed, the radiative imbalance was negative, meaning the earth was losing slightly more energy than it absorbed.” End quote.
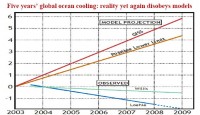
See larger image here.
Please understand what this means. There is no evidence of a recent global warming trend per se, despite increasing amounts of CO2. Read more here.
Energy Information Administration
U.S. carbon dioxide emissions from fossil fuels decreased by 2.8 percent in 2008, from 5,967 million metric tons of carbon dioxide (MMTCO2) in 2007 to 5,802 MMTCO2 in 2008, according to preliminary estimates released today by the Energy Information Administration (EIA). This is the largest annual decline in energy-related carbon dioxide emissions since EIA began annual reporting on greenhouse gas emissions.
The economy, as measured by Gross Domestic Product (GDP), grew by 1.1 percent in 2008, notwithstanding the economic downturn at the end of the year.
Energy demand declined by 2.2 percent indicating that energy intensity (energy use per unit of GDP) fell by 3.3 percent in 2008. Carbon dioxide intensity
(carbon dioxide emission per unit of GDP) fell by about 3.8 percent.
Factors that influenced the emissions decrease included record-high oil prices and a decline in economic activity in the second half of the year. Oil-related emissions declined by 6 percent, accounting for the bulk of overall reduction in energy-related carbon dioxide emissions. Total U.S. energy-related carbon dioxide emissions have grown by 15.9 percent since 1990. Energy-related carbon dioxide emissions account for over 80 percent of U.S. greenhouse gas emissions.
Preliminary fossil fuel consumption data for 2008 indicate that:
* Transportation-related emissions, which account for about a third of total energy-related carbon dioxide emissions, decreased by 5.2 percent in 2008. Since 1990 the next largest yearly decline in the transportation sector was 1.3 percent in 1991. Only one other year in the 1990 to 2008 time period experienced a decline - 1.2 percent in 2001.
* Carbon dioxide emissions from the residential sector declined by 1.1 percent in 2008. Heating degree-days rose by 5.6 percent, but the summer was also
cooler than 2007 and cooling degree-days fell by 8.7 percent, which helped to offset the increase in heating-related energy demand.
* The commercial sector, which includes all non-residential, non-industrial buildings, such as stores, office buildings, schools, hospitals, and government buildings, experienced an emissions increase of 0.5 percent in 2008.
* Industrial carbon dioxide emissions fell by 3.2 percent in 2008, continuing a trend of falling industrial sector emissions since 2004. In addition to
manufacturing, the industrial sector includes agriculture, construction and mining.
* When electric power sector emissions are considered as a whole rather than being allocated to the end-use sectors that consume electricity, they are the largest single source of U.S. carbon dioxide emissions, representing about 41 percent of total emissions. In 2008, emissions from the electric power
sector decreased by about 50 MMTCO2 or 2.1 percent, while power generation decreased by 1.0 percent. The decrease in the emissions intensity of generation of 1.1 percent in 2008 reflected, among other factors, an increase in wind-powered generation.
From 1990 to 2008, the carbon dioxide intensity of the economy fell by 29.3 percent or 1.9 percent per year. From 1990 to 2007 (the latest year of data for all greenhouse gases), carbon dioxide intensity had fallen by 26.4 percent and emissions of total greenhouse gases per dollar of GDP had fallen by 28.0 percent.
EIA will continue to refine its estimates of 2008 carbon dioxide emissions as more complete energy data become available. A full inventory of all U.S. greenhouse gas emissions in 2008 to be issued in late 2009 will include updated energy data and provide a further analysis of trends. The preliminary estimates are on EIA’s web site.
By Doug L. Hoffman, The Resilient Earth
News has come that the famed ocean conveyor belt, subject of countless TV documentaries and science lessons, is not as simple as scientists believed. The 50 year old model of global ocean circulation that predicts a deep Atlantic counter current below the Gulf Stream has been called into question by an armada of drifting subsurface sensors. As shocking as this news is to oceanographers it is even worse for climate modelers - it means that all the current climate prediction models are significantly wrong.
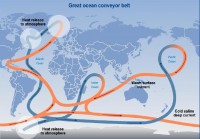
It is known by many names: the meridional overturning current (MOC), the thermohaline circulation (THC), and, popularly, the great ocean conveyor belt. It has been the subject of study by oceanographers for half a century and is known to be a fundamentally important part of earthly climate regulation. It is the primary mechanism for transferring heat from the tropics to higher latitudes, the proximate reason that the occasional palm tree grows on the south coast of England. Until now, scientists thought they had a pretty good handle on how the current flows, the mechanisms that drive the circulation and affect climate world wide.
A new report by Amy Bower of Wood’s Hole and Susan Lozier of Duke University et al., to be published in a forthcoming issue of Nature, has rocked the climate community’s complacency. A bevy of subsurface RAFOS floats, drifting 2200 - 4900 feet (700 - 1500 m) deep, have shown several fundamental assumptions about the structure of the current to be wrong. RAFOS floats (SOFAR spelled backward) are floating instruments designed to move with the water and track the water’s movements. It seems that 75% of the RAFOS floats escaped the Deep Western Boundary Current (DWBC) and drifted into open ocean. Only 8% of the RAFOS floats followed the DWBC conveyor belt current, according to the Nature report.
This confirms suspicions that that first began surfacing in the 1990’s, that things were not quit as neat and simple as oceanographers had thought. Earlier observations had led to the widely held view that the DWBC is the dominant pathway for the export of cold Labrador Sea Water (LSW) from its formation site in the northern North Atlantic towards the Equator. The new findings indicate that instead of the single, orderly current flow previously envisioned that the conveyor belt is actually comprised of many slower, more variable and possibly wandering eddies in the interior ocean. Quoting from the report:
Here we show that most of the recently ventilated LSW entering the subtropics follows interior, not DWBC, pathways. The interior pathways are revealed by trajectories of subsurface RAFOS floats released during the period 2003 - 2005 that recorded once-daily temperature, pressure and acoustically determined position for two years, and by model-simulated ‘e-floats’ released in the subpolar DWBC. The evidence points to a few specific locations around the Grand Banks where LSW is most often injected into the interior. These results have implications for deep ocean ventilation and suggest that the interior subtropical gyre should not be ignored when considering the Atlantic meridional overturning circulation.
Triggered by a bunch of drifting ocean monitoring instruments, this new revelation represents a major paradigm shift in ocean circulation theory. Even more dramatic is the impact on current ocean circulation models, major components of the general circulation models (GCM) used to predict climate change. To understand how global climate changes in response to natural and human generated changes, it is essential to determine how quickly and by what pathways climate change signals are transported throughout the global ocean. Ocean currents not only redistribute surface warmth, the oceans themselves are a vast reservoir for heat and carbon dioxide, affecting both short term and long term climate change.
“Everybody always thought this deep flow operated like a conveyor belt, but what we are saying is that concept doesn’t hold anymore,” said Duke oceanographer Susan Lozier. “So it’s going to be more difficult to measure these climate change signals in the deep ocean.”
This has been a particularly disquieting week for the climate change establishment, with new discoveries regarding the importance of aerosols’ impact on sea surface temperatures (SST) and cloud formation, and the halving of predicted sea-level increases due to ice sheet melting coupled with predictions of significant change in Earth’s gravity field and rotational axis if Antarctica even partially melts. Add the news regarding the THC and one has to ask, how many revelations of erroneous assumptions are necessary before climate modelers admit that their computer programs are incapable of accurately predicting future climate change?
Climate skeptics are sometimes accused of selectively interpreting scientific data in order to bolster their case against anthropogenic global warming (AGW). The term used is “cherry picking.” When a theory makes certain predictions it is totally acceptable, even obligatory, to investigate those predictions. When a theory is based on certain fundamental assumptions regarding underlying science it is perfectly logical to question that theory when its underlying assumptions are shown to be in error. This is not cherry picking, it is how science works. It may discomfort those who complacently believe in the “consensus view” of AGW, but that is of no importance to science. Read more here. H/T Climate Depot.
Heartland Institute
An international conference calling attention to widespread dissent to the asserted “consensus” on the causes, consequences, and proper responses to climate change.
The Third International Conference on Climate Change will be held in Washington, DC on June 2, 2009 at the Washington Court Hotel, 525 New Jersey Avenue NW. It will call attention to widespread dissent to the asserted “consensus” on various aspects of climate change and global warming.
![]()
The first conference, which took place in March 2008 in New York, dramatized the view that global warming is not a crisis, that it is probably natural and not caused by human activity, and that computer models are unreliable guides to future temperature change. The second conference, which took place in March 2009 in New York, focused on areas where alarmists have lost credibility and where skeptics have gained ground during the past year.
The purpose of the event is to expose Congressional staff and journalists to leading scientists and economists in the nation’s capital. Senators and Representatives will be invited to speak side-by-side with leading scientists and economists. Allied organizations have been invited to be cosponsors, to help supply speakers and promote the event to their members and supporters.
The conference’s theme will be “Climate Change: Scientific Debate and Economic Analysis.” The theme reflects the fact that the scientific debate is not over and that economic analysis is more important than ever, now that legislation is being seriously considered. The real science and economics of climate change support the view that global warming is not a crisis and that immediate action to reduce emissions is not necessary. This is, in fact, the emerging consensus view of scientists outside the IPCC and most economists outside environmental advocacy groups.
The complete program for the 2009 International Conference on Climate Change, including links to videos and PowerPoint presentations as they become available, is here. A copy of the printed program from the conference, which includes cosponsor information and brief biographies of all speakers, can be downloaded in Adobe’s PDF format here.
Click here for the full proceedings of the 2008 International Conference on Climate Change—including audio and video for more than 100 speakers.
Icecap still has 2 admission tickets available if you are in the DC area and would like to attend. E-mail me at jsdaleo@yahoo.com or jdaleo@icecap.us.
By Jay Ambrose
Here’s the first thing you shouldn’t do in front of Al Gore: Be skeptical about catastrophic, human-caused global warming. He will rip your reputation apart, just as he once did to reputable, honorable scientists in congressional hearings. Here’s the second thing you shouldn’t do in front of Al Gore: Ask him whether he himself might have the kind of conflict of interest that he takes for granted in others. For heaven’s sake, do not get into the question of whether he might make a lot of money with the passage of a global warming cap-and-trade tax that he has been fighting for.

Republican Rep. Marsha Blackburn of Tennessee thought it might be interesting to find out. After all, Gore is associated with a venture capital company that has invested about $1 billion in companies that just might make a bundle should cap-and-trade become law. So she asked if he would benefit. Emitting a sigh made infamous in a debate way back when, Gore first replied that “a green economy . . . is good for all of us.” He then said yes, he was a partner in the venture capital company, adding quickly and emphatically that “every penny” he made from environmental investments went to the non-profit Alliance for Climate Protection.
With a smirk on his face, he huffed that no one who knew him would ever think he had been working on the global warming issue for 30 years for “greed.” When Blackburn said she wasn’t making accusations, he said, “I understand exactly what you’re doing, Congresswoman. Everybody here does.” Blackburn called it quits at about that point, although she could have noted that Gore was founder and chairman of the non-profit group he mentioned. She could have explored whether some of the money he gives to the group redounds to him in other ways, such as expense-paid trips. She could also have gotten into reports that his net worth is now $100 million, when it was put at $2 million when he left politics. She could have pursued the tax advantages of his charitable donations. But she didn’t, and I think it is just as well she didn’t. The money Gore’s made since he was vice president seems to come mostly from Internet ventures and speeches given at $175,000 a whack, and I doubt seriously that his campaign on global warming has anything much to do with money. The man is a true believer, or so I believe.
And yet, his hypocrisy is astounding. While he cannot believe anyone could ever conceivably have reason to question his motives, he has never hesitated to question the motives of those who differed with him. In that case, you were bought out by ExxonMobil or are an equivalent of Bernie Madoff, the Ponzi-scheme swindler. Congressional hearings he conducted in 1992 have been described as inquisitorial show trials. One victim, Professor Richard Lindzen of MIT, has written about scientists being “in the crosshairs” of Gore, who “tried to bully” them into changing “their views and supporting his climate alarmism.” Lindzen also refers to a failed Gore effort to “enlist Ted Koppel (then a TV host) in a witch hunt to discredit anti-alarmist scientists.”
Lindzen is viewed by some as one of the nation’s foremost climatologist. Unlike Gore - whose movie and slide show have been rife with error - he knows what he is talking about, probably a major reason Gore won’t debate him. Lindzen years ago did about $10,000 worth of work as a witness for fossil-fuel companies. There was nothing wrong with that, and he clearly was not corrupted by it. Whatever Gore believes, the global warming debate is not over, but what should be over is waging it as an ad hominem contest in which science itself is hurt along with scientists whose arguments should be weighed on their merits. Read more here.
By Jon Birger, senior writer, Fortune
With Congress about to take up sweeping climate-change legislation, expect to hear more in coming weeks from John Christy, director of the Earth System Science Center at University of Alabama-Huntsville. A veteran climatologist who refuses to accept any research funding from the oil or auto industries, Christy was a lead author of the 2001 Intergovernmental Panel on Climate Change report as well as one of the three authors of the American Geophysical Union’s landmark 2003 statement on climate change.
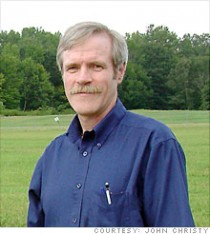
Yet despite those green-sounding credentials, Christy is not calling for draconian cuts in carbon emissions. Quite the contrary. Christy is actually the environmental lobby’s worst nightmare - an accomplished climate scientist with no ties to Big Oil who has produced reams and reams of data that undermine arguments that the earth’s atmosphere is warming at an unusual rate and question whether the remedies being talked about in Congress will actually do any good.
Christy’s critics in the blogosphere assume his research is funded by the oil industry. But Christy has testified in federal court that his research is funded by the National Oceanic & Atmospheric Administration and that the only money he has ever received from corporate interests - $2,000 from the Competitive Enterprise Institute for penning a chapter of a global warming book in 2002 - he gave away to a charity, the Christian Women’s Job Corps.
His most controversial argument is that the surface temperature readings upon which global warming theory is built have been distorted by urbanization. Due to the solar heat captured by bricks and pavement and due to the changing wind patterns caused by large buildings, a weather station placed in a rural village in 1900 will inevitably show higher temperature readings if that village has, over time, been transformed into small city or a suburban shopping district, Christy says.
The only way to control for such surface distortions is by measuring atmospheric temperatures. And when Christy and his co-researcher Roy Spencer, a former NASA scientist now teaching at UA-Huntsville, began analyzing temperature readings from NOAA and NASA satellites, they found much slighter increases in atmospheric temperatures than what was being recorded on the surface. Christy and Spencer also found that nearly all the increases in average surface temperatures are related to nighttime readings - which makes sense if bricks and pavement are in fact retaining heat that would otherwise be dispersed.
In testimony to the House Ways and Means Committee in February, Christy displayed a chart showing central California temperature trends for both the developed San Joaquin Valley and the largely undeveloped Sierra foothills. “The daytime temperatures of both regions show virtually no change over the past 100 years, while the nighttime temperatures indicate the developed Valley has warmed significantly while the undeveloped Sierra foothills have not,” Christy told the committee.
During his House Ways and Means testimony, Christy showed a chart juxtaposing predictions made by NASA’s Jim Hansen in 1988 for future temperature increases against the actual recorded temperature increases over the past 20 years. Not only were the actual increases much lower, but they were lower than what Hansen expected if there were drastic cuts in CO2 emissions - which of course there haven’t been. [Hansen is a noted scientist who was featured prominently in Al Gore’s global warming documentary, “An Inconvenient Truth."] Hansen was at that hearing.
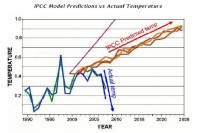
Contacted by Fortune, Hansen acknowledges that his 1988 projections were based on a model that “slightly” overstated the warming created by a doubling in CO2 levels. His new model posits a rise of 3 degrees Celsius in global temperatures by 2100, vs. 4.2 degrees in the old one. Says Hansen, “The projections that the public has been hearing about are based on a climate sensitivity that is consistent with the global warming rate of the past few decades.” Christy’s response: “Hansen at least admits his 1988 forecasts were wrong, but doesn’t say they were way wrong, not ‘slightly,’ as he states.” Christy also claims that even Hansen’s revised models grossly overestimated the amount of warming that has actually occurred. Read more here.
By David Deming in The American Thinker
Those who ignore the geologic perspective do so at great risk. In fall of 1985, geologists warned that a Columbian volcano, Nevado del Ruiz, was getting ready to erupt. But the volcano had been dormant for 150 years. So government officials and inhabitants of nearby towns did not take the warnings seriously. On the evening of November 13, Nevado del Ruiz erupted, triggering catastrophic mudslides. In the town of Armero, 23,000 people were buried alive in a matter of seconds.
For ninety percent of the last million years, the normal state of the Earth’s climate has been an ice age. Ice ages last about 100,000 years, and are punctuated by short periods of warm climate, or interglacials. The last ice age started about 114,000 years ago. It began instantaneously. For a hundred-thousand years, temperatures fell and sheets of ice a mile thick grew to envelop much of North America, Europe and Asia. The ice age ended nearly as abruptly as it began. Between about 12,000 and 10,000 years ago, the temperature in Greenland rose more than 50 °F.
The climate of the ice ages is documented in the ice layers of Greenland and Antarctica. We have cored these layers, extracted them, and studied them in the laboratory. Not only were ice ages colder than today, but the climates were considerably more variable. Compared to the norm of the last million years, our climate is remarkably warm, stable and benign. During the last ice age in Greenland abrupt climatic swings of 30F were common. Since the ice age ended, variations of 3F are uncommon.
For thousands of years, people have learned from experience that cold temperatures are detrimental for human welfare and warm temperatures are beneficial. From about 1300 to 1800 AD, the climate cooled slightly during a period known as the Little Ice Age. In Greenland, the temperature fell by about 4F. Although trivial, compared to an ice age cooling of 50F, this was nevertheless sufficient to wipe out the Viking colony there.

In northern Europe, the Little Ice Age kicked off with the Great Famine of 1315. Crops failed due to cold temperatures and incessant rain. Desperate and starving, parents ate their children, and people dug up corpses from graves for food. In jails, inmates instantly set upon new prisoners and ate them alive. The Great Famine was followed by the Black Death, the greatest disaster ever to hit the human race. One-third of the human race died; terror and anarchy prevailed. Human civilization as we know it is only possible in a warm interglacial climate. Short of a catastrophic asteroid impact, the greatest threat to the human race is the onset of another ice age.
The oscillation between ice ages and interglacial periods is the dominant feature of Earth’s climate for the last million years. But the computer models that predict significant global warming from carbon dioxide cannot reproduce these temperature changes. This failure to reproduce the most significant aspect of terrestrial climate reveals an incomplete understanding of the climate system, if not a nearly complete ignorance. Global warming predictions by meteorologists are based on speculative, untested, and poorly constrained computer models. But our knowledge of ice ages is based on a wide variety of reliable data, including cores from the Greenland and Antarctic ice sheets. In this case, it would be perspicacious to listen to the geologists, not the meteorologists. By reducing our production of carbon dioxide, we risk hastening the advent of the next ice age. Even more foolhardy and dangerous is the Obama administration’s announcement that they may try to cool the planet through geoengineering. Such a move in the middle of a cooling trend could provoke the irreversible onset of an ice age. It is not hyperbole to state that such a climatic change would mean the end of human civilization as we know it.
Earth’s climate is controlled by the Sun. In comparison, every other factor is trivial. The coldest part of the Little Ice Age during the latter half of the seventeenth century was marked by the nearly complete absence of sunspots. And the Sun now appears to be entering a new period of quiescence. August of 2008 was the first month since the year 1913 that no sunspots were observed. As I write, the sun remains quiet. We are in a cooling trend. The areal extent of global sea ice is above the twenty-year mean. We have heard much of the dangers of global warming due to carbon dioxide. But the potential danger of any potential anthropogenic warming is trivial compared to the risk of entering a new ice age. Public policy decisions should be based on a realistic appraisal that takes both climate scenarios into consideration. Read full post here.
Listen to radio interview with G. Gordon Liddy here.
By Dr. James Hansen
My response to the letter from Dr. Martin Parkinson, Secretary of the Australian Department of Climate Change, is available, along with this note, on my web site. Thanks to the many people who provided comments on my draft response, including Steve Hatfield-Dodds, a senior official within the Australian Department of Climate Change. I appreciate the willingness of the Australian government to engage in this discussion. I believe that you will find the final letter to be significantly improved over the draft version.
Several people admonished me for informal language, which detracts from credibility, and attempts at humor with an insulting tone (e.g., alligator shoes). They are right, of course - these should not be in the letter. So I reserve opinions with an edge to my covering e-mail note.
My frustration arises from the huge gap between words of governments, worldwide, and their actions or planned actions. It is easy to speak of a planet in peril. It is quite another to level with the public about what is needed, even if the actions are in everybody’s long-term interest. Instead governments are retreating to feckless “cap-and-trade”, a minor tweak to business-as-usual. Oil companies are so relieved to realize that they do not need to learn to be energy companies that they are decreasing their already trivial investments in renewable energy. They are using the money to buy greenwash advertisements. Perhaps if politicians and
businesses paint each other green, it will not seem so bad when our forests burn.
Cap-and-trade is the temple of doom. It would lock in disasters for our children and grandchildren. Why do people continue to worship a disastrous approach? Its fecklessness was proven by the Kyoto Protocol. It took a decade to implement the treaty, as countries extracted concessions that weakened even mild goals. Most countries that claim to have met their obligations actually increased their emissions. Others found that even modest reductions of emissions were inconvenient, and thus they simply ignored their goals.
Why is this cap-and-trade temple of doom worshipped? The 648 page cap-and-trade monstrosity that is being foisted on the U.S. Congress provides the answer. Not a single Congressperson has read it. They don’t need to - they just need to add more paragraphs to support their own special interests. By the way, the Congress people do not write most of those paragraphs - they are “suggested” by people in alligator shoes (lobbiests). Read more and the letter to Dr. Martin Parkinson, Secretary, Department of Climate Change, Government of Australia here.
See also Roger Pielke Jr.’s post on how Exxon Mobil’s CEO Rex Tillerson agrees with Hansen.