


By Alan Caruba
As Earth Day approaches on April 22--the birthday of Vladimir Lenin--my blog (http://factsnotfantasy.blogspot.com) better known as “Warning Signs” will devote the week ahead to an examination of environmentalism’s roots and deceptions. You are welcome to visit the blog and share any or all of its commentaries.—Alan Caruba
The week begins with the commentary below.
As the nation and the world closes in on Earth Day, April 22nd, a tsunami of Green propaganda will overwhelm us with all the usual lies about global warming - now called climate change - and calls to reduce the use of all fossil fuels in order to reduce “greenhouse gas” emissions.
This Big Lie ignores the fact that there is no relationship between carbon dioxide (CO2) and the climate. CO2 reacts to climate change. It does not drive it. The Big Lie ignores the fact that the Earth has been cooling for fourteen years.
The past three and a half years of the having Barack Obama as President have been filled with constant crisis, not the least of which was the nation’s financial crisis which he constantly reminds us he “inherited.” He has not, however, solved it with proven ways to put millions back to work and turn around a stagnant economy.
Instead he devoted his best efforts to a takeover of one-sixth of the nation’s economy, the healthcare industry. His administration has waged a steady war on access to energy reserves vital to the nation’s economy. The result of these policies are being felt at the gas pump as prices rise to historic highs while billions of barrels of oil in the U.S. remain underground.
His devotion to all the eco-lies was seen in the millions wasted on “green jobs” with his failed “stimulus” and loans to “green industries”, primarily wind and solar power. Other schemes included high-speed trains where none are needed or wanted. To this day Amtrak has never made a profit. And electric cars remain impractical and unaffordable.
His environmental commitment was perhaps best seen and heard when Obama attended a United Nations Conference of Parties in Copenhagen in March 2010. His speech to the delegates and world press contained all the lies associated with “climate change” and the failed policies he was pursuing two years ago and earlier.
“We come together here in Copenhagen because climate change poses a grave and growing danger to our people. You would not be here unless you - like me - were convinced that this danger is real. This is not fiction, this is science,” said Obama.
Aside from the fact that the climate has always been in a state of change for Earth’s 4.5 billion years, the science employed to frighten people about such change does not bear any resemblance to real science which is an impartial blend of data based on replicable experiments.
Real science does not have a political agenda. The bogus science of global warming was revealed in November 2009 when the world learned that a handful of Intergovernmental Panel on Climate Change (IPCC) “scientists” had systematically distorted the scientific process, conjuring up false computer models that ignored significant elements of climate history. The revelations would be dubbed “Climategate.”
Never one to not criticize America, Obama reminded the delegates that America was “the world’s second largest emitter” of greenhouse gases even though such gases do not function as a greenhouse, trapping and holding heat. If they did, how would one explain the fact that the Earth has been in a natural cooling cycle since around 1998?
What is the mark of a developing or successful economy? It is the use of energy!
Obama promised that the U.S. would work “to phase out fossil fuel subsidies” and promised “historic investments in renewable energy” and his intention to put Americans “to work increasing efficiency in our homes and buildings; and by pursuing comprehensive legislation to transform to a clean energy economy.”
Such a transformation is ludicrous. America runs on oil, on coal, on natural gas, on hydroelectric and nuclear power. The investments in wind and, in particular, solar power, have wasted millions of taxpayer dollars. Combined, wind and solar provide less than two percent of the nation’s electrical power while coal provides nearly half. It has been the use of coal that the Obama administration’s Environmental Protection Agency has been determined to reduce or end, falsely claiming CO2 is a “pollutant.”
Typically, Obama said “There is no time to waste.” In reality the Obama administration has wasted every opportunity to increase access to America’s vast energy reserves. Even when bragging about oil production, Obama never admits that it is occurring on private land. His administration has virtually shut down access to exploration and extraction on federally owned and managed land.
Environmentalism is the mask of communism, concentrating ownership of all property and productivity in the hands of the government. Even when addressing the need to ensure clean air and water, it has been used as a blunt instrument of power to limit economic development.
These are well established environmental lies and they are Obama’s environmental lies.
The Copenhagen conference came to a hasty end as the world’s leaders fled the city to avoid being trapped there by a massive blizzard. The global warming they all warned against in 2010 was not occurring and is not occurring.
ICECAP NOTE: Obama supports the UN request that the US provide to the UN 2.5 Trillion dollars over the next decade to support global ‘sustainability’, the already failed global green agenda. Obama supports this globalization effort and this expenditure. This is a wealth transfer mechanism and has little to do with climate change or environmental issues as admitted by IPCC official Ottmar Edenhofer in November 2010 “one has to free oneself from the illusion that international climate policy is environmental policy.” Instead, climate change policy is about how “we redistribute de facto the world’s wealth...” We would cede soverienty in the process, enabling the UN to impose laws that we are obliged to follow and global taxes we are obliged to pay. Instead of supporting the UN, we should kick their useless asses out of the US and convert the UN towers to low income housing. Let the UN find another sucker for a world HQ, (some have suggested Obama’s birthplace - An internal bulletin from the Kenyan National Security Intelligence Service, or NSIS, states that the Kenyan government in 2009 commissioned a cultural museum in the Obama home village of Kogelo to honor the “birthplace of President Barack Obama” and rededicate the tomb of his father, Barack Obama Sr. See) and use the 2.5 trillion to pay down our national debt.
By Alan Caruba
In many ways, the worst aspect of environmentalism is why Greens not only feel free to terrorize children with doomsday scenarios, but feel compelled to do so.
I have been reviewing books for some fifty years and with the publication of Rachel Carson’s “Silent Spring” in 1962 and books such as Paul Ehrlich’s “Population Bomb” have been offering scenarios intended to move people and governments to take action that, in retrospect, were based on bad “science” and absurd doomsday predictions.
If you were fooled by global warming, they are counting on you to be fooled again by “sustainability”, their reworking of Marx’s communism in the form of a grandiose scheme to control all of the Earth’s bounty. In June the United Nations will hold a Rio+20 conference that will declare that governments exist to ensure “sustainable well-being and happiness.” The Declaration of Independence offers the opportunity to pursue happiness. It does not guarantee it, nor does it suggest that it is government’s job to provide it.
A key element of the Green’s endless indoctrination schemes has been to reach children, the most vulnerable among us and for this reason our schools have been turned into Green prisons where their version of the Earth is pumped into the minds of children here and around the world.
Their primary teaching tool is fear. Fear that the oceans will rise and wipe out entire cities. Fear that the rainforests are disappearing. Fear that entire species are being destroyed by the hand of man. Fear that the use of any kind of fuel, coal, natural gas, and oil is despoiling the planet.
I have reviewed books for some fifty years at this point and I could not put a number on the books for children that hammer home these and other terrifying themes. One crossed my desk the other day, “Our House is Round: A Kid’s Book About Why Protecting Our Earth Matters” by Yolanda Kondonassis and illustrated by Joan Brush. It has been called “the perfect children’s introduction to environmental issues” by Fred Krupp, the president of the Environmental Defense Fund.
The author is not a biologist, a geologist, a meteorologist, or any other kind of scientist. She is a Grammy-nominated classical harpist. A harpist!
“Our Earth has gotten messy. What should we do?” she asks her young reader. What does she mean by “messy”? Her answer is that “cars, trucks, and factories make pollution, a kind of dirty gas or liquid that goes out into the air and into our rivers, lakes, and oceans.” This book is written for children age five to nine!
Imagine now what it must be like to be that age and be told that the air is polluted and the water is as well. This verges on child abuse.
“Pollution goes up into the sky and forms a blanket of gas that holds heat within Earth’s atmosphere. That makes our whole Earth warmer and leads to unclean air for breathing, melting polar ice caps, rising sea levels, and extreme weather patterns. Scientists call this warming of our Earth’s temperature CLIMATE CHANGE.”
It is a LIE. The Earth has been cooling for fifteen years.
Carbon dioxide is not a pollutant. It is a gas as vital to all life on Earth as oxygen is to the life of living creatures. Without it, not a single blade of grass or tree or the vegetation we call “crops” would not grow. Livestock and wildlife depend on that vegetation. If you are age five to nine, you likely are unaware of this.
This book and all the others that incorporate these lies are a form of psychological terror.
The same week I received “Our House is Round”, I also received “The Big Green Book of the Big Blue Sea” and “Earth-Friendly Buildings, Bridges, and More.” You could stack all the environmentally-themed children’s books I’ve seen and it would reach up several stories.
They are a corruption of geophysical and biological science. They have nothing to do with “saving the planet” and everything to do with distorting children’s understanding of the real world.
It does not matter that the Ms. Kondonassis thinks she is serving humanity. The great lie of communism is that it will create a collectivist utopia. In reality it has always depended on terror to maintain itself and it has failed wherever it has been tried. Environmentalism is its latest permutation.
It is the same reason that communism derides religion for its emphasis on life and morality.
It is the same reason Americans are being subjected to government imposed limitations on energy and transportation, and coerced social change, altering and secularizing our society.
I have devoted my life to freedom of the press, freedom to publish, freedom to speak out, and to urge participation in the life of the greatest nation on Earth, but some books like “Our House Is Round” are the worst kind of mental pollution.
Envionmentalism, like all tyrannies, begins by indoctrinating children.
Editor’s Note: In 1974 Alan Caruba was a founding member of the National Book Critics Circle.
In the AGW movement in the last 15 years, alarmists had to counter a lot inconvenient truths: the Medeival Warm Period, the 1940s warm blip, the cessation of a 20 year warming after 1998, the lack of the hotpot in the troposphere over the lower latitudes strongly shown in the models, the lack of warming and loss of ice over the antarctic and also the ice core data that showed that CO2 followed not led temperature shifts largely because of degassing or absorption in the oceans. They abused the system by taking control of the peer review process and then pumping out garbage papers with bad science and faulty statistical methods to try and make these issues go away and provide to their friendly enviro journalist and the politicans the ammunition to try and convince the too trusting public that we were causing a planetary emergency requiring a major change in oiur lifestyle and push an unsound energy and share the wealth agenda. Literally billions of dollars were provided to these liar scientists to create this case. The likes of Mann, Steig, Santer, Ramsdorf, Wang /Lean, Peterson are just a few names. There has always been a rush to publish the most ‘useful’ though scientifically flawed papers just before major IPCC or EPA reports. When they could not argue or present alternative science they took to ad hominem attacks.
There are many papers that used ice cores to show that temperatures led CO2 by 800-1200 years. Allan MacRae published one on Icecap.
Shakun’s paper has been met with a barrage of posts and anayses that show how flawed this document is. See this one by Dr Bill Gray. Numerous posts at Watts Up with That and Climate Depot deal with it. Here is what Piers Corbyn says.
As Dr.John McLean (loved him in Die Hard) who authored a number of papers including some very indicting of the IPCC process and claims indicates we should expect a flurry of them to get fast tracked in time for the upcoming AR5. By the time papers that falsify these studies are published, it will be too late for the IPCC to consider. That happened with AR4 when they commisioned a pwaper by Wang and Lean that used an unproven solar dynamo theory to try and dscount the sun as a facvtor in climate change although such a connection is obvious to anyonw who looks at solar elements like cycle length, ultraviolet (which change two orders of magnitude more than the brightness), geomagnetic, solarwind/cosmic rays. The IPCC used that to ignore all the other peer reviewed papers that showed solar forcing was important to actually CUT solar forcing by a factor or 7!
The latest laughable document attempts to use proxy data to show CO2 drives warming. It comes from a man who went out of the way to mention Al Gore was right and Laurie David, an HBO producer who worked on the NOAA TSD documents for the EPA (to sex them up) and who published a book for children where she mislabeled the CO2 and temperatures in order to make it appear CO2 drove temps.
Here is Dr Easterbook’s first attempt at a reply.
In a paper “Global warming preceded by increasing carbon dioxide concentrations during the last deglaciation”, Shakun et al.(2012) contend that rising temperature at the end of the last Pleistocene glaciation were preceded by increasing atmospheric CO2. In his usual masterful fashion, Willis Eschenbach has dug deeply into the data used in the paper and shredded the conclusions in it (see and here. So rather than dwell on the things that Willis has already shown so well, I thought I’d take a look at some of the assumptions and misconceptions that paper is built upon.
When reading a paper like this, I always like to ask myself, what are the basic assumptions that underlie the methodology involved? What contentions are simply stated as fact or generated in a computer model, rather than demonstrated with real, physical evidence? I will confess here that I don’t believe computer models really prove anything. Sure, they can suggest many things and point out areas of interest, but I live the real world and prefer real physical evidence upon which to base important conclusions. That doesn’t mean I discount models out of hand - it simply means that I look for physical evidence to confirm or deny what the models are saying. So I asked myself a series of questions about the basic issues in this paper. Here are some of the questions that I came up with (the answers follow).
1. Can the Antarctic ice cores be dated with sufficient accuracy to establish a firm temperature chronology?
2. Are the 80 temperature proxies used in the paper sufficiently accurate to establish a solid global temperature chronology?
3. Can CO2 in the ice cores be measured with validity and accuracy?
4. Can the difference in the age of the trapped air and the age of the enclosing ice be determined and is it constant with age?
5. Are CO2 measurements from air bubbles valid or do diffusion and the uncertainty in the timing of isolation of air in bubbles render them invalid?
6. Is the data from Antarctic ice cores consistent with data from the Greenland ice cores?
7. Is the temperature chronology of the ice cores and global proxies consistent with the well-dated, global glacial record?
8. Is the so-called ‘see-saw’ of climate changes between hemispheres valid, i.e, are climate changes in the Northern Hemisphere out of phase with those in the Southern Hemisphere?
9. Would correlation between CO2 and temperature necessarily prove that CO2 causes climatic warming?
10 Since CO2 is incapable of causing climatic warming by itself (CO2 makes up only 0.038% of the atmosphere and accounts for only a few percent of the greenhouse gas effect), is there evidence of concomitant increase in water vapor (which causes more than 90% of the greenhouse gas effect)?
11. Is the AMOC the only viable causal mechanism? What about the influence of the Pacific Ocean, which covers about half the Earth’s surface

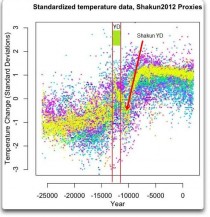
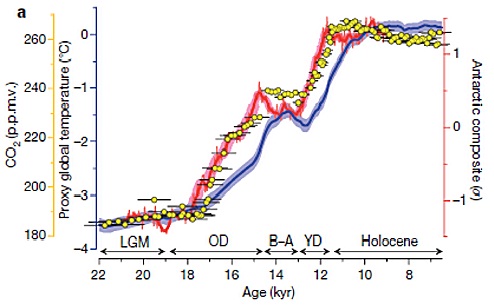
So, what is the main contention of this paper and what does it imply? The authors claim to have “compelling evidence that rising CO2 caused much of the global warming” at the end of the last ice age, roughly 11,000 to 25,000 years ago. According to the authors, “if you reconstruct temperatures on a global scale - and not just examine Antarctic temperatures - it becomes apparent that the CO2 change slightly preceded much of the global warming, and this means the global greenhouse effect had an important role in driving up global temperatures and bringing the planet out of the last Ice Age.” The crux of their contention is illustrated in their Figure 2.
Shakun et al. Figure 2. The Red line is Antarctic temperature curve based on ice cores; the yellow dots are CO2 measurements from ice cores; the blue line is composite global temperature from 80 proxies.
Willis has sliced and diced the data behind these curves so be sure to read his analyses. I’ll refer to some of his graphs and conclusions but look at the Shakun et al. contentions from a somewhat different angle. Because this is such a marked divergence from the widely held view that CO2 lagged rising temperatures at the end of the last ice age, careful scrutiny must be given to evidence and assumptions upon which this contention is based. Right off the bat, a most surprising conclusion in this paper is that the authors claim that correlation proves cause. Simply showing that CO2 correlates with anything surely doesn’t prove that CO2 was the cause. It’s the same kind of mindset involved with the oft-heard claim that if we have had global warming while CO2 was rising that proves the cause was the rise in CO2. Heck, I had hair before CO2 began to rise, but I don’t blame that on CO2.
So let’s look at each of questions posed above.
1. How accurate is the dating of Antarctic ice cores? How can you date ice that has nothing in it that can be directly dated? The Shakun et al. paper states that they use the methodology of Lemieux-Dudon et al. (2010), which involves construction of a model using estimates of snow accumulation rates, temperature, firn densification rates, and ice flow rates, all of which vary from glacier to glacier and from glaciation to interglaciation (thus introducing large potential errors). The modeling data is then modified by matching with tephra horizons, sulfate spikes, δ18O, firn densification model results, and orbital tuning. All of the assumptions built into the modeling are cumulative, resulting in large possible age errors. As Lemieux-Dudon point out “One special feature of glaciological models is a large model error due to unresolved physics and errors on the forcing fields, clearly affecting the quality of the inferred dating scenarios.” What this means of course is that the age determinations of the Antarctic cores are, at best, educated guesses with large uncertainties. Because chronology is so critical to the Shakun et al. contention, the ages of the Antarctic cores shown in their Figure 2 cannot be considered accurate.
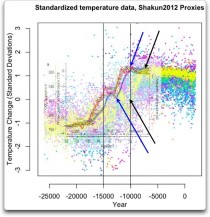
2. Are the 80 temperature proxies used in the paper sufficiently accurate to establish a solid global temperature chronology? Willis Eschenbach has made a detailed analysis of the data used to construct the global temperature curve in Figure 2 of Shakun et al.(see this in his web posting) He plotted individual curves for each of the 80 temperature proxies used to create Figure 2 in the Shakun et al. paper. What he found was large variability in the data, which led him to conclude that “The variety in the shapes of these graphs is quite surprising Yes, they’re all vaguely alike, but that’s about all. The main curiosity about these, other than the wide variety of amounts of warming, is the different timing of the warming.” When he ploted all the individual proxies all together (see below), the scatter is readily apparent, leading him to conclude: “It’s clear that there is warming since the last ice age.” “But if you want to make the claim that CO2 precedes the warming? I fear that this set of proxies is perfectly useless for that. How on earth could you claim anything about the timing of the warming from this group of proxies? It’s all over the map.”
Large scatter of individual data points on Williis’s plot from the 80 proxies used in the construction of the Shakun et al. temperature curve. I’ve added lines to show the age of Younger Dryas interval, which doesn’t correspond to the dip in the Shakun et al. temperature data.
Enlarged
Just for fun, I superimposed the curves on Shakun et al. figure 2 over Willis’s data point plot (see below). Because the global temperature curve (the blue curve) was presumably derived from the data in Willis’s plot, it should fit well with it. Interestingly, it doesn’t. I’ve shown with a blue arrow the dip in temperature that corresponds to the Younger Dryas and a black arrow pointing to what should be the same dip in temperature on the plot of individual data points. Other arrows point to similar differences for the end of the Younger Dryas. Now you would think that since the Shakun et al. blue curve was constructed from the individual data points shown on the graph, the two should surely be compatible! I’ve also shown on the graph the well-established age of the Younger Dryas - note that the Shakun et al. global temperature data points show a dip in temperature (presumably the Younger Dryas) that is considerably younger. Makes you wonder!
Comparison of the Shakun et al. global temperature curve with the data from which it was constructed. The blue arrows point to the Younger Dryas dip in temperatures and the black arrows point to the ending of the Younger Dryas. The two should match, but don’t.
3. Can CO2 in the ice cores be measured with validity and accuracy?
4. Can the difference in the age of the trapped air and the age of the enclosing ice be determined and is it constant with age?
5. Are CO2 measurements from air bubbles valid or do diffusion and the uncertainty in the timing of isolation of air in bubbles render them invalid? Because these questions are all inter-related let’s consider them together. The validity of measurement of CO2 from bubbles in ice cores has been challenged in a number of studies. There are several basic problems: (1) air becomes trapped in ice during the conversion of snow to firn to ice. Air in the snow/firn phase remains in contact with surface air until it turns to ice and seals off air bubbles from further mixing with surface air. The depth at which sealing occurs varies considerably, depending on the rate of firn densification, and may extend to more than 100 meters and take a thousand years or more. This means that the age of air in a bubble is not the same as the age of the inclosing ice. Snow densification rates vary considerably between temperate and polar glaciers and between glacial and interglacial climates, making it difficult to measure and date adequately. In any case, rates are not likely to be constant. (2) a second problem results from possible diffusion along the walls of an air bubble, which can upset the CO2 concentration in the bubble. These and other problems mean that measurement of CO2 in ice cores is not straight forward - measurement of CO2 concentrations in ice bubbles and determination of the age of the air are likely to be quite variable. General trends are apparent in CO2 ice core measurements, but variability in CO2 concentrations and age remains problematic.
At this point, answering the remaining questions is quite obviously going to take some time, so they will be considered in Part 2, here.
Myron Ebell, CEI
As millions of people sit in the dark during Earth Hour to call for action against climate change this weekend, a libertarian think tank wants you to fight the power by keeping the lights on.
The Competitive Enterprise Institute plans to commemorate Earth Hour 2012 with its “Human Achievement Hour,” 60 minutes to gather with friends in a heated home, watch television and surf the Internet instead of dimming or shutting off the lights altogether to draw attention to climate change.
“HAH is an annual event meant to recognize and celebrate the fact that this is the greatest time to be alive, and that the reason we have come is that people have been free to use their minds and the resources in their environment to experiment, create, and innovate,” reads a CEI website on the event scheduled to coincide with Earth Hour 2012 from 8:30 to 9:30 p.m. local time Saturday.

Participants in the event understand the “necessity to protect the individual persons from government coercion,” according to the Washington-based think tank.
“Observers of Earth Hour want world leaders to ‘do something’ about pollution and energy use,” the website continues. “What this means is that they want politicians to use legal mandates and punitive taxes to prevent individuals from freely using resources, hindering our ability to create the solutions and technologies of the future.”
Myron Ebell, CEI’s director of energy and global warming policy, said the event is about saluting the people who “keep the lights on and produce the energy” that makes human achievement possible.
More than 5,200 cities in 135 countries worldwide participated in Earth Hour 2011, according to the event’s website. It was originally conceived in 2007 in Australia by the World Wide Fund for Nature and was expanded globally the following year.
“Earth Hour encourages individuals, businesses and governments to show leadership on environmental solutions through their actions, to use Earth Hour as a platform to showcase to the world what measures they are taking to reduce their environmental impact,” EarthHour.org reads. “Taking the first step is as easy as turning off your lights.”
Requests for comment from Earth Hour officials on the counter event were not immediately returned.
Those who do flip the switch, however, are encouraged only to turn off non-essential lights and not those that affect public safety. Candles to be used in lieu of lights should be 100 percent beeswax or soy varieties, according to Earth Hour officials, because they are non-toxic and non-allergenic.
Update: See Roy Spencer discuss the EPA run amuk on John Stossel’s show.
------------------------------------
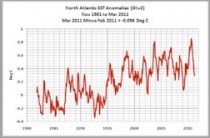
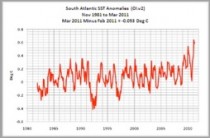
There has been a stunning disconnect involving land temperatures globally and CO2, whether man-made or naturally sourced. The Oceans continue to warm, while the surface record flatlines.
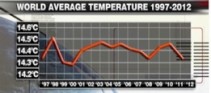
Check out the Hadley CRU World temperature record over the past 15 years.
The Recent Temperature and CO2 Disconnect
It is obvious that the surface records are NOT going up - they are basically in a 0.2C flatline, while Sea Surface temperatures are still somewhat rising, as you see below; (both with an obvious Mt. Pinatubo signal).
This is totally expected behavior in a Ewing-Donn oriented system, as the recently enhanced albedo effects first affect land and only considerably later, do the oceans overcome their heat content lag.
Even going back ten centuries, there have been total disconnects between temperature and the CO2 impact, or lack thereof. From 1000AD to 1800, over a period of relatively stable CO2 values that bounced around the 280ppm level, temperatures plummeted in the Little Ice Age (LIA) and then rebounded over a century later. CO2 values neither led nor followed the temperature declines and recoveries. Now we have CO2 ranges that almost double the maxima reached in the past 4 interglacial periods (over 450,000 years), and temperatures remaining relatively stable for most of the last 10K year span. CO2 seems to have had little impact in EITHER direction on the observed temperatures over that 10k year period. Neither have sunspots, for that matter, nor their lack, and their signal is largely absent from the temperature record, except for the LIA Maunder Minimum of the 16-1700s, and the Dalton to a lesser extent.

There have been times that CO2 direction paralleled temperature trends, but coincidence is not causation, and the short term uncoupling of temperature from a previous parallel growth assumption has now become totally obvious!
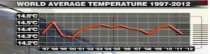
Now here’s a different way of seeing 2011, in that for the recent term, it has been the third coldest of the last 15! 2012 is starting out even lower, and will likely be the winner in the “coldest” of the now 16 year timeframe.
The decided 15 year flatline in temperatures is very evident, even as CO2 has continued to increase regularly from 1997’s 364 ppm to today’s 392 ppm. Here’s the up-to-date Mauna Loa CO2 record:
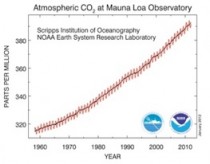
If CO2 is to be considered a major driver of temperatures, it is doing a counterintuitive dance around the numbers. Now 15 years should not be relied upon for any trend, but the short term uncoupling of CO2 from temperature is evidence that far greater complexities are at hand and to be found in the climate sphere given appropriate research and analysis. Albedo effects from an open Arctic, melted by warming oceans streaming into the Arctic basin, and a decided La Nina are also among the “Usual Suspects.”
By Anthony Watts, Watts Up With That
In today’s report
■ Arctic Sea Ice on the rise again, presently in the range of normal levels
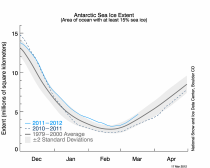
■ Antarctic Sea Ice is at slightly above normal levels
■ Why is early satellite data for Arctic and Antarctic Ice extent referenced in the first IPCC report missing from today’s data?
■ Is revisionism going on with the date of the famous USS Skate photo in the Arctic?
■ Bonus - it seems NOAA is taking Arctic soot seriously
First the Arctic from NSIDC:
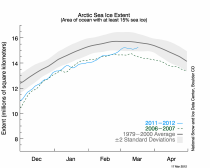
After being out of the ±2 STD area since before peak melt last year, Arctic extent has spent most of March in near normal territory. After what looked like a maximum earlier this month, it was false peak, and ice is on the rise again.
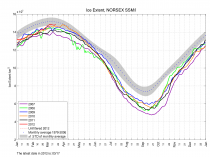
NORSEX SSM/I shows the current value within ±1 STD
A caution, as we saw in 2010, extent hugged the normal line for quite awhile, and that didn’t translate into a reduced or normal summer melt. So, forecasting based on this peak might not yield any skillful ice minimum forecasts.
Antarctic Sea Ice is at slightly above normal levels, as it has been for some time:
Why is early satellite data for Arctic and Antarctic Ice extent referenced in the first IPCC report missing from today’s data?
In a post last week, Steve Goddard pointed out that in the original IPCC FAR in 1990, there was an interesting graph of satellite derived Arctic sea ice extent:
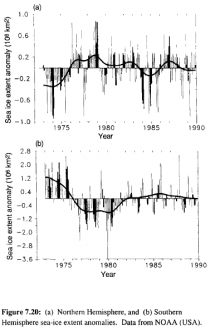
This is from page 224 of IPCC FAR WG1 which you can download from the IPCC here
And here is figure 7.20 (a) magnified:
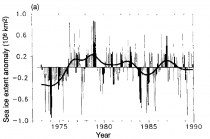
The IPCC descriptive text for these figures reads:
Sea-ice conditions are now reported regularly in marine synoptic observations, as well as by special reconnaissance flights, and coastal radar. Especially importantly, satellite observations have been used to map sea-ice extent routinely since the early 1970s. The American Navy Joint Ice Center has produced weekly charts which have been digitised by NOAA. These data are summarized in Figure 7.20 which is based on analyses carried out on a 1° latitude x 2.5° longitude grid. Sea-ice is defined to be present when its concentration exceeds 10% (Ropelewski, 1983). Since about 1976 the areal extent of sea-ice in the Northern Hemisphere has varied about a constant climatological level but in 1972-1975 sea-ice extent was significantly less. In the Southern Hemisphere since about 1981, sea-ice extent has also varied about a constant level. Between 1973 and 1980 there were periods of several years when Southern Hemisphere sea-ice extent was either appreciably more than or less than that typical in the 1980s.
I find it interesting and perhaps somewhat troubling that pre-1979 satellite derived sea ice data was good enough to include in the first IPCC report in 1990, but for some reason not included in the current satellite derived sea ice data which all seems to start in 1979:
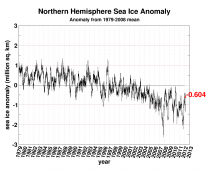
Since the extent variation anomalies in 1979 seem to match with both data sets at ~ +1 million sq km, it would seem they are compatible. Since I’m unable to find the data that the IPCC FAR WG1 report references so that I can plot it along with current data, I’ve resorted to a graphical splice to show what the two data sets together might look like.
I’ve cropped and scaled the IPCC FAR WG1 Figure (a) to match the UUIC Cryosphere Today Arctic extent anomaly graph so that the scales match, and extended the base canvas to give the extra room for the extended timeline:
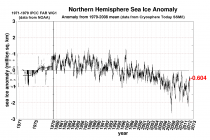
Click here to enlarge.
Gosh, all of the sudden it looks cyclic rather than linear, doesn’t it?
Read more here
Elevated from a WUWT comment Theodore White says: March 8, 2012 at 5:04 pm
Let’s clarify a few things on another of Anthony’s excellent posts, like this one ‘Hey Hansen! Where’s the Beef !?‘ -
It’s lengthy, but gives the view of a person who was there on the ground, covering climate science and global warming in the late 1980s - years before the AGW mania took off.
I worked as a journalist in the late 1980s in Colorado, home state of Senator Tim Wirth. I had interviewed him several times on other topics. As part of my general assignment beat, I also covered science, climate and weather, regularly at NOAA, NCAR and other federal science agencies headquarted in Colorado.
I clearly remember the tone of articles on global warming during the 1980s. Most of the concern came out of the National Center for Atmospheric Research (NCAR) on the ozone layer. By the way, this was during the new era of climate scientists working with high-grade graphic computer modelling.
The problem with NCAR’s interpretation on the ozone fluctuations were that some, like Hanson, took an immediate ideological tone to explain the ozone shifts - not once mentioning the Sun or the Interplanetary Magnetic Field effect on Earth’s ozone layers. For some reason, there was a resistance to even mentioning the Sun’s effects on earth by these new climate scientists getting jobs at the science agencies. It was odd I thought.
When news editors assigned stories on the climate back then it was usually spurred by press releases out of places like NCAR, NWS, NOAA, etc., which usually featured a talk, lecture, or findings that were sent to the media. Global warming, in the mid-to-late 1980s was not the AGW ideological era that it is today.
In fact, climate scientists were not in any agreement if the earth was ‘warming’ in the 1980s - though it was true. Many scientists would roll their eyes at the mention of ‘global warming’ but many changed their tune in the 1990s just as major federal dollars were being directed to ‘man-made’ global warming’ - which I continue to remind everyone cannot ever happen on Earth due to the laws of thermodynamics. The Earth can never become a greenhouse according to the laws of physics.
But I digress - in short, when I wrote pieces on the climate, I refused to write on the theory that chlorofluorocarbons were the sole cause of worldwide warming because that had never been proved. Now, though there was evidence that the use of aerosols were clearly evident in the upper atmosphere; the data did not support that this was the cause of the fear-mongering on ozone holes which was all the rage in the climate community of the late 1980s and 1990s.
NCAR had modeled on the theory that aerosols were the cause, but not the Sun, which again, I found odd, since the only major source of radiation that can only affect the opening and closings and sizes of the Earth’s ozones IS the Sun.
There is no other source of radiation that can effectively destroy the earth’s ozone layer. But what was curious (and unbelievable) is that there were obvious determined efforts (in the mid-to-late 1980s) to blame mankind for something it could not do on a planetary level - and that is to change the climate.
Only the Sun can do that.
What I noticed about Sen. Wirth and Hansen back in the late 1980s, is that there was a obvious concerted effort within the emergence of baby boomer management and personnel into climate science on the federal level; that they were pushing ideology as policy. This was a prepatory assault that was planned out.
When Al Gore rose to the vice-presidency by 1993 - Wirth and Hansen were already well out in front of the ‘man-made’ global warming pack - extending the ‘man-made’ ideology to other federal agencies and the university-level climate community - with federal dollars.
Follow the money pushing the ideological AGW lie. If one examines climate science funding from 1986 to 1996 and then from 1996 to the present - you may find some amazing numbers.
Incredible amounts - increasing yearly and wasted on every bigger and more expensive computers to run models. Careerists who cannot forecast seasonal weather were making things up (and began to alter weather data on purpose) while spending lavishly on computers pushing the AGW ideology - all at the public’s great expense.
But the media was not on board. Most journalists are ignorant of climate and weather science. I was fortunate in that I was not, so my editors passed on to me the great amount of work - and I was busy enough as it was a police reporter as it was! Since my beat included covering the climate science community in the heart of it in Colorado, I was well-attuned to how events were shaping up by 1989.
Since the mid-1980s, what I saw were articles like the one Anthony posted from 1986 were becoming more common. What I observed as professional reporter was that the ozone-layer press releases from NOAA and NCAR and other climate centers were beginning to use the same talking points in their different releases to news desks. Sometimes, these went out on the wire which were then placed into newspapers across the country without the resources to assign reporters to cover the climate.
I did not have that problem since this was part of my beat. In interviews with the particular scientists (including Hansen) what I observed was that they were heavy on the ideology, yet not sure if it was strong enough because the global weather data in the late 1980s did not strongly support their case that the world was warming because of man.
Still, by 1989, the AGW science did not make sense to me in light that it would violate the Second Law of Thermodynamics. Which I remind everyone - remains in effect to this very day.
Anyhow, it did not seem to matter to Wirth’s office, Hansen, or the growing careerists at NCAR and NOAA; because whomever was pushing ‘man-made global warming’ on the United States, were also doing it at the international level too.
My view was that it was a conspiracy right from the start to bamboozle the world on the lie of anthropogenic global warming sandbagging much of the mainstream media, the markets and the educational system to not believe their own eyes and ears.
Events have since proven that I was right.
All this - while AGW ideologists reaped untold profits convincing populations that carbon (the very stuff we are made of) is bad and so we all have to pay for carbon to a global mafia.
In short, the careerist climate AGW scientists and their political insiders conspired to convince the world that humans had to pay dearly for exhaling the carbon gases that the natural world and our trees inhales to flourish.
Carbon is natural to Earth. It is driven by the Sun’s activity. Carbon lags far, far behind temperature (also driven by the Sun) and carbon is not - and never has been - a threat to the Earth.
Why?
Because the laws of thermodynamics and physics that govern our system says so.
By James Delimgpole
Vote in FOX News poll at www.GerriWillis.com:
Is the ‘green’ industry doing more harm than good?
------------------------
Something extraordinary is happening in the great Climate Wars. I had a taste of it just the other day on an LBC talk show. The producer had only booked me in for a ten-minute slot, in case the listeners weren’t interested in my boring new book about that tediously hackneyed subject Man Made Global Warming. But the switchboards were jammed and the station ended up keeping me in for a full hour to reply to all the calls.
There was one big problem though: “We can hardly find ANYONE who disagrees with you,” whispered the show’s host, Julia Hartley-Brewer. This was true. By the end, things had got so desperate that I found myself accidentally picking fights with callers who were on my side. An easy mistake to make for someone on my (sceptical) side of the debate: we card-carrying Satanic “deniers” are so used to being vilified at every turn it really feels kind of weird suddenly to be in tune with the popular mood.
And I’m not the only one to have noticed. A climate sceptical blogger called Pointman has written a superb post on the subject(which is well worth reading in full). The enemy - that’s the alarmists who’ve been making most of the running in the last two decades - is in serious disarray. As Pointman puts it: “All reason has fled. There’s a real feeling of April 1945, Berlin, der Fuhrerbunker and its mad occupants, barking unrealistic orders down phones and moving long ago destroyed units around on maps, as if it really meant something.”
It’s a good point and an accurate analogy. The kind of analogy, unfortunately, which will undoubtedly have the usual greenie/lefty suspects wheeling out their favourite Godwin’s Law defence: ie if you ever mention the Nazis it invalidates you argument because, er, it does because someone called Godwin made a “law” saying it does.....
Yup, I’m weariedly familiar with the Godwin’s law weasel-out. Just as I’m familiar with: the “Appeal to Authority” (eg “the Royal Society/the National Academy of Sciences says”; “98 per cent of the world’s climate scientists agree....."); the crude ad hom: ("James Delingpole is a C***”; “James Delingpole is in the pay of Big Koch”, etc); the straw man ("How can you deny climate change is happening when four of the ten hottest years happened this decade?"). The Warmists use them all the time.
What all these tricks have in common is this: they’re not arguments; they don’t address any of the points we sceptics (or “realists” as we prefer to term ourselves) painstakingly make in article after article, blog after blog; they’re simply rhetorical tropes designed to confuse, obfuscate, distract, wear down, bruise, irritate, hurt, clog up the comments section and give the illusion of moral and intellectual victory. Above all, though, their purpose is to distract from what you might call the climate alarmists’ Polar Bear In The Room: the world stopped warming in 1998, even as CO2 emissions continued to rise; not only that but none of the computer modelers’ doomsday “projections” of runaway climate catastrophe have been even closely matched by observed real world data.
Or, if you prefer to hear this truth served up with world-weary scientific uber-authority, here’s MIT atmospheric physicist Professor Richard Lindzen addressing the House of Commons in February: “Perhaps we should stop accepting the term ‘skeptic’ because ‘skepticism’ implies doubts about a plausible proposition. Current global warming alarm hardly represents a plausible proposition. Twenty years of repetition and escalation of claims does not make it more plausible. Quite the contrary, the failure to improve the cause over 20 years makes the case even less plausible, as does the evidence from Climategate and other instances of overt cheating.”
Ouch!
In the past - till very recently in fact - the powerful, hugely well-funded alarmist lobby has been able to skate over these inconvenient truths by relying on the propaganda techniques outlined above, as well as on the complicity of the political establishment. Not even the Climategate revelations were quite enough to derail the global warming alarmist gravy train.
So what has changed now? One factor, undoubtedly, has been the fall-out from Fakegate or Gleickgate - the failed attempt by prominent environmental activist Peter Gleick to smear the Heartland Institute (the US think tank best known for its annual climate sceptics’ conference) using stolen or faked documents. The attempted smear was bad enough (imagine the media outrage if climate realists had tried something similar!) but where the stunt really backfired was as a consequence of its handling by left-liberal news organisations like the Guardian, the BBC and the New York Times.
All of them leapt into report the story gleefully without bothering to check whether or not it was true. And when evidence began to emerge that it wasn’t true, they compounded their error by seeking to defend Gleick’s duplicity and criminal actions regardless. Numerous left-liberal commentators argued that Gleick was in fact a hero whose crime was entirely justified in seeking to expose the manifest evils of this sinister, right-wing think tank.
Problem was, even this argument wasn’t borne out the facts. As far as environmental think tanks go, Heartland is little more than a Mom & Pop operation, run on the relative shoestring budget of $4.7 million (only a proportion of which goes towards “climate change” issues). Now compare this with the budgets of left-leaning environmentalist pressure groups such as the Sierra Club ($84.8 million), Natural Resources Defense Council ($97 million), or the World Wildlife Fund ($177.7 million). And that’s before you take into account US government spending on climate change issues, which according to calculations by blogger Jo Nova exceeds spending on sceptical science by 3500 to one.
During the last two decades global warming alarmist propaganda has depended on Hitler’s Big Lie principle (whoops: Godwin’s Law. So shoot me). But that principle, as first Hitler discovered and now the AGW lobby is discovering too, is flawed. In fact there are only so many times you can tell a whopping great lie (be it on the solidity of AGW theory or that climate sceptics are lavishly funded by Big Oil) before the people see through it. And once the people discover that they have been consistently lied to (and cheated out of a great deal of money to boot) they don’t like it one bit.
Coming soon - indeed it has already started - is the mother of all backlashes against the AGW alarmism industry. It will happen on lines predicted over a century ago by Gustave Le Bon in his seminal 1895 work, The Crowd.
Le Bon (whose analysis of crowd mentality influenced Freud, Hitler and Mussolini) argued that the secret of demagoguery was to repeat an idea over and over again in order to create a “contagion” which would infect the popular mind and hold the culture in its grip. This is what, until very recently, happened with the global warming religion.
But this contagion can only keep going, Le Bon argues, so long as those spreading it possess “prestige” in the eyes of the mob. Once that “prestige” is lost, the crowd turns brutally against those seers and experts and leaders in whom it once had such faith. Suddenly it sees them for the liars and cheats and manipulators they really are.
This is what is happening now in the great climate debate. Michael “Hockey Stick” Mann’s new book is not selling; George Monbiot is mocked as a conspiracy theorist; the Royal Society’s Sir Paul Nurse climate science ignorance is eviscerated in a report by the Global Warming Policy Foundation; Yale economics professor William D Nordhaus publishes an essay in the New York Review of Books called Why the Global Warming Skeptics Are Wrong - and is almost instantaneously and comprehensively rebutted at Watts Up With That?
The high priests of global warming have lost their prestige. They’re still chanting the same old mantras. But no one’s listening, no one cares.