


OSLO (Reuters) - A cold snap in Greenland in the 12th century may help explain why Viking settlers vanished from the island, scientists said on Monday.
The report, reconstructing temperatures by examining lake sediment cores in west Greenland dating back 5,600 years, also indicated that earlier, pre-historic settlers also had to contend with vicious swings in climate on icy Greenland.
“Climate played (a) big role in Vikings’ disappearance from Greenland,” Brown University in the United States said in a statement of a finding that average temperatures plunged 4 degrees Celsius (7F) in 80 years from about 1100.
Such a shift is roughly the equivalent of the current average temperatures in Edinburgh, Scotland, tumbling to match those in Reykjavik, Iceland. It would be a huge setback to crop and livestock production.
“There is a definite cooling trend in the region right before the Norse disappear,” said William D’Andrea of Brown University, the lead author of the study in the U.S. journal Proceedings of the National Academy of Sciences.
Researchers have scant written or archaeological records to figure out why Viking settlers abandoned colonies on the western side of the island in the mid-1300s and the eastern side in the early 1400s.
Conflicts with indigenous Inuit, a search for better hunting grounds, economic stresses and natural swings in climate, perhaps caused by shifts in the sun’s output or volcanic eruptions, could all be factors.
LITTLE ICE AGE
Scientists have previously suspected that a cooling toward a “Little Ice Age” from the 1400s gradually shortened growing seasons and added to sea ice that hampered sailing links with Iceland or the Nordic nations.
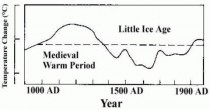
The study, by scientists in the United States and Britain, added the previously unknown 12th century temperature plunge as a possible trigger for the colonies’ demise. Vikings arrived in Greenland in the 980s, during a warm period like the present.
“You have an interval when the summers are long and balmy and you build up the size of your farm, and then suddenly year after year, you go into this cooling trend, and the summers are getting shorter and colder and you can’t make as much hay,” D’Andrea said.
The study also traced even earlier swings in the climate to the rise and fall of pre-historic peoples on Greenland starting with the Saqqaq culture, which thrived from about 4,500 years ago to 2,800 years ago.
Lamb and other climate researchers had shown using many different proxies and recorded historical accounts, this LIA after the Medieval Warm Period. But Mann and Briffa and other erased both using a tree ring proxy data from a few trees in Arizona and on the Yamal peninsula, producing the famous hockey stick. Meanwhile, CO2 Science has confirmed Lamb’s original finding of a MWP using data published by 981 individual scientists from 565 research institutions in 43 different countries!
By Chip Knappenberger
House Energy and Commerce Committee members Henry Waxman (D-Calif.) and Bobby Rush (D-Ill.) have requested a climate-science hearing in light of a just-released report from the National Academy of Sciences (NAS). This report, “America’s Climate Choices,” however, presents no new science.
Instead, as climate scientist Chip Knappenberger explains below, the NAS document lays out a strategy for manufacturing a crisis by exaggerating the climate threat and artificially raising fossil-fuel prices in an effort to compel American’s to emit less greenhouse gases.
Congress has heard all of this before and has been unmoved to pass legislation which will raise the price of living and doing business in America by taxing our primary energies - Editor.
Plentiful and inexpensive fossil fuels are the preferred energy source, whether it be to run your car, heat your home, or generate electricity. Oil, gas, and coal are relatively safe, readily portable, fairly efficient, and relatively energy dense. While fossil fuels perhaps are not the perfect energy source, they do go a long way towards meeting our current needs, and the infrastructure (and know how) is in place to allow for rapid expansion into the future. So, all in all, fossil fuels are pretty darn good now–and as far as the eye can see.
Hydrocarbon supplies are not depleting - just the opposite. New technologies (such as those used for hydraulic fracturing, tar sands, and deepwater drilling) are expanding our ability to retrieve fossil fuels from the earth, As a consequence, the supply is keeping up with the growing demand and more - a demand driven not only a growing population of humans, but a growing number of existing humans who are wanting more energy to improve their standard of living. Julian Simon lives!
But the final report from a just-completed investigative effort from the National Academy of Sciences (NAS) seeks to interrupt and reverse the natural improvement of human ingenuity applied to the master resource. Theirs is a manufactured crisis - and one that elevates concerns over climate change above energy reality and concern over the energy-dependent economy.
There are other forms of crisis however, such as that posed by an existing (or perceived) threat. From such crises, new technologies can emerge faster than they would have otherwise. Take the atomic bomb or the space race as an example.
For fossil fuels, the potential for a threat-based crisis arises from their role in climate change and the possible risks to our health and welfare there from. Alas (for some anyway), climate change does not carry the same sense of threat as, say that of a foreign enemy with its sights set on U.S. soil. So the notion of a climate crisis, either now or in the near future, has been slow to (widely) catch on.
The NAS Strategy
A committee assembled by the National Academy of Sciences (NAS), seeks to remedy that situation.
The final of a series of reports has just been released by the NAS from its America’s Climate Choices project - an effort commissioned by Congress back in 2008 to “investigate and study the serious and sweeping issues relating to global climate change and make recommendations regarding what steps must be taken and what strategies must be adopted in response to global climate change, including the science and technology challenges thereof.”
In their final report, the NAS reveals the need to manufacture a crisis to drive Americans away from their overwhelming reliance on using fossil fuels to meet their energy needs, and lays out a strategy for lawmakers and policy makers to do so.
The NAS strategy is a hybridization of two types of crises. Establish a threat from climate change resulting from our use of fossil fuels, and at the same time simulate a fossil fuel shortage by artificially driving up the price of fossil-fuel based energy.
A sort of 1-2 punch.
The NAS strategy first leads with an uppercut:
Climate change is occurring, is very likely caused by human activities, and poses significant risks for a broad range of human and natural systems. Each additional ton of greenhouse gases emitted commits us to further change and greater risks. In the judgment of the Committee on America’s Climate Choices the environmental, economic, and humanitarian risks of climate change indicate a pressing need for substantial action to limit the magnitude of climate change and to prepare to adapt to its impacts.
And then follows with a roundhouse aimed for the knock-out:
Emission reductions can be achieved in part through expanding current local, state, and regional-level efforts, but analyses suggest that the best way to amplify and accelerate such efforts, and to minimize overall costs (for any given national emissions reduction target), is with a comprehensive, nationally uniform, increasing price on CO2 emissions, with a price trajectory sufficient to drive major investments in energy efficiency and low-carbon technologies. In addition, strategically-targeted complementary policies are needed to ensure progress in key areas of opportunity where market failures and institutional barriers can limit the effectiveness of a carbon pricing system.
Fighting Back
The problems of this strategy are immediately obvious:
1) Not everyone buys into the idea of an impending climate crisis,
2) It is virtually impossible to prove that any actions have alleviated the crisis,
3) It is impossible to even theorize alleviating the crisis from the actions of Americans alone,
4) Not everyone wants the price of their energy to go up.
In fact, currently, there are probably many more Americans who are more concerned with the price that they are paying for gasoline than about trying to manipulate the climate to produce some undocumentable alteration that may or may not have any direct impact on their lives. Sure, the April 26th-28th tornado outbreak was a tragedy, as is the ongoing flooding along the Mississippi river. So too was hurricane Katrina. But the role of anthropogenic climate change in those and every other weather event is largely unknowable. Even more unknowable is the role that any reduction in fossil fuel will play in future climate catastrophes. When the next Cat 4 or 5 hurricane makes direct landfall in Miami (just as one did in 1926 and 1992), what will mankind’s role in the meteorological conditions be and how will that role be influenced by the which type of fuel is used to meet our daily energy needs? Are we to be blamed or credited?
The answer is that it will be impossible to know. As it will be for all future tornado outbreaks, floods, droughts, heat waves, etc.
But the NAS committee sees things this way:
In the committee’s judgment, the risks associated with doing business as usual are a much greater concern than the risks associated with engaging in strong response efforts. This is because many aspects of an “overly ambitious” policy response could be reversed if needed, through subsequent policy change; whereas adverse changes in the climate system are much more difficult (indeed, on the timescale of our lifetimes, may be impossible) to “undo.”
Great. In their opinion, it is easier to fix the economy than it is to fix the climate (not sure that the current Administration would agree). But, in the eyes of many, the economy needs fixing, while the climate may or may not. I would imagine that for the majority of Americans (as well as folks the world over), the former is more pressing than the latter, and likely always will be.
In the opinion of the NAS committee, which is primarily aimed at lawmakers and policymakers, concerns over climate risk should supercede those of risks to the economy.
But other folks get to offer their own opinions to lawmakers and policymakers as well.
Come future elections, I am sure many will be offered to those running for office who have, or have not, taken the NAS recommendations to heart. The outcome will be telling.
By Steve Goddard
As forecast, the misinformation from the Hillary-Nuuk meeting is starting to spill out.

There is rarely if ever any sea ice around Nuuk (red circle below) this time of year. Sea ice around Greenland is right at the 30 year median.
Here is the view in Nuuk this morning.
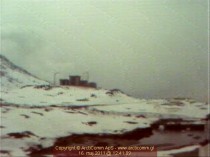
April, 2011 was the third coldest April on record in Nuuk. The cold has continued into May, and is forecast to continue for the rest of the month.
H/T Tom Nelson and Marc Morano.
Also Steve has previously shown:
The Weather Bureau reported ocean temperatures of 15C around Spitzbergen in 1922, and it never froze over that winter. There were no seals because of the warm water.
Walt Meier at NSIDC says that Greenland is not as warm as it was during the 1920s through the 1940s.
The current Greenland warming, while not yet quite matching the temperatures of 70 years ago.
GISS shows the same thing.
By Dr. Roy Spencer
Assuming that the Levitus record of global oceanic heat content increase is anywhere near accurate, what might it tell us about climate sensitivity; e.g., how much global warming we might expect from increasing atmospheric carbon dioxide concentrations? As we will see, the oceans have not warmed nearly as much as would be expected if the climate system really is as sensitive as the IPCC claims.
The following now-familiar plot of ocean heat content change for the surface - 700 meter depth layer is the result of a layer average temperature increase of about 0.17 deg. C over the 55 year record:
In the meantime, global average sea surface temperatures have reportedly increased at about 3.5 times this rate, about 0.6 deg. C, based upon the HadSST2 data.
As Bob Tisdale has pointed out, the above plot expressing heat content in terms of gazillions of Joules sounds dramatic (if you didn’t know, 1022 is 1 gazillion) - but the 0.2 deg. C warming upon which it is based?…maybe not so much.
Nevertheless, what is useful about the heat content data is that it is relatively easy to then calculate from the yearly changes in ocean heat content how much of an energy imbalance (energy flow rate into the ocean) is required to achieve such changes.
This ends up being an average of 0.2 Watts per sq. meter for the 55 year period 1955-2010…a calculation that Levitus also made. Here’s what the yearly energy imbalances look like which are required to cause the yearly changes in ocean heat content:

Note that with considerable smoothing of the data, we see a peak imbalance around 0.6 W m-2 during the maximum warming rate around the year 2000.
Now, by way of comparison, how much radiative forcing does James Hansen (GISS) estimate the climate system has undergone during the same period of time? The following plot shows the various forcings Hansen has assumed:

Let’s assume, for the sake of illustration, that Hansen is correct for all of these forcings. In that case, the average of the all-forcings curve over the period 1955-2010 is about 0.8 W m-2.
Now let’s compare these 2 numbers for the period 1955-2010:
Average Radiative Forcing from CO2, aerosols, volcanoes: 0.8 W m-2
Average Radiative Imbalance from increasing ocean heat content: 0.2 W m-2
Assuming the ocean heat content data and Hansen’s forcing estimates are accurate, how could the average radiative forcing be 4 times the average radiative imbalance? The answer is FEEDBACK:
Radiative Imbalance = Forcing - Feedback
As the system GAINS energy (and warms) from forcing, it LOSES energy from feedbacks: e.g., changes in clouds, water vapor, and most importantly the extra loss of IR energy directly to space from warmer temperatures (which is usually not considered a feedback per se, but it is THE main climate stabilizing influence, and for purposes of discussion I will treat it as a “feedback").
If there was no feedback (which would indicate a borderline unstable climate system), then the ocean heat content-inferred radiative imbalance (0.2 W m-2) would equal the forcing (0.8 W m-2), which it clearly doesn’t since there is a 4x difference.
Of course, some believe that CO2 forcings do not even exist (although I’m not one of them). Here I am simply trying to determine what might be concluded about climate sensitivity if we assume Hansen’s forcings and the OHC increases are correct. As we will see, the large difference between forcing (0.8) and radiative imbalance (0.2) implies an insensitive climate system.
Next, we can use these numbers to estimate the net feedbacks operating in the climate system. The simple time-dependent model of the climate system in this case looks like this:
Cp[dT700/dt] = Forcing - λTsfc
Which computes the change in temperature with time of the 700 m deep ocean layer (dT700/dt) which has a heat capacity of Cp in response to Hansen’s radiative forcings and radiative feedback in response to surface temperature changes (λTsfc).
The reason why we need to use 2 temperatures is that the surface has reportedly warmed about 3.5 times faster than the 0-700 meter ocean layer does, and radiative feedback will be controlled by changes in the temperature of the sea surface and the atmosphere that is convectively coupled to it.
If we run this model, we can adjust the feedback parameter λ until we get the kinds of radiative imbalances inferred from the ocean heat content changes. The following shows what seemed to provide a reasonable match:

The feedback parameter λ used here is 4 W m-2 K-1, which implies a climate sensitivity of only 1 deg. C warming from a doubling of CO2. This is much less than the IPCC’s estimate of 2.5 to 3 deg. C of warming.
In particular, note from the above model simulation how the strong feedback mostly offsets the forcing, leaving a small radiative imbalance, consistent with the large discrepancy between Hansen’s average forcing (0.8 W m-2) and the ocean heat content-inferred energy imbalance (0.2 W m-2).
The bottom line is that the ocean has not warmed nearly as much as would be expected based upon the climate sensitivities exhibited by all of the climate models tracked by the IPCC.
Now, what I do not fully understand is why the IPCC claims that the ocean heat content increases indeed ARE consistent with the climate models, despite the relatively high sensitivity of all of the IPCC models. While some might claim that it is because warming is actually occurring much deeper in the ocean than 700 m, the vertical profiles I have seen suggest warming decreases rapidly with depth, and has been negligible at a depth of 700 m.
Also, note that I have not even addressed any natural sources of warming. If Mother Nature was also involved in the ocean warming during 1955-2010, then this would imply an even LOWER climate sensitivity than I have estimated here.
By James Taylor, Forbes
Catastrophic sea level rise is one of the most valued hole cards played by alarmists in the global warming debate. In An Inconvenient Truth, Al Gore showed computer generated images of what Manhattan would look like if sea level rose 20 feet. Building on this theme, elevation charts of coastal cities have become a staple in global warming presentations by Al Gore wannabes. But what happens when sea level in the real world does not rise nearly as much as alarmists predict? If you are a NASA-funded gatekeeper of sea level data, you merely doctor the data.
Faced with the embarrassing fact that sea level is not rising nearly as much as has been predicted, the University of Colorado’s NASA-funded Sea Level Research Group has announced it will begin adding a nonexistent 0.3 millimeters per year to its Global Mean Sea Level Time Series. As a result, alarmists will be able to present sea level charts asserting an accelerating rise in sea level that is not occurring in the real world.
Human civilization readily adapted to the seven inches of sea level rise that occurred during the twentieth century. Alarmists, however, claim global warming will cause sea level to rise much more rapidly during the present century. United Nations Intergovernmental Panel on Climate Change (IPCC) computer models project approximately 15 inches of sea level rise during the 21st century. That’s more than double the sea level rise that occurred during the twentieth century. A more “mainstream” prediction among alarmists is 3 feet of sea level rise this century. Some alarmists have even projected 20 feet of global sea level rise this century.
Satellite measurements, however, show global sea level rose merely 0.83 inches during the first decade of the 21st century (a pace of just 8 inches for the entire century), and has barely risen at all since 2006. This puts alarmists in the embarrassing position of defending predictions that are not coming true in the real world.
The University of Colorado Sea Level Research Group is coming to their rescue. The NASA-funded group claims glacial melt is removing weight that had been pressing down on land masses, which in turn is causing land mass to rise. This welcome news mitigates sea-level rise from melting glacial ice, meaning sea level will rise less than previously thought. However, it is very inconvenient for alarmist sea level predictions. Therefore, instead of reporting the amount by which sea level is rising in the real world, the Sea Level Research Group has begun adding 0.3 millimeters per year of fictitious sea level rise to “compensate” for rising land mass.
The extra 0.3 millimeters of fictitious sea level rise will add up to 1.2 inches over the course of the 21st century. While this is not monumental in and of itself, it will allow alarmists to paint a dramatically different picture of sea level rise than is occurring in the real world. For example, the current pace of 8 inches of sea level rise for the present century is essentially no different than the 7 inches of sea level rise that occurred last century. However, with an artificially enhanced 9.2 inches of sea level rise, alarmists can claim sea level is rising 31 percent faster than it did last century.
Even under this scenario, sea level is not rising nearly as fast as IPCC and other alarmists have predicted. Nevertheless, a quick Google search of “sea level” and “global warming” shows an overwhelming number of items claiming dramatic and accelerating sea level rise, with very few items reporting that alarmist predictions and computer models are being contradicted by real-world data. The newly adjusted NASA-funded sea level data will merely add fuel to the errant fire.
See also the post by Vincent Gray on the lack of sea level rises in the South Pacific.
Wynne Parry, LiveScience Senior Writer
By failing to take action against global warming, the federal government has violated its legal obligation to protect the atmosphere as a resource that belongs to everyone, according to a lawsuit filed in federal court last week.
Five of the plaintiffs are teenagers, who have a “profound interest in ensuring our climate remains stable enough to ensure their right to a livable future,” according to the suit filed May 4, which names a number of federal officials - from Lisa Jackson, head of the Environmental Protection Agency, to Robert Gates of the Defense Department - as defendants.
The suit cites climate calculations, and is supported by NASA climate scientist James Hansen, who has a history of speaking out forcefully on the hazards of human-caused global warming. Hansen told LiveScience he had been interested in going to court over the topic in recent years.
The suit is based on the Public Trust Doctrine, a long-standing legal doctrine that states it is the government’s duty to protect the resources that are essential for our collective survival and prosperity, such as rivers, groundwater, or in this case, atmosphere, according to Our Children’s Trust, a nonprofit advocacy organization behind the litigation.
“So far politics have governed what governments are doing about the climate crisis, and the Public Trust Doctrine is about putting the science back into climate protection,” said Julia Olson, director of Our Children’s Trust. “And that is what we are asking courts to do.”
The group is behind a number of other lawsuits filed against state governments, including Alaska and Arizona, based on the same legal reasoning and with other young plaintiffs, according to Olson.
“We have kids in Alaska who are seeing their glaciers melting and their homes becoming unstable because of the melting permafrost, and kids in Arizona where it is becoming hotter and drier. … They are already experiencing drought and less ability to grow their own food,” she said. [In Photos: Glaciers Before and After]
The federal lawsuit discusses how the individual teenage plaintiffs have been or will be affected by climate change. For example, if no change is made to our current rate of greenhouse gas emissions, within 16-year-old plaintiff Alec L’s lifetime, sea level is expected to cover the waste water treatment center, the power generating station, the freeway, beaches and hundreds of homes in his hometown, Ventura, Calif.
“Our atmosphere must be returned to equilibrium of less than 350 parts per million (ppm) carbon dioxide to prevent heating beyond 1.8 Fahrenheit (1 Celsius), which scientific analysis deems catastrophic. Our atmosphere is now at approximately 390 ppm,” according to the suit. (Carbon dioxide is the primary greenhouse gas because it is the most abundant and exccess carbon dioxide can remain in the atmosphere for millenia.) [Read: How Two Degrees Will Change Earth]
To meet the 350 ppm goal, carbon dioxide emissions need to peak in 2012 and then decline by a global average of 6 percent per year until 2050 and 5 percent per year until 2100, according to the suit.
If carbon dioxide emissions aren’t reduced in time, the Earth will pass a tipping point with irreversible, catastrophic consequences, including the disintegration of ice sheets and large-scale extinction of species, according to the scientific analysis Hansen provided to the lawsuit.
“If governments fail to adopt policies that cause rapid phase-down of fossil fuel emissions, today’s children, future generations and nature will bear the consequences through no fault of their own,” Hansen and other climate change scientists write in a paper that summarizes the research underpinning the legal argument in the suit.
The public appeal of a suit led by teenagers may be greater than its chance of convincing the court to compel the government to take action, according to Kilaparti Ramakrishna, vice president and director of policy at the Woods Hole Research Center.
“How can you claim a particular impact in Massachusetts or New York is due to what the U.S. government has or has not done,” Ramakrishna said. “It could just as well be what Japan has done or not done, or what China has done or not done.” H/T Ned with comment
high-level officials in the Administration (including leading ‘scientists’ such as Jim Hansen) are using teenagers and the courts as a propaganda tool to force the Congress into taking actions about ‘dangerous climate change’?! This can only be described as a political terrorism ... Since Congress is not likely to pass a Cap
& Trade legislation any time soon, the banking mafia and Wall Street gangsters are using federal officials to put public pressure on it ...and most Americans remain totally oblivious of what the true motivation....is behind such an initiatives.
By Tom Spears, Ottawa Citizen
When your lawn scorches or the geraniums croak, it may be premature to blame global warming. One of the world’s top science journals says climate hasn’t changed in most of North America -yet. In fact, says a study in Science, temperatures in most of North America have resisted the global trend. Elsewhere, the warming has already affected agriculture significantly, reducing yields and causing food inflation.
Scientists from Stanford and Columbia Universities said Canadian and U.S. temperatures since 1980 have changed, but are still within the range of “natural variability” in weather. So in North America, the effects of climate change are practically invisible. A notable exception to the (world’s) warming pattern is the United States,” they write in a study published Friday.
Co-author Wolfram Schlenker of Columbia University in New York City said in an interview that the record is “pretty much identical” in Canada. “Overall I would say it’s pretty much the same story.”
The study deals only with agricultural latitudes, not the Arctic, where scientists are in widespread agreement that warming has begun for real, melting glaciers and sea ice.
In a summary of the work, Science notes “there’s a startling exception to the data (i.e. of global warming): the United States isn’t getting hotter, nor are its crops decreasing. The rapid agricultural changes seen in the rest of the world have not been seen in the United States.”
Science concludes: “The results are a reminder that, while the relationship between crop production and climate change is obvious on a global scale, models that ‘zoom in’ and look at these relationships on a country-bycountry basis won’t necessarily see the same effects.”
David Phillips, Environment Canada’s senior climatologist, says people tend to explain every change in the weather as climate change. “We just seem to gravitate toward the climate change as an explanation for everything that happens.”
Schlenker and David Lobell of Stanford didn’t try to interpret short-terms events such as wildfires in Australia or drought in Russia. “There’s always been variability, so it’s really hard to attribute one single event to climate change,” Schlenker explained. Instead they looked at crop production (wheat, corn, rice, soybeans) during a 29-year stretch through 2008, searching for trends. (They also looked at the 20 years from 1960 to 1980 for comparison, finding no change in that period.)
But from 1980 on, the trend is dramatic, and global -except for North America. The big losers were global corn and wheat production, which fell during the 29-year study period by 3.8 and 5.5 per cent, respectively.
But the findings are not likely to persuade everyone right away. Ernie Small, a senior crop scientist at Agriculture and Agri-Food Canada, notes that some plants flower earlier in spring than they used too, a likely sign of climate change. He also says winters in Ottawa when he was young were “longer, colder, snowier and grimmer” than today.
The multidecadal changes to PDO and AMO drive regimes that last for decades. THe change to a cold PDO and more La Ninas have brought more snow and cold to southern Canada and the northern US the last several years.
By Dr. Matthias Kleespies
Scientists of AMAP, the Arctic Monitoring and Assessment Programme domiciled in Norway, recently published a new study claiming that sea levels might rise by 90 to 160 cm by 2100. These same news was spread by other magazines as well, e. g. “Washington Post” or “Der Spiegel” in Germany, to name only a few.
Although the projected time scale - “by 2100” - does not seem to be too intimidating, the one anxious question always remaining with those presages (I intentionally did not use “forecast” here) is: How much truth do they hold?
To answer this question I would like to use the usual or standard scientific approach as we are dealing with scientists here, aren´t we?: Analyze the claims, analyze the facts, analyze theories and, finally, discuss some alternative theories.
Analysis of (AMAP) claims
In the absence of a better source I will use this NWCN.com article as momentary reference. The article says that “The full report will be delivered to foreign ministers of the eight Arctic nations next week...” which explains why it cannot be found on AMAP’s site yet.
The first and most prominent claim the article starts with is “Arctic ice is melting faster than expected and could raise the average global sea level by as much as five feet this century, an authoritative new report suggests.”
Well done, NWCN. This of course guarantees that almost any reader will take the time to read the full article and will feel relieved there are “friends” warning us of coming threats. A clever but easily understood way of customer retention.
The second claim worth noticing is “The report also shatters some of the forecasts made in 2007 by the U.N.’s expert panel on climate change. The cover of sea ice on the Arctic Ocean, for example, is shrinking faster than projected by the U.N. Panel.”
Who do we believe now? IPCC or AMAP? Did the IPCC lose part of its authority? Why didn´t THEY know in 2007? Did their models fail? Didn’t they have enough data or the wrong data? Why didn´t they have enough or did have the wrong data? If they were failing in such an important field of presage, how credible are they anyway?
Why, in the first instance, is AMAP’s study now more credible than IPCC’s? Do they have better scientists or better models or better data or anything altogether? Why do they compete with IPCC?
Who can we believe and what should we believe?
Then, please read thoroughly, the claim says “The cover of sea ice on the Arctic Ocean, for example, is shrinking faster than projected by the U.N. Panel.”
IS shrinking faster??? The sentence following the “is shrinking” statement says “The level of summer ice coverage has been at or near record lows every year since 2001...”. Aha. “At or near record lows”. Very precise figures. And now, within four years difference between the IPCC and the AMAP study and the very clear finding of “at or near record lows” they know it IS shrinking faster? Now, suddenly, it’s not a presage, or for all I care also a forecast, any more, it’s a fact?
Friends, especially those friends warning us of coming threats: please take your time and understand the little neat difference between a fact and a forecast. And please, please, please, use the appropriate grammar form for forecasts, “would” or “might” or “should” or something alike, but, please, not IS!
“Its assessment also said the U.N. panel was too conservative in estimating how much sea levels will rise—one of the most closely watched aspects of global warming because of the potentially catastrophic impact on coastal cities and island nations.” is one of the next very interesting claims.
Please let me try to translate this: “Too conservative” probably means “too boring”. After 20 years of global warming hype a “too conservative” approach will either not bother anyone or, even worse, will fail to raise more (research) funds as recently became the painful destiny of IPCC.
Now we come to the most important claims finally giving us some precise figures:
“The melting of Arctic glaciers and ice caps, including Greenland’s massive ice sheet, are projected to help raise global sea levels by 35 to 63 inches (90-160 centimeters) by 2100, AMAP said, though it noted that the estimate was highly uncertain. That’s up from a 2007 projection of 7 to 23 inches (19-59 centimeters) by the U.N. panel, which didn’t consider the dynamics of ice caps in the Arctic and Antarctica. “The observed changes in sea ice on the Arctic Ocean, in the mass of the Greenland ice sheet and Arctic ice caps and glaciers over the past 10 years are dramatic and represent an obvious departure from the long-term patterns,” AMAP said in the executive summary.”
Here we have it again: IPCC was too stupid, because they “didn’t consider the dynamics of ice caps in the Arctic and Antarctica.” Or did they perhaps know better and were right in doing their “too conservative” approach? We´ll see. Please be patient. I will shed light on this when discussing the facts and theories.
See much more detail in this excellent critique of yet another so offical science fiction ‘report’ designed to bloster the sagging confidence of the warmists and their fans and to keep the money flowing. See also this quickee analysis of the multi-year ice by Steve Goddard.