


By Kari Lundgren, Bloomberg
Changes to U.K. energy policy may lead to a renewed “dash for gas” as utilities choose cheap gas-fired plants over renewable projects, Parliament’s Energy and Climate Change Select Committee said in a report today.
Government policy needs to “put the cleanest form of energy at the top of the agenda,” Committee Chairman Tim Yeo said in a statement. If the type of capacity is not part of the decision-making process, companies will choose the “cheap and easy” option, the committee said in the report.
The British government is in the process of reshaping the country’s energy market and changing how plants are approved to meet climate change targets and replace aging stations. The U.K. has pledged to get 15 percent of its energy from renewable sources by the end of the decade and about a quarter of the country’s generation capacity will go off line by 2015.
“The first so-called ‘dash for gas’ took place in the 1990s and helped to provide affordable energy, but a second dash for gas could crowd out the development of renewables and make the U.K. miss its climate change targets,” the report said.
Power from a natural gas-fired power plant costs about $54 a megawatt hour to produce, compared with $176 for energy coming from an offshore wind farm, according to Bloomberg New Energy Finance data. A gas-fired power station emits about half as much carbon dioxide as a coal-fired plant.
“Gas plants are one of the solutions to greenhouse emissions, not one of the problems,” Mike Fulwood,an analyst at Nexant, said in a telephone interview. “There are plenty of economies in Europe that have survived on imported gas for many, many years.”
Damhead Creek
Gas-fired power plants can take as little as 18 months to build, Fulwood said. Plants approved since January last year include Scottish Power Ltd.’s 1,000-megawatt plant at Damhead Creek in southeast England and a Wainstones Energy Ltd. plant near Manchester. As many as five applications for combined-cycle gas plants are under consideration, according to the Department of Energy and Climate Change.
The Secretary of State should be required to review plans and take into account what plants have already been approved, the Committee said in the report. This will protect the U.K. from becoming overly dependent on fossil fuels and ensure the country meets climate change targets, they said.
Priscilla Jebaraj, Hindu Times
Physicist U.R. Rao says carbon emission impact is lower than IPCC claim
A key belief of climate science theology - that a reduction in carbon emissions will take care of the bulk of global warming - has been questioned in a scientific paper released by the Environment Ministry on Monday.
Physicist and the former ISRO chairman, U.R. Rao, has calculated that cosmic rays - which, unlike carbon emissions, cannot be controlled by human activity - have a much larger impact on climate change than The Intergovernmental Panel on Climate Change (IPCC) claims.
In fact, the contribution of decreasing cosmic ray activity to climate change is almost 40 per cent, argues Dr. Rao in a paper which has been accepted for publication in Current Science, the preeminent Indian science journal. The IPCC model, on the other hand, says that the contribution of carbon emissions is over 90 per cent.
‘Cosmic ray impact ignored’
Releasing Dr. Rao’s findings as a discussion paper on Thursday, Environment Minister Jairam Ramesh noted that “the impact of cosmic ray intensity on climate change has thus far been largely ignored by the mainstream scientific consensus.” He added that the “unidimensional focus” on carbon emissions by most Western countries put additional pressure on countries like India in international climate negotiations.
The continuing increase in solar activity has caused a 9 per cent decrease in cosmic ray intensity over the last 150 years, which results in less cloud cover, which in turn results in less albedo radiation being reflected back to the space, causing an increase in the Earth’s surface temperature.
While the impact of cosmic rays on climate change has been studied before, Dr. Rao’s paper quantifies their contribution to global warming and concludes that “the future prediction of global warming presented by IPCC’s fourth report requires a relook to take into the effect due to long term changes in the galactic cosmic ray intensity.”
Policy implications
This could have serious policy implications. If human activity cannot influence such a significant cause of climate change as cosmic rays, it could change the kind of pressure put on countries to reduce carbon dioxide emissions.
Mr. Ramesh emphasised that Dr. Rao’s findings would not reduce domestic action on climate change issues, but he admitted that it could influence the atmosphere of international negotiations.
“International climate negotiations are about climate politics. But increasingly, science is becoming the handmaiden of politics,” he said.
In November 2009, Mr. Ramesh had released a report by glaciologist V.K. Raina claiming that Himalayan glaciers are not all retreating at an alarming pace. It had been disputed by many Western scientists, while IPCC chairman R.K. Pachauri dismissed it as “voodoo science.” However, Dr. Raina was later vindicated by the IPCC’s own retraction of its claim that the Himalayan glaciers would melt by 2035.
“Since then, Western Ministers have reduced talk about the glaciers to me, they have stopped using it as frequently as a pressure point for India to come on board,” said Mr. Ramesh.
When Mr. Ramesh sent Dr. Rao’s paper to Dr. Pachauri, he replied that the next IPCC report was paying special attention to the impact of cloud cover on global warming. The Minister expressed hope that Dr. Rao’s findings would be seriously studied by climate researchers.
“There is a groupthink in climate science today. Anyone who raises alternative climate theories is immediately branded as a climate atheist in an atmosphere of climate evangelists,” he said. “Climate science is incredibly more complex than [developed countries] negotiators make it out to be… Climate science should not be driven by the West. We should not always be dependent on outside reports.”
Disputing IPCC claims
According to the latest report by the IPCC, all human activity, including carbon dioxide emissions, contribute 1.6 watts/sq.m to global warming, while other factors such as solar irradiance contribute just 0.12 watts/sq.m.
However, Dr. Rao’s paper calculates that the effect of cosmic rays contributes 1.1 watts/sq.m, taking the total contribution of non-human activity factors to 1.22 watts/sq.m.
This means that increased carbon dioxide emissions in the atmosphere are not as significant as the IPCC claims. Of the total observed global warming of 0.75 degrees Celsius, only 0.42 degrees would be caused by increased carbon dioxide. The rest would be caused by the long term decrease in primary cosmic ray intensity and its effect on low level cloud cover.
This means that predicting future global warming and sea level rise is not as simple as the IPCC makes it to be, since it depends not only on human activity, but also significantly on the unpredictability of cosmic ray intensity.
“We conclude that the contribution to climate change due to the change in galactic cosmic ray intensity is quite significant and needs to be factored into the prediction of global warming and its effect on sea level raise and weather prediction,” says the paper. See post here.
By John M. Broder
Carol M. Browner, the White House coordinator for energy and climate change policy, will leave the administration shortly, officials confirmed Monday night. Her departure is a further sign that the administration is tempering the ambitious goals of President Obama’s first two years in the face of new Republican strength in Congress.

Carol Browner, the White House energy adviser, last August
Ms. Browner, a former administrator of the Environmental Protection Agency, was charged with directing the administration’s effort to enact comprehensive legislation to reduce emissions of climate-altering gases and moving the country away from a dependence on dirty-burning fossil fuels. That effort foundered in Congress last year, and Mr. Obama has acknowledged that no major climate change legislation is likely to pass in the next two years.
No decision has been made on whether she would be replaced or if the position would simply disappear, a White House official said.
“She will stay on as long as necessary to ensure an orderly transition,” a White House official said. “Carol is confident that the mission of her office will remain critical to the president.”
News of her departure was first reported by Politico.
An aide to Ms. Browner said she was proud of her White House accomplishments, including helping to coordinate response to the BP oil spill and fashioning a deal under which automobile fuel efficiency will increase by nearly 25 percent over the next five years. The aide said Ms. Browner was also pleased that Mr. Obama’s State of the Union message would include a strong endorsement of the clean-energy policies she championed.
But she is leaving with her major goals unmet and the E.P.A. - where she served for eight years under President Bill Clinton - under siege by Republicans who believe it is strangling job creation by imposing costly new pollution rules.
In recent weeks there has been speculation that Ms. Browner would be moved to another senior position at the White House, perhaps deputy chief of staff, with a broader portfolio. But with the appointment of William M. Daley as chief of staff, that prospect appeared to evaporate and Ms. Browner was left with the choice of remaining in a relatively low-visibility job or returning to the private sector.
Ms. Browner is known as a savvy navigator of the bureaucracy and a strong voice for environmental protection in a White House that was focused more on health care and the economy. Her departure leaves the administration’s other major environmental and energy policy makers without a strong advocate at the White House.
But in the face of Republican skepticism about climate change and strong opposition to environmental regulation, the administration will be spending more time defending the modest policy gains of the past two years than advancing new proposals.
Scott Segal, an energy expert at Bracewell & Giuliani, a law and lobbying firm in Washington, said Ms. Browner’s leaving might be a sign that the administration would be more sensitive to the concerns of business.
Orange County Register
It is time for an independent investigation of whether or to what degree human activities are creating catastrophic global warming. It should be conducted by scientists untainted by advocacy and uncompromised through receiving taxes or private funding to advance or debunk the theory.
Many in the new Congress were elected on promises to re-evaluate global warming claims used to justify Draconian regulations. A “team of nongovernment and non-U.N. experts must be established with access to all the raw data, records, adjustments, fudges ... and computer codes currently being black-boxed by government scientists,” says Robert Ferguson, president of the nonprofit Science and Public Policy Institute for “sound public policy based on sound science.” We agree.
NASA and the National Oceanic and Atmospheric Administration have resisted Freedom of Information Act requests for release of unadjusted raw data and documentation of their adjustments to them. Good science requires theories be tested.
Even proponents of catastrophic manmade global warming theory say the average global temperature increased 0.7 degrees Celsius over the past century. We must be certain such tiny changes and the cataclysmic predictions based on them are valid before imposing huge economic sacrifices, infringing personal freedoms or levying new taxes.
A good place to start is temperature data. NASA and NOAA, which together receive nearly half a billion dollars a year in tax funding for climate research, “have been systematically fiddling the worldwide temperature record for years, making ‘global warming’ look worse than it is,” according to a new paper by meteorologist Joe D’Aleo, an American Meteorology Society fellow.
“[W]hen data conflicts with models, a small coterie of scientists can be counted upon to modify the data” to agree with models’ projections, says MIT meteorologist Dr. Richard Lindzen.
Research by meteorologist Anthony Watts found that 89 percent of U.S. ground temperature stations do not meet NASA’s standards for distance between stations and adjacent heat sources, seriously compromising readings. That’s before NASA “adjusts” the raw data, adding more significant additional false warming, Mr. Watts says.
“The raw temperature data produced by the ... stations are not sufficiently accurate to use in scientific studies or as a basis for public policy decisions,” he concludes.
Thousands of e-mails leaked in 2009 from Britain’s Climate Research Unit showed researchers lamented the “hapless state” of their temperature records, including “hundreds if not thousands of pairs of dummy and duplicate stations,” and “no uniform data integrity.”
CRU Director Phil Jones later conceded “temperature data are in such disarray they probably cannot be verified or replicated,” bringing into question the U.S. records because, “almost all the data we have in the CRU archive is exactly the same.”
An independent analysis also should be made of climate computer models and the purported cause-and-effect relationships assumed between greenhouse gases and higher temperature, rising sea levels and melting glaciers.
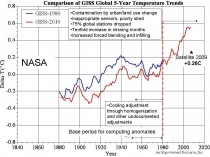
Notice the cooling of the past and elevation of recent years by undocmented adjustments. Enlarged here.
Paper here.
See also this post on Is there Really Evidence for Unprecedented Warming.
By the Inconvenient Skeptic
Based on the most current data it appears that 2010 is going to show the largest drop in global sea level ever recorded in the modern era. Since many followers of global warming believe that the rate of sea level rise is increasing, a significant drop in the global sea level highlights serious flaws in the IPCC projections. The oceans are truly the best indicator of climate. The oceans drive the world’s weather patterns. A drop in the ocean levels in a year that is being cited as proof that the global warming has arrived shows that there is still much to learned. If the ocean levels dropped in 2010, then there is something very wrong with the IPCC projections.
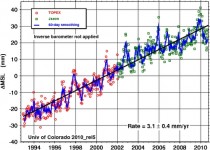
The best source of sea level data is The University of Colorado. Only government bureaucracy could put the sea level data in one of the places farthest from the ocean, but that is where it is. I use both data sets that includes the seasonal signal. So with and without the inverted barometer applied. This is the source of the data that is used to show that the oceans are rising. Of course the rate of rise is greatly exaggerated and if the rate from 1993-2010 is used there will be a 1m rise in the year 2361.
Enlarged here.
Of course the rate is not constant. The rate of rise over the past 5 years has been half the overall rate. At the rate of the past 5 years it will be the year 2774 before the oceans rise a single meter. Of course a decrease in the rate is technically an negative acceleration in the rate of rise, so technically the rate of rise is accelerating, but in a negative direction. That statement is misleading though as most people consider acceleration to be a positive effect.
Sea Level Change
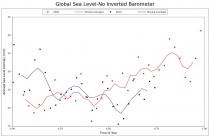
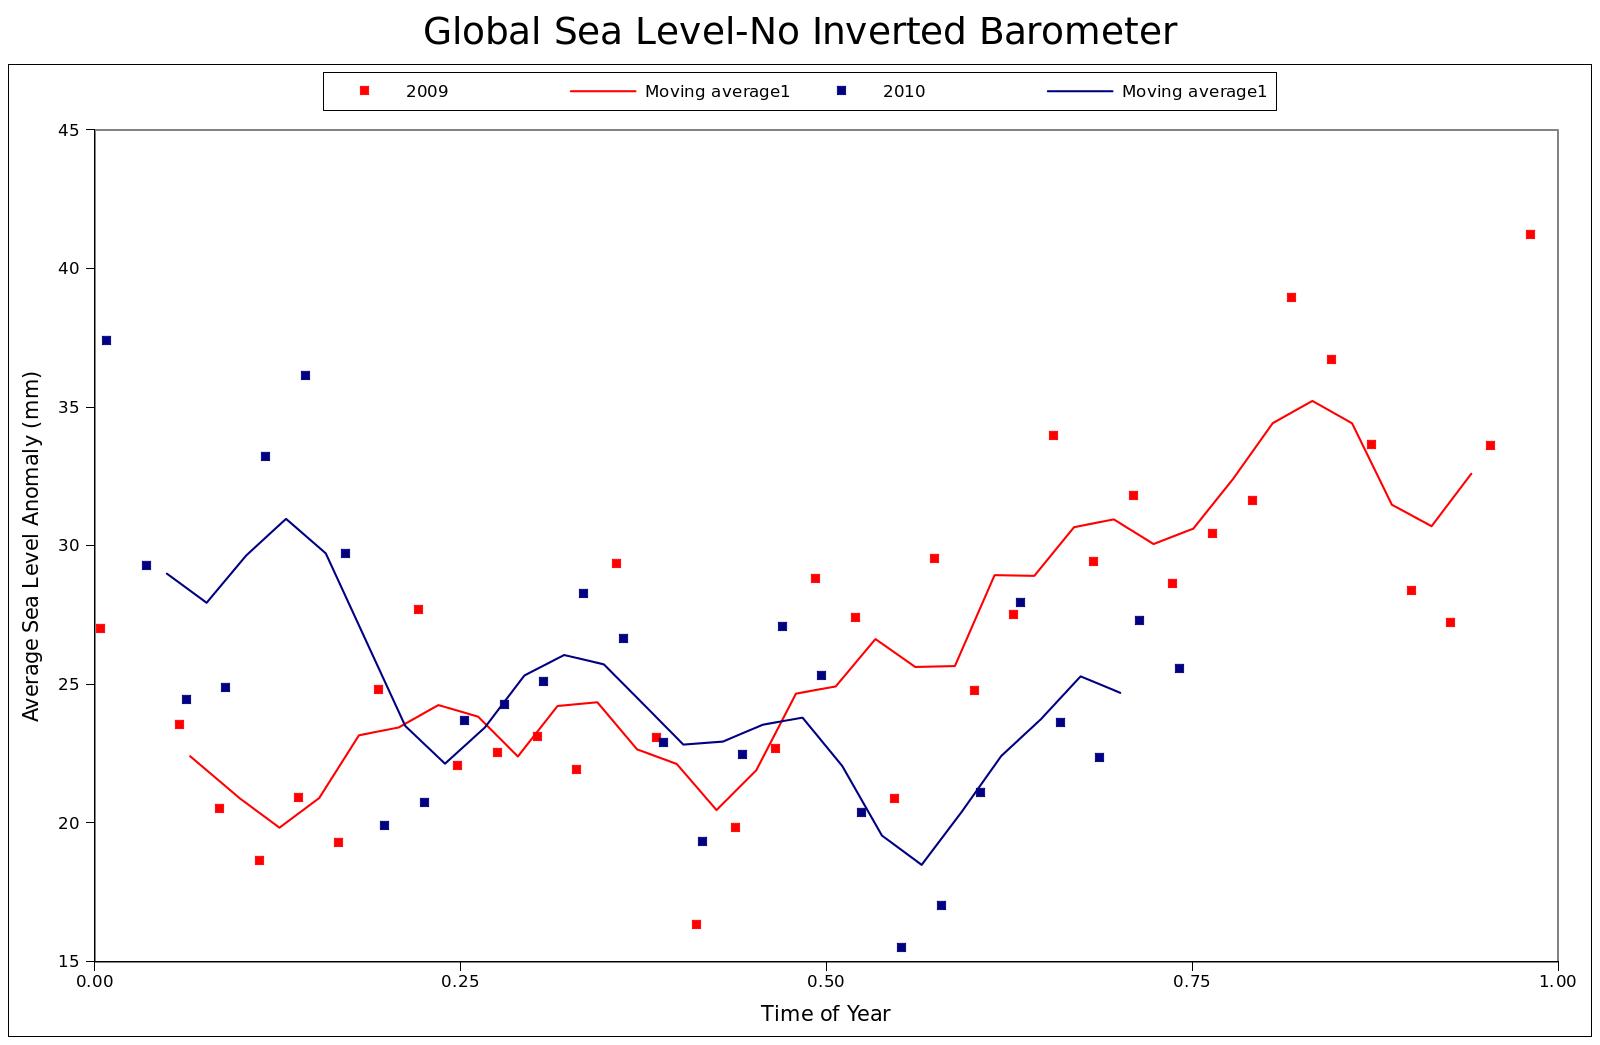
Even more interesting is the fact that from 1992-2005 there was an increase each year. 2006 was the first year to show a drop in the global sea level. 2010 will be the 2nd year to show a decrease in sea level. That is correct, 2 of the past 5 years are going to show a decrease in sea level. 2010 could likely show a significant drop global sea level. By significant I mean it is possible that it will likely drop between 2-3 mm from 2009. Since the data has not been updated since August it is difficult to guess more precisely, but the data ends at the time of year that the seasonal drop begins to show up. If the drop does show up as expected it is possible that 2010 will show the largest drop in sea level ever recorded.
2010 will show a significant drop in sea level from 2009.
Of course what will happen won’t be known until the data for the past 5 months is made available. I have been patiently waiting for the data to be updated for several months now, but I got tired of waiting and decided to put the information I have out there.
One fact is certain. A drop in sea level for 2 of the past 5 years is a strong indicator that a changing sea level is not a great concern. In order for the IPCC prediction to be correct of a 1m increase in sea level by 2100, the rate must be almost 11 mm/yr every year for the next 89 years. Since the rate is dropping, it makes the prediction increasingly unlikely. Not even once in the past 20 years has that rate ever been achieved. The average rate of 2.7 mm/yr is only 25% of the rate needed for the IPCC prediction to be correct.
Enlarged here.
This is yet another serious blow the accuracy of the official IPCC predictions for the coming century. The fact that CO2 levels have been higher in the last 5 years that have the lowest rate of rise than the years with lower CO2 levels is a strong indicator that the claims of CO2 are grossly exaggerated.
CNN Blog
The catastrophic weather events taking place across the globe - from Brazil’s and Australia’s flooding to the Eastern United States’ heavy snowfall - have two likely explanations.
Tony Barnston, lead forecaster at Columbia University’s International Research Institute for Climate and Society, said two phenomena - La Nina and the North Atlantic Oscillation - are likely responsible for the patterns we’re seeing.
Though La Nina is different every time, it can be simply defined as a drop in water temperature in the eastern and central tropical Pacific Ocean. This particular La Nina appeared in July, Barnston said, and will last through spring.
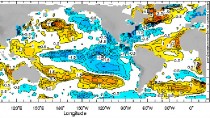
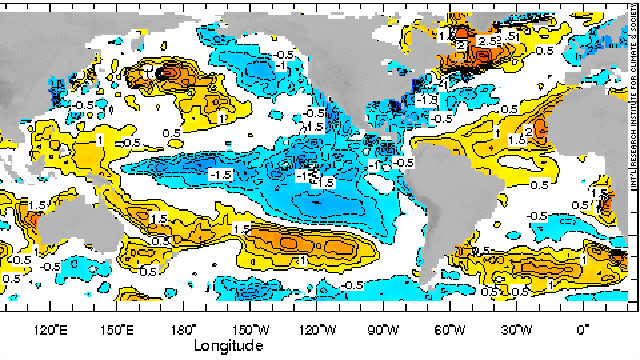
A graphic (enlarged here) outlining sea temperature anomalies the first week in January shows drops in the Pacific as air temperatures rise between the U.S. and Europe (continents in gray). La Nina and the North Atlantic Oscillation are to blame, an expert says.
During La Nina, there is less rainfall in the tropical Pacific and a horseshoe pattern of warm water typically forms in the North Pacific, the coast of Southeast Asia and the seas around Indonesia and Australia (check out the graphic above).
In this case, though, “the whole globe looks to be compensating,” Barnston said, noting that it’s difficult to determine if La Nina spawns individual weather events.
While Southeast Asia and Australia can typically expect warmer oceans and more rainfall during La Nina, the affected area stretches farther west this year and includes Sri Lanka and the southern tip of India, Barnston said.
There is presently a massive rescue operation under way in Sri Lanka to save victims of flooding that has already killed at least 13 people. Floods have killed another 40 people in the Philippines, and Australia reportedly has been inundated with flooding estimated to cover an area the size of France and Germany combined. To the east of La Nina, South America’s north coast has been slammed with rain, and hundreds have been killed in Brazil’s flooding and mudslides.
La Nina usually means warmer temperatures in the United States, particularly the Southeast, but this year the North Atlantic Oscillation is trumping La Nina.
Since November, we have been in the negative phase of the North Atlantic Oscillation, Barnston said, meaning that air temperatures between the eastern U.S. and Europe will drop. This causes temperatures to rise in places like northeast Canada, Greenland and Iceland, as the mercury drops on thermometers in the eastern U.S.
Weather experts call it a see-saw pattern, and it will eventually affect water temperatures, though that’s a secondary effect, Barnston said.
So while La Nina would normally mean dryer, warmer weather for folks in the southern United States, “the North Atlantic Oscillation has superseded the La Nina” this year, bringing El Nino-like winter temperatures and snow to the Southeast” he said.
CNN meteorologists reported earlier this week that snow was present in every U.S. state but Florida.
Though La Nina typically lasts until April or May, the North Atlantic Oscillation can move from a negative to positive phase mid-winter. Barnston said the Southeast “could be warmer and dryer than normal later this year if the North Atlantic Oscillation ceases and desists.” Post is here.
ICECAP Note: Anthony Barnston is a an exceptional seasonal forecaster/researcher formerly with the CPC and now IRI. He nails it here. Note no mention of CO2.
http://icecap.us/images/uploads/t1larg_nao_lanina_weather.jpg
By Matthew Shaffer
A meteorologist has a challenge for climate scientists. Joe Bastardi’s great love is atmospheric science. He says he’s been fascinated by it “since I was a baby. My dad’s a meteorologist, his great-grandfather was the town weatherman in Sicily, and my son wants to be a meteorologist.”
And he’s disturbed by how the science, which he values for its own sake, has been infected with politics. According to Bastardi, the intelligentsia see new weather developments as an “incessant stream of confirmations” of global warming: “I just took out the New York Times from ten years ago, saying the reason it’s not snowing is global warming. Now you’ve got guys in the Times saying the reason it’s snowing is global warming.”
But unlike most climate skeptics, Bastardi is in a position to change the conversation. He’s a meteorologist and forecaster with AccuWeather, and he proposes a wager of sorts. “The scientific approach is you see the other argument, you put forward predictions about where things are going to go, and you test them,” he says. “That is what I have done. I have said the earth will cool .1 to .2 Celsius in the next ten years, according to objective satellite data.” Bastardi’s challenge to his critics - who are legion - is to make their own predictions. And then wait. Climate science, he adds, “is just a big weather forecast.”
What’s his reasoning? Here are some specific topics on which Bastardi disagrees with mainstream climate scientists:
● First, Bastardi thinks climate scientists are too quick to extrapolate from recent trends. “The [Intergovernmental Panel on Climate Change] says this is the warmest decade ever - well, that’s like you wake up every morning and weigh 175 pounds, and one morning you wake up and are 175.1.” In other words, even a decade-long trend could be a random fluctuation, rather than a reflection of long-term changes. He adds, “Here’s the global-warming argument: Given the best data we have, looking at all the solar sets, Milankovitch cycles, and everything else, the earth is about a half degree warmer than it should be. Why is that? Well, where can you stack the answer? Well, it must be man.” That, he thinks, is a conclusion drawn too hastily.
● Second, even when climate scientists do measure long-term trends, they use unreliable methods: “We started using objective satellite data in 1978. When they readjust temperatures, they do it [on numbers that were collected] before the satellite era. Now, how the hell can you make an adjustment on temperatures back in the Thirties when you’re not measuring it the same way now?” He claims tree rings aren’t decisive, either - because it is impossible to isolate the effect of temperature on tree growth. Bastardi prefers historical weather reports, which, in his view, paint a more complex climate history than tree-ring haruspices admit. “I dig into everything I can get my hands on; the historical foundation of climatology is huge,” he says. “There are times when Michelangelo was snowed in to his apartment in Rome, it was so cold over there. Look at the Roman army getting over the Alps. How the heck did they do that? Those mountain passes go up real, real high. If there wasn’t a time of warming in that area, that wouldn’t be possible.”
● Third, Bastardi sees modern climate scientists as inordinately fixated on carbon dioxide at the expense of other major factors (an example of their narrow, model-focused approaches, versus his tendency toward holistic empirical observation). “It’s almost the equivalent of saying, ‘Your big toe runs your body,’” he says. “Carbon dioxide is a trace gas, a tiny gas, part of this huge system. You’re trying to tell me that’s going to control the system and influence the energy of the system? When you have things like the sun, which is obviously the greatest contributor to the world’s energy? It almost defies common sense.”
Those thoughts don’t seem to be motivated by anti-environmental enthusiasm. Bastardi has some concerns about real pollutants: “It’s one thing with sulfur. Sulfur is the type of the thing where it forms a particulate in the air, and it can really screw things up.” But he notes that in recent years, “CO2 is still increasing, and the overall temperature has leveled off.”
● Fourth, Bastardi firmly believes that the climate tends toward equilibrium, not disequilibrium - i.e., when the global temperature moves away from its natural mean, various processes are activated that push it back. This goes against some climatologists’ more dire warnings of a key temperature cutoff beyond which global warming itself accelerates its own process. “See, what they’re afraid of is a feedback tipping point. And I don’t believe in that. Sometimes in the stock market you get to a point where, ‘boom!’ you’re going to go up even further. That’s not how the atmosphere works - for every step it takes away from the norm, the more likely it is to turn back.” He also points to the norming mechanism intrinsic to carbon dioxide’s function: CO2 enables the bigger and faster growth of plants, which then consume CO2.
● Fifth, today’s weather exhibits no unique patterns that require a unique explanation. They’re nothing we haven’t seen before.
● Sixth, and finally, the climate is just really, really complicated. Bastardi takes me through a half-hour of data about warming and cooling trends in the Pacific Ocean, the peculiar weather patterns of the 1930s, solar cycles, volcanic cycles, and the flaws in measurements of global temperatures (a two-degree change in a hot area is much more significant than a two-degree change in a cold area) - all very complicated stuff. And that’s just Bastardi’s point. It’s disingenuous to say we have conclusive proof of the future of such a torturously complicated system.
Is Bastardi credible? As a former humanities major, I am unqualified to judge the arguments behind climate science, and the answer seems to be “no” if you ask the academics who work in the field. But it’s “yes” if you ask the market, and there are plenty of reasons to doubt the current mainstream.
Whereas a significant portion of today’s climate scientists are politically motivated, Bastardi has only one incentive in his job: accuracy. He won’t be denied tenure or publication if he ends up on the wrong side. He gets paid handsomely - he won’t tell me just how much - for long-term weather forecasts by traders who have an interest in commodities whose production is affected by the weather. And he still gets hired, despite his rising to fame and infamy as a global-warming skeptic. His credential, in other words, is that he’s passed the market test: “Because I know the physical drivers of the atmosphere . . . people see me on TV talking about things, but that’s the tip of the iceberg - I get calls from companies when money is on the line. They want the right answer, the best answer, the quickest answer. Do you realize how much money you save if you get the weather right?”
And appeals to academic authority seem misplaced. The politicization and groupthink exposed by the Climategate scandal, the self-selection problem (those already inclined to think of the climate as imperiled are most likely to choose climate science as a field), and the newness and inestimable complexity of the science (climatologists can’t experiment with the weather as, say, a chemist can experiment with chemicals) would all seem to cast doubt on the conclusiveness of today’s climate science.
Bastardi is bearing his cross - “My mom calls me up these days and cries, ‘Who is the Huffington Post and why are they so mean to you?’” he says - but he hates being politically pigeonholed. “People assume ‘this guy’s against alternative energy’ and all that stuff,” he says. “Let me tell you something. If I’m right, we’re going to need all the energy we can get. It’s a lot harder to heat a house than cool it, a lot easier to take clothes off than to put them on. So when it cools, we’ll need a lot more energy.”
Is Bastardi right? An amateur’s answer might depend on his or her skepticism toward environmentalism. But Bastardi has done the thing that could make or break his credibility - offer a way to test his theory. We’ll see if his critics, so certain of the authoritative consensus on global warming, do the same.
Matthew Shaffer is the William F. Buckley Jr. Fellow at the National Review Institute.
Science Daily
ScienceDaily (Dec. 31, 2009) Most of the carbon dioxide emitted by human activity does not remain in the atmosphere, but is instead absorbed by the oceans and terrestrial ecosystems. In fact, only about 45 percent of emitted carbon dioxide stays in the atmosphere.
However, some studies have suggested that the ability of oceans and plants to absorb carbon dioxide recently may have begun to decline and that the airborne fraction of anthropogenic carbon dioxide emissions is therefore beginning to increase.
Many climate models also assume that the airborne fraction will increase. Because understanding of the airborne fraction of carbon dioxide is important for predicting future climate change, it is essential to have accurate knowledge of whether that fraction is changing or will change as emissions increase.
To assess whether the airborne fraction is indeed increasing, Wolfgang Knorr of the Department of Earth Sciences at the University of Bristol reanalyzed available atmospheric carbon dioxide and emissions data since 1850 and considers the uncertainties in the data.
In contradiction to some recent studies, he finds that the airborne fraction of carbon dioxide has not increased either during the past 150 years or during the most recent five decades.

New research finds that the airborne fraction of carbon dioxide has not increased either during the past 150 years or during the most recent five decades, contrary to some recent studies.
The research is published in Geophysical Research Letters.
Journal Reference: Knorr, W. Is the airborne fraction of anthropogenic CO2 emissions increasing? Geophysical Research Letters, 2009; 36 (21): L21710 DOI: 10.1029/2009GL040613
Abstract:
GEOPHYSICAL RESEARCH LETTERS, VOL. 36, L21710, 5 PP., 2009 doi:10.1029/2009GL040613
Is the airborne fraction of anthropogenic CO2 emissions increasing?
Wolfgang Knorr, Department of Earth Sciences, University of Bristol, Bristol, UK
Several recent studies have highlighted the possibility that the oceans and terrestrial ecosystems have started loosing part of their ability to sequester a large proportion of the anthropogenic CO2 emissions. This is an important claim, because so far only about 40% of those emissions have stayed in the atmosphere, which has prevented additional climate change. This study re-examines the available atmospheric CO2 and emissions data including their uncertainties. It is shown that with those uncertainties, the trend in the airborne fraction since 1850 has been 0.7 plus/minus 1.4% per decade, i.e. close to and not significantly different from zero. The analysis further shows that the statistical model of a constant airborne fraction agrees best with the available data if emissions from land use change are scaled down to 82% or less of their original estimates. Despite the predictions of coupled climate-carbon cycle models, no trend in the airborne fraction can be found.