


By S. Fred Singer, President, SEPP
Quote of the Week:
The less a thing is known, the more fervently it is believed— Montaigne
There is a general impression, based on flawed analyses [Oreskes in Science 2004] that scientists support nearly unanimously the so-called scientific consensus on AGW. But more than 31,000 scientists and engineers disagree and have signed a petition that affirms their disbelief in AGW [for a listing of names see pp. 745-855, in Climate Change Reconsidered, available here ].
There is even widespread belief that major scientific societies, like the American Geophysical Union (AGU), have polled their membership before issuing formal Statements which essentially endorse the IPCC conclusion that the temperature rise of the past 50 years has been caused by human activity - and more specifically by the emission of greenhouse (GH) gases. Not so: This false impression seems to be due to a misleading survey result published in an AGU journal [P. Doran and M. Kendall-Zimmerman, Eos 90, 20 Jan 2009, pp 22-23].
We will discuss this survey here and the question of bias and confounding factors.
The Eos authors report the response of 3146 earth scientists to two questions:
1. Has the climate warmed, cooled, or remained constant—compared to pre-1800?
Regardless of what one may believe about the causes of climate change, the answer must be: ‘Warming.’ Pre-1800 refers to the Little Ice Age, which ended around 1800. [If the question were changed to ‘compared to 1998,’ then the answer would be ‘Cooling.’]
2. Do you think human activity is a significant factor in changing global mean temperature?
Here the answer will depend on what is meant by ‘significant’—and whether ‘human activity’ should include urbanization, land changes, agriculture, irrigation, deforestation, etc. Many might answer ‘Yes’ - even if they don’t think that GH gases are a significant factor in climate change.
The authors report that their selection involved faculty in relevant academic departments and employees of government establishments. Presumably, they did not include retirees or those in the private sector. The authors claim that known dissenters were included. But my casual inquiries did not find anyone who participated.
Most of the responders described themselves as geochemists; only 5% claimed to be ‘climate scientists.’ (But where are the ‘atmospheric scientists’?) The widely quoted result of the survey is a 97.4% ‘Yes’ to question #2; it is based on a sample of only 77 responses from ‘actively publishing climate scientists.’ Disregarding the claimed accuracy, what can we deduce from this response? That these are likely individuals who derive large research grants and contracts from a federal budget that almost exclusively supports research designed to affirm AGW.
[Of this same group, only 96.2% (rather than 100%) thought that the climate had warmed since 1800. It would be interesting to learn who these individuals are.] By contrast, on question #2, less than half of ‘economic geologists’ (103 responses) said ‘Yes’ and slightly more than one-third of ‘meteorologists’ (36 responses) said ‘No.’
The American Physical Society (APS) in 2007 published a position statement enthusiastically endorsing AGW, without reference to the views of its members. Recently, some 200 APS members and Fellows have petitioned the APS Council to change or withdraw the Statement, in view of scientific evidence that is counter to AGW. Perhaps there will develop a similar initiative within the AGU.

See larger image here.
See SEPP Newsletter here.
By Roger Pielke Sr., Climate Science
The Guardian has embraced the notion of planting CO2 consuming Eucalyptus trees in the desert in this story.

Roger Pielke Sr. was asked to comment on the plan. He responded in this blog post, Comments On Len Ornstein’s Post “How To Quickly Lower Climate Risks, At ‘Tolerable’ Costs?”.
On October 26 2009 Len Ornstein posted a guest weblog titled “How To Quickly Lower Climate Risks, At ‘Tolerable’ Costs?”. He has requested that I comment on his proposal to reduce carbon dioxide concentrations in the atmosphere.
As I have written previously, I am very concerned about geoengineering as a way to mitigate climate change from the addition of CO2 and other greenhouse gases; e.g. see
Comments On The Physics Today Article “Will Desperate Climates Call for Desperate Geoengineering Measures?” by Barbara Goss Levi.
I wrote in that post
The claim in the Levi Physics Today article that geoengineering “intervention” [can] prevent or slow changes in the climate system is completely wrong. Geoengineering would cause changes in the climate system! The Levi focus almost exclusively on the role of the addition of carbon dioxide into the atmosphere is blind to the importance of altering the spatial pattern of climate forcing as a result of geoengineering.
I do find that Len’s study further confirms the role of landscape change (in this case deliberate change) as a first order climate forcing. However, this means that weather patterns will be altered since the spatial distribution of diabatic heating in the atmosphere will be different (e.g. see also our study of this diabatic heating effect due to aerosols in Matsui and Pielke 2006). The teleconnection effect seen in their model runs seem muted at very long distance (e.g. see Figure 5) but they are present. For example, there is a possible effect on Atlantic hurricanes, as noted in Section 6 of Ornstein et al. This raises the issue of unintended consequences. With respect to Atlantic tropical cyclones, these bring much needed rain to the western tropical and subtropical Atlantic Ocean land areas as well as the southeast USA. If this is altered, as suggested in the model results, this would be an unintended negative effect to those countries.
I do agree with Len on the concern on the biogeochemical effect of added atmospheric concentrations of CO2. We do not know all of the potential effects, but there will be some. Thus the elevation of CO2 to too high a concentration should be prevented, and the engineering of Len’s proposal seems feasible. However, as written above, unintended consequences on the climate elsewhere would need to be very thoroughly studied.
I remain convinced that the mitigation approach with the least negative effects is the air capture of CO2 as discussed in
Pielke, Jr., R. A., 2009. An Idealized Assessment of the Economics of Air Capture of Carbon Dioxide in Mitigation Policy, Environmental Science & Policy, Vol. 12, Issue 3, pp. 216-225. Read more here.
By Anthony Watts, Watts Up with That
Hadley CRU isn’t the only government agency that deletes web content related to climate. NOAA/NWS Southern Region Headquarters has gotten into the act. An interesting thing happened today. NOAA deleted an educational web page about an experiment you can do with CO2.
Ordinarily such a thing would go unnoticed, especially since it doesn’t impact anything particularly important like policy, or climate data. It’s just an experiment for kids in the classroom.
Fortunately, I still had the web page open in my browser. I had been looking at it yesterday, and I had been thinking I might try the experiment myself with a datalogging thermometer, just for fun.
Here’s the web page as it was open in my browser.

You can try it out for yourself now here.
What could cause NOAA to pull a web page like this on a moment’s notice?
Two things.
1 It was featured on Climate Depot yesterday.
2 It had this passage that must not have agreed with somebody higher up in the NOAA food chain:
It has been thought that an increase in carbon dioxide will lead to global warming. While carbon dioxide in the atmosphere has been increasing over the past 100 years, there is no evidence that it is causing an increase in global temperatures.
Or maybe it was this one:
The behavior of the atmosphere is extremely complex. Therefore, discovering the validity of global warming is complex as well. How much effect will the increase in carbon dioxide will have is unclear or even if we recognize the effects of any increase.
So rather than corrupt young minds with a simple science experiment with some inconvenient language attached to it, NOAA simply deleted it. Of course nothing is really deleted on the Internet anymore. NOAA looks pretty silly thinking it would go away with a simple delete.
The Wayback machine has the missing web page for posterity here.
Now it looks like I’ll have to run their simple experiment. Stay tuned.
By Richard S Courtney
Friends:
Climate change is a serious problem and all governments - national and local - need to address it. Climate has always changed everywhere and always will: this has been known since the Bronze Age when it was pointed out to Pharaoh by Joseph (the one with the Technicolour Dreamcoat). Joseph told Pharaoh to prepare for the bad times when in the good times, and all sensible governments have adopted that policy throughout the thousands of years since then.
That tried and tested policy is sensible because people merely complain at taxes in the good times, but they will revolt if they are short of food in the bad times. But in 1990 several governments decided to abandon that policy and, instead, to try to stabilize the climate of the entire Earth by controlling it. The UK started that policy and intends to continue it. Many governments of many countries are doing the same. This attempt at global climate control arises from the hypothesis of anthropogenic (that is, man-made) global warming (AGW). AGW does not pose a global crisis but the policy of attempted global climate control does. AGW is a political issue. It is not a scientific issue.
AGW induced the ‘Earth Summit’ in Rio de Janeiro in 1992 and the Kyoto Summit in Japan in 1997. Both these events were attended by several Heads of State. And now we are confronted with CoP15; the fifteenth Conference of the nations that have signed the UN’s Framework Convention on Climate Change. CoP15 is to be held in Copenhagen in December and it, too, will be inundated by Heads of State. Scientists attend scientific meetings. Politicians attend political meetings. I will deal with what is likely to happen at Cop15 (which I call the No-Hope-In-Hagen Conference), but first I want to discuss AGW so we know what the real problem is. AGW has become the State Religion in many paces, notably the European Union. There may be some here who doubt AGW has become the State Religion. They need look no further than their television screens. The UK government is spending 6 million pounds of our money on an advertisement that proclaims AGW is a horror story with which to frighten little children. According to that government advertisement, children are to be taught the future is not an opportunity for them to grow up into: it is a place of horrors where their pets are drowned and their homes are to be destroyed. Teaching that to children is child abuse.
I repeat that AGW does not pose a global crisis but the policy of attempted global climate control does. And not merely because it is a tool to give children nightmares. The policy threatens constraint of the use of fossil fuels and that constraint would kill millions - probably billions - of people. The use of fossil fuels has done more to benefit human kind than anything else since the invention of agriculture. Most of us would not be here if it were not for the use of fossil fuels because all human activity is enabled by energy supply and limited by material science. Energy supply enables the growing of crops, the making of tools and their use to mine for minerals, and to build, and to provide goods, and to provide services.
Material Science limits what can be done with the energy. A steel plough share is better than a wooden one. Ability to etch silica permits the making of acceptably reliable computers. And so on. People die without energy and the ability to use it. They die because they lack food, or housing, or clothing to protect from the elements, or heating to survive cold, or cooling to survive heat, or medical provisions, or transport to move goods and services from where they are produced to where they are needed. And people who lack energy are poor so they die from pollution, too.
For example, traffic pollution has been dramatically reduced by adoption of fossil fuels. On average each day in 1855 more than 50 tons of horse excrement was removed from only one street, Oxford Street in London. The mess, smell, insects and disease were awful everywhere. By 1900 every ceiling of every room in Britain had sticky paper hanging from it to catch the flies. Old buildings still have scrapers by their doors to remove some of the pollution from shoes before entering. Affluence reduces pollution. Rich people can afford sewers, toilets, clean drinking water and clean air. Poor people have more important things they must spend all they have to get. So, people with wealth can afford to reduce pollution but others cannot. Pollution in North America and Europe was greater in 1900 than in 2000 despite much larger populations in 2000. And the pollution now experienced every day by billions who do not have the wealth of Americans and Europeans includes cooking in a mud hut using wood and dung as fuel when they cannot afford a chimney.
The use of fossil fuels has provided that affluence for the developed world. The developing world needs the affluence provided by the development which is only possible at present by using fossil fuels. We gained our wealth and our population by means of that use. The energy supply increased immensely when the greater energy intensity in fossil fuels became available by use of the steam engine. Animal power, wind power and solar power were abandoned because the laws of physics do not allow them to provide as much energy as can be easily obtained from using fossil fuels.
The greater energy supply enabled more people to live and the human population exploded. Our population has now reached about 6.6 billion and it is still rising. All estimates are that the human population will peak at about 9 billion people near the middle of this century. That additional more than 2 billion people in the next few decades needs additional energy supply to survive. The only methods to provide that additional energy supply at present are nuclear power and fossil fuels. And the use of nuclear power is limited because some activities are difficult to achieve by getting energy from the end of a wire.
If anybody here doubts this then I tell them to ask a farmer what his production would be if he had to replace his tractor with a horse or a Sinclair C5. So, holding the use of fossil fuels at its present level would kill at least 2 billion people, mostly children. And reducing the use of fossil fuels would kill more millions, possibly billions. That is not an opinion. It is not a prediction. It is not a projection. It is a certain and undeniable fact. Holding the use of fossil fuels at their present levels would kill billions of people, mostly children. Reducing the use of fossil fuels would kill more millions or billions. Improving energy efficiency will not solve that because it has been known since the nineteenth century that improved energy efficiency increases energy use: as many subsequent studies have confirmed.
So, in a period of a few decades we have moved from the tried and tested climate policy that has stood the test of time since the Bronze Age, and we have replaced it with quasi-religious political madness which - if not stopped - will pale into insignificance the combined activities of Ghengis Khan, Adolf Hitler and Pol Pot. How did we get into this mess? It came about because governments have adopted the AGW hypothesis. But that hypothesis always was implausible and it is now known to be wrong. Read much more why in this excellent story here.
By Kevin Williams, Rochester Daily Record
On Oct. 10, U.S. Energy Secretary Steven Chu addressed a University of Rochester homecoming audience on global warming and energy conservation. Dr. Chu is the gentleman who, according to the Wall Street Journal, likened the American public to ‘teenage kids” because citizens aren’t behaving the way they should in terms of dealing with climate change.
In his Rochester address, Chu said anyone is entitled to his or her own opinion on climate change, but not to his or her own facts. Is Chu himself playing loose with the facts? In an April address at the Summit of the Americas in Port-Of-Spain, Trinidad and Tobago, Chu said “another 1 degree increase [in the global average temperature] was certain to occur and there’s a reasonable probability we can go above 4 degrees Centigrade to and 6 more.”
He then warned of inundation of coastal areas due to sea level rises, according to Fox News. Really? Given that the Earth’s average temperature actually has fallen slightly since 1998, defying all global climate models, makes one wonder who is trying to “own” the facts? How can anyone be certain if and when significant warming will resume? Yet we do know that, despite apocalyptic predictions of rising seas from Al Gore and others, sea level rises have been slight and far below computer model projections.
Nevermind that solar scientists are suggesting recent spot-free sun may be pushing us toward longer term cooling as experienced during the Dalton Minimum in the late 1700s. (Visit this site for more on that.)
Regardless, in Rochester Chu suggested we all need to drive smaller cars and paint our roofs white in order to stop global warming. The theory is that white roofs would reflect sunlight and small cars would reduce the burning of fossil fuels. That made me wonder. In the 1970s, when a new ice age was predicted by current global warming alarmist and Stanford professor Steve Schneider - and many others - would Chu have recommended we all drive massive trucks and paint our roofs black to stave off the coming chill?
I also wonder if Chu accidentally gave a talk geared to a city in the South. After all, Rochester is not exactly known for incurring withering heat waves, and consumes far more energy in heating our homes than cooling them.
When it came to the idea of driving small cars, Chu did not offer a suggestion for what a large family would be expected to drive. He is, not surprisingly, in favor of the cap-and-trade legislation now before Congress, arguing it will create new jobs. How many jobs would we lose along the way? In Spain, according to a study by the Universidad Rey Juan Carlos, the implementation of green technologies has created only one new green job for every 2.2 non-green jobs eliminated.
Chu admitted that dealing with global warming would take some getting used to, and cost money, but that Americans could rise to the occasion.
I think he, like many others in Washington, have totally misread the American people. Poll after poll has shown global warming is not a priority with Americans. Improving the economy is. As I plan to address in my next column, with prospects growing for a colder-than-normal winter in major population centers in the United States and Eurasia, how ironic - and arrogant - it would be for our political leaders to pass legislation to protect us from imagined global warming while allowing still more jobs to be lost.
Kevin Williams is president of weather-track.com and director of meteorology for News 10NBC.
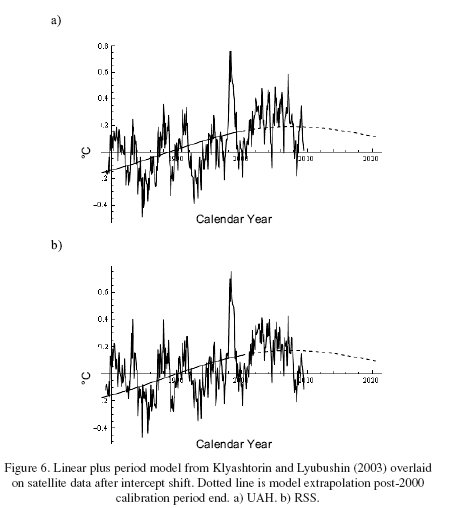
By Craig Loehle, Energy and Environment, 2009
Global satellite data is analyzed for temperature trends for the period January 1979 through June 2009. Beginning and ending segments show a cooling trend, while the middle segment evinces a warming trend. The past 12 to 13 years show cooling using both satellite data sets, with lower confidence limits that do not exclude a negative trend until 16 years. It is shown that several published studies have predicted cooling in this time frame. One of these models is extrapolated from its 2000 calibration end date and shows a good match to the satellite data, with a projection of continued cooling for several more decades.
INTRODUCTION
Temperature trends provide critical evidence for evaluating claims regarding anthropogenic climate change. On the one hand, models project continued warming (e.g., Hansen et al., 2006). On the other, it has been argued that Earth’s weather should be expected to exhibit long-term persistence (LTP) at some scale (Cohn and Lins, 2005; Easterling and Wehner, 2009; Wood, 2008). LTP could at any given time give a false impression of the strength of anthropogenic effects by adding a warming trend to an existing anthropogenic signal, or it could act to counter such signal for some period of years or decades. Thus it is critical to examine climate history data at multiple scales to evaluate these effects. Typical trend studies, however, have not evaluated the most recent decades per se.
METHODS
The purpose of the analysis is to examine the data for linear trends. Looking backward from the most recent dates, the question is what is the temperature trend over recent years? If it is negative (cooling), how long can a cooling trend be said to have existed? Starting at the beginning of the record in 1979 and looking forward, how long a record is needed before a warming trend is detectable? Starting with intervals in the middle of the record, how does the trend in this middle interval compare to the starting and ending periods? Linear trends are the simplest way to assess climate change, and are used in the IPCC reports and most of the trend studies cited in the introduction, among many others. Linear trends also have the advantage that confidence intervals are well defined, which aids in interpretation. Calculating such linear trends overcomes issues due to subjective interpretation of noisy data and the arbitrariness of various methods of smoothing the data, especially at the end points (see Soon et al., 2004). By showing trends of data segments of multiple lengths, issues of the studied interval being unduly influential are avoided.
Longer-term trends (or red noise) are graphically uncovered by the analysis, if they exist, and are not being estimated per se. Instead the questions are strictly empirical: how much has it warmed/cooled over various lengths of time, according to satellite data? University of Alabama at Huntsville (UAH) and Remote Sensing Systems (RSS) Microwave Sounding Unit (MSU) data were obtained on July 20, 2009.

See larger image here.
CONCLUSIONS
Analysis of the satellite data shows a statistically significant cooling trend for the past 12 to 13 years, with it not being possible to reject a flat trend (0 slope) for 16 years. This is a length of time at which disagreement with climate models can no longer be attributed to simple LTP. On the other hand, studies cited herein have documented a 50-70 year cycle of climate oscillations overlaid on a simple linear warming trend since the mid-1800’s and have used this model to forecast cooling beginning between 2001 and 2010, a prediction that seems to be upheld by the satellite and ocean heat content data. Other studies made this same prediction of transition to cooling based on solar activity indices or from ocean circulation regime changes. In contrast, the climate models predict the recent flat to cooling trend only as a rare stochastic event. The linear warming trend in these models that is obtained by subtracting the 60-70 yr cycle, while unexplained at present, is clearly inconsistent with climate model predictions because it begins too soon (before greenhouse gases were elevated) and does not accelerate as greenhouse gases continue to accumulate. This model and the empirical evidence for recent cooling thus provide a challenge to climate model accuracy.
See full PDF here.
By Nils-Axel Morner, Leader of the Maldives Sea Level Project
Mr. President,
You have recently held an undersea Cabinet meeting to raise awareness of the idea that global sea level is rising and hence threatens to drown the Maldives. This proposition is not founded in observational facts and true scientific judgements, Accordingly it is incorrect. Therefore, I am most surprised at your action and must protest to its intended message.
In 2001, when our research group found overwhelming evidence that sea level was by no means in a rising mode in the Maldives, but had remained quite stable for the last 30 years, I thought it would not be respectful to the fine people of the Maldives if I were to return home and present our results in international fora. Therefore, I announced this happy news during an interview for your local TV station. However, your predecessor as president censored and stopped the broadcast.
When you became president, I was hoping both for democracy and for dialogue. However, I have written to you twice without reply. Your people ought not to have to suffer a constant claim that there is no future for them on their own islands. This terrible message is deeply inappropriate, since it is founded not upon reality but upon an imported concept, which lacks scientific justification and is thus untenable. There is simply no rational basis for it. Let me summarize a few facts (see Fig. 1, and evidence presented in Morner, 2007):
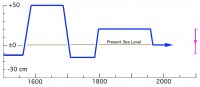
(1) In the last 2000 years, sea level has oscillated with 5 peaks reaching 0.6 to 1.2 m above the present sea level.
(2) From 1790 to 1970 sea level was about 20 cm higher than today.
(3) In the 1970s, sea level fell by about 20 cm to its present level.
(4) Sea level has remained stable for the last 30 years, implying that there are no traces of any alarming on-going sea level rise.
(5) Therefore, we are able to free the Maldives (and the rest of low-lying coasts and island around the globe) from the condemnation of becoming flooded in the near future.
When I was president for the INQUA commission on Sea Level Changes and Coastal Evolution (1999-2003), we spent much effort on the question of present-to-future sea level changes. After intensive field studies, deliberation within the commission and discussions at five international meeting, we agreed on a “best estimate” for possible sea level changes by the year 2100. Our figure was +10 cm plus/minus 10 cm. This figure was later revised at +5 cm plus/minus 15 cm (as given in Fig. 1). Such changes would imply small to negligible effects.
From our sea level curve in Fig. 1, we can directly see that such a small rise would pose no threat for the Maldives. Rather, it would be a natural return to the conditions existing from 1790 to 1970; i.e. to the position before the sea level fall in the 1970s. The same non-rising sea level story is recorded for all other areas claimed to be under a flooding already in progress; viz. Tuvalu, Vanuatu and Venice (Morner, 2007b). Besides, the proposed global trend derived from satellite altimetry have been tampered by a “personal correction” in order to create a rising trend (Morner, 2008), actually not measured.
Thermal expansion of the water column may affect the ocean level by some centimetres to a decimetre. At the shore, however, the effect is zero (Morner, 2000, 2005a, 2009a). Fig. 1. The Maldives Sea Level Curve of the last 500 years (blue) and the proposed best estimate of possible sea level changes by year 2100 (violet). This curve is a detail (without error bars, anchor points and curved breaking points) from the one presented by Morner, (2007). Sea level has been stable for the last 30 years. Future changes in the next century are by no means alarming; at the most it would imply a return to the pre-1970 situation with an about 20 cm higher sea level as was the case from 1790 to 1970. These are the observational facts and the consequences to face for the future: i.e. no real problems and certainly no reason for any alarm and SOS message.
So, Mr. President, when you ignore to face available observational facts, refuses a normal democratic dialogue, and continue to menace your people with the imaginary threat of a disastrous flooding already in progress, I think you are doing a serious mistake. Let us be constructive. Let us discuss available observational facts. Let us continue and extend our sea level project to new sites in the huge Maldivian atoll archipelago. And let us, for Heaven’s sake, lift the terrible psychological burden that you and your predecessor have placed upon the shoulders of all people in the Maldives, who are now living with the imagined threat that flooding will soon drive them from their homes, a wholly false notion that is nothing but an armchair fiction artificially constructed by mere computer modelling constantly proven wrong by meticulous real-world observations. Your cabinet meeting under the water is nothing but a misdirected gimmick or PR stunt. Al Gore is a master in such cheep techniques. But such misconduct is dishonest, unproductive and certainly most un-scientific.
Authors Laurie Williams and Allen Zabel, career employees of the Environmental Protection Agency who support instituting a carbon fee to address climate change, examine what they call the “Acid Rain Myth.” As the authors explain, “those who champion using cap-and-trade to address climate change claim that it has been ‘proven’ to work in the U.S. Acid Rain program. However, this assertion ignores crucial distinctions between the challenges we faced in 1990 with Acid Rain and the challenges we face today with global warming.”
As the following highlights from the study make abundantly clear, the experience of the Acid Rain program simply cannot be compared to cap and trade for GHG:
“Most importantly, the success of the Acid Rain program did not depend on replacing the vast majority of our existing energy infrastructure with new infrastructure in a relatively short time.”
“Nor did it depend on spurring major innovation. Rather, the Acid Rain program was successful as a mechanism to guide existing facilities to undertake a fuel switch to a readily available substitute, the low sulfur coal in Wyoming’s Powder River Basin.”
“Existing facilities needed only the addition of a few new railway lines, burner modifications to accommodate lower sulfur fuel, and, in some cases, new or more efficient scrubbers. Little new technology or infrastructure was needed and little was created.”
“The goal of the Acid Rain program was to reduce sulfur dioxide emissions, while keeping the cost of energy from coal low. To be effective, climate change legislation must do the opposite; it must gradually increase the relative price of energy from coal and other fossil fuels to create the appropriate incentives for both conservation and the scale-up of clean energy.”
“Further, the Acid Rain program did not allow any outside offsets and so provides no basis for the widespread assumption that an offset program will help with climate change. In addition, the success of the program was aided by the low, competitive price of low-sulfur coal.”
“According to Professor Don Munton, author of ‘Dispelling the Myths of the Acid Rain Story’ the impact of the program has been overstated: The potential for a massive switch to low sulfur coal was no secret. Such coal was cheap and available, and it became cheaper and more available throughout the 1980s. Indeed, low-sulfur coal became very competitive with high-sulfur supplied well before the Clean Air Act became law.”
In an attempt to undercut numerous economic analyses showing cap-and-trade of the greenhouse gas variety destroying jobs and raising energy prices, cap-and-trade supporters note the industry’s so-called “doomsday” cost estimates of the Acid Rain program in 1990. As two Senators recently wrote in the Washington Post, “Naysayers said the cost to business [from the Acid Rain program] would be more than $50 billion a year, but health and other benefits outweighed the costs 40 to 1.”
The $50 billion figure cited above is surely an eye-opener. And it would be a powerful rhetorical weapon were it not for the fact that it’s incorrect and misleading. The $50 billion figure was the cost estimate for all six titles of the Clean Air Act amendments, not for the Acid Rain program (Title IV) alone. In fact, according to “The Cost of Reducing SO2 (It’s Higher Than You Think),” a 1998 article in Public Utilities Fortnightly by Jeremy Platt, Denny Ellerman, and Anne Smith, power sector and EPA estimates of the cost of the Acid Rain program were not dramatically different. According to the article, industry estimated the cost of the Acid Rain program to be somewhere between $4.7 and $6.6 billion, not $50 billion. As for EPA, the agency said the range was $2.6 to $6.0 billion.