


Express UK
THE debate about climate change is finished because it has been categorically proved NOT to exist, one of the world’s leading meteorologists has claimed.
John Coleman, who co-founded the Weather Channel, shocked academics by insisting the theory of man-made climate change was no longer scientifically credible.
Instead, what ‘little evidence’ there is for rising global temperatures points to a ‘natural phenomenon’ within a developing eco-system.
In an open letter attacking the Intergovernmental Panel on Climate Change, he wrote: “The ocean is not rising significantly.The polar ice is increasing, not melting away. Polar Bears are increasing in number.”
“Heat waves have actually diminished, not increased. There is not an uptick in the number or strength of storms (in fact storms are diminishing).”
“I have studied this topic seriously for years. It has become a political and environment agenda item, but the science is not valid.”
I have studied climate change seriously for years. It has become a political and environment agenda item, but the science is not valid.
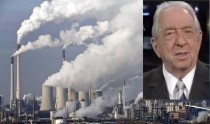
John Coleman, co-founder of the Weather Channel
Mr Coleman said he based many of his views on the findings of the NIPCC, a non-governmental international body of scientists aimed at offering an ‘independent second opinion of the evidence reviewed by the IPCC.’
He added: “There is no significant man-made global warming at this time, there has been none in the past and there is no reason to fear any in the future.
“Efforts to prove the theory that carbon dioxide is a significant greenhouse gas and pollutant causing significant warming or weather effects have failed.
“There has been no warming over 18 years.”
The IPCC argue their research shows that man-made global warming will lead to extreme weather events becoming more frequent and unpredictable.
US News and World Report noted that many of the world’s largest businesses, including Coke, Pepsi, Walmart, Nestle, Mars, Monsanto, Kellogg, General Mills, Microsoft, and IBM, “are now engaged and actively responding to climate science and data.”
Mr Coleman’s comments come as President Barack Obama came under fire from climatologists as federal data revealed The United State’s energy-related carbon pollution rose 2.5 per cent despite the President’s pledges to decrease it.
President Obama told 120 world leaders at the United Nations climate summit last month that America had done more under his watch in cutting greenhouse gases than any other country.
Despite this, the Energy Information Administration’s Monthly Energy Review showed an increase in the use of energy from coal.
World leaders have pledged to keep the global average temperature from rising two degrees Celsius above pre-industrial levels to prevent the worst consequences of climate change.
The US, along with the UK and other developed countries, is expected to pledge further actions on climate change early next year.
Global warming climate change lieThere has been no recorded global warming for 18 years [GETTY]
Climate expert William Happer, from Princeton University, supported Mr Coleman’s claims.
He added: “No chemical compound in the atmosphere has a worse reputation than CO2, thanks to the single-minded demonisation of this natural and essential atmospheric gas by advocates of government control and energy production.”
“The incredible list of supposed horrors that increasing carbon dioxide will bring the world is pure belief disguised as science.”
In 2010 a high-level inquiry by the InterAcademy Council found there was “little evidence” to support the IPCC’s claims about global warming.
It also said the panel had purposely emphasised the negative impacts of climate change and made “substantive findings” based on little proof.
Dr. William Happer at the Marshall Institute
On October 15, 2014 Dr. William Happer, Chairman of the George C. Marshall Institute, discussed “The Myth of Carbon Pollution.”
“Carbon pollution” is a propaganda slogan for the campaign against carbon dioxide (CO2). It is not science. Atmospheric CO2 is not a pollutant but is essential for plant growth. Current CO2 levels are far below optimum for most plants, and far below norms of geological history, when CO2 concentrations averaged several times higher than present values. A substantial fraction, about 15%, of current world food production is due to the higher levels of CO2 compared to preindustrial values. Contrary to unambiguous computer predictions, there has been no statistically significant surface warming in at least 15 years. It is now clear that the warming potential of CO2 has been exaggerated by a large amount, and it is unlikely to be much more than 1oC for doubling of CO2. There is not the slightest evidence that more CO2 has caused more extreme weather or accelerated sea level rise. Nor is there the slightest support for the notion that government control of CO2 will “stop climate change.” Many real environmental issues need attention, smog, waste disposal, short-sighted suburban development, adequate clean water, public health, etc. These are being overshadowed by the phony issue of “carbon pollution.”
Dr. William Happer is Cyrus Fogg Brackett Professor of Physics (emeritus) at Princeton University, a long-term member of the JASON advisory group, and former director of the Department of Energy’s Office of Science. In addition to being a fellow of the American Physical Society and the American Association for the Advancement of Science, he is a member of the National Academy of Sciences and the recipient of numerous awards, including the Alfred P. Sloan fellowship, the Alexander von Humboldt award, the Herbert P. Broida Prize and the Thomas Alva Edison patent award.
Dr. Happer’s Powerpoint presentation is available here.
-----------
Marshall’s Dr. William O’Keefe leads a panel on the so-called “Social Cost of Climate”.
Hans Kurr
INDIAN LAKE (NY) WEATHER
In 1900, long before talk of “climate change,” or, per recent presidential re-branding, “climate disruption,” high & low temps started being tracked by Indian Lake Dam keepers. They’re still at it, and their findings may surprise: Hottest-ever at our Dam - to this day free of Urban Heat Island asphalt, cars, heat ducts & tall buildings - was way back in 1911, not the 1990’s, let alone more recently.
All that water in our lake (March 1913 peak: 43.2 billion gallons/167.4 B liters; Feb. 1948 low: 1.5 B gal./5.8 B lit.) greatly moderates nearby air temperature. Hot days naturally get hotter far from shore. On clear, windless nights lake-warmed air stays put, while the air chills out in sheltered valleys away from the lake. The same moderating effect is at work in winter: Water warmth filters up ("sublimates") even through ice.
Point is, you’re in the mountains, on a ball of dirt called Earth unevenly warmed by the rather petite star it keeps circling. What goes ‘round, comes ‘round, so, as you venture afield, in whatever season you’re visiting us, be ready for encores of the “disruption” our star-performer months have staged. Illustrative highlights for these “Fab Five” are next, then their day-by-day readings.
January 1994
A ho-hum opener, then two days of mini-thaw, gave way to one of the most relentless & extreme North Country assaults our Dam and guests have ever braved: 23 mornings at 0F/-18C or lower, 2 days entirely below zero F plus two consecutive -35F/-37C marks, counterpointed in less than 24 hours by a staggering 78F/43C slingshot up to 43F/+6C.
February 1979
At Camp Driftwood, Jon Voorhees notched a tad under -50F/-45.6C (not “wind-chill"), paralleling the -52F/-46.7C with which Old Forge (western Adirondacks) tied the NY State all-time low, first set February 1934 at Stillwater Reservoir (near Old Forge). The frozen battery wouldn’t let Jon start his car, so, hands aching, he extracted the battery, hauled it down to the office and thawed it out. Hours later, sure of triumph at last, he painfully put it back in and did start the car...only to discover the transmission oil was frozen so hard, the gears refused to engage. Game over: Nature wins again.
July 1962
Back then, soon after the Voorhees Family had taken over Camp Driftwood, cabins still were primitive: no hot water, no showers, no central shower, toilet access from back porches. Week-long a.m. 30’s at the Dam, starting with 32F/0C [20’s/-2 to -6 in the usual-suspect valleys], drove one disgruntled camper to coin a new Driftwood motto: “Dirty people freezing!”
July 1911
Soaring from 42F/5.6C to 89/31.6, day one signaled history aborning. Four 100F/37.8C-or-more scorchers followed, including our Dam’s highest-ever-recorded 103F/39.4C. Extreme stayed the theme: Lake-side lows crashed to low 40’s (near +5C) in week #3 and 38F/3.3C on the 27th, with Big Brook & Cedar River valleys hitting 33F/0.6C to 29/-1C, then rebounding to 95F/35C at month’s end.
February 1908
This roller-coaster soon plunged to -42F/-41.1C, lowest ever recorded at the Dam, rocketed 77F in under 24 hours to 35F/+1.6C, plummeted within a day back to -22F/-30C, soared in 24 hours back up to 35F, racked up more thaw highs for the whole week following, stayed above freezing all day the 15th and even vaulted to 48F/8.9C that afternoon...only to crater again, to -23F/-30.6C.
See the PDF for the table.
See Han’s Climate Fables vs Climate Facts here.
Watts Up With That
Anthony Watts
WUWT has previously covered a press release from The OAS on the paper, now, Mike Smith, a CCM at WeatherData Inc. writes at Meteorological Musings:
Another Shabby Attempt to Tie Increased Tornadoes to Global Warming
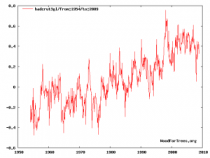
The paper, Tornado Activity is Occurring Earlier in the Heart of “Tornado Alley” brings up some interesting points about the peak of tornado season occurring earlier in the spring in the conventional “tornado alley” of the Great Plains. The paper is an attempt to link global warming to a change in tornado season between 1954 and 2009. Its primary conclusions appear sound. That result is not surprising given the rise in global temperatures during that period of time (see graph).
My objections are not with the primary thrust of the paper. It appears to be a useful addition to the literature.
My objection is the paper’s attempt to make the change in the time of the peak tornado season into something sinister. For example, the first sentence in the paper (it appears in the Abstract) is,
“Tornado frequency may increase as the factors that contribute to severe convection are altered by a changing climate.”
It also says,
“The lack of evidence is due in part to sampling effort: the number of reported tornadoes has increased over time [Dixon et al., 2011].”
The reference to Dixon has to do with Dixie tornado alley, not the one in the Great Plains.
So, let’s go through this yet again. Let’s begin with all tornadoes of F-1 intensity or greater:
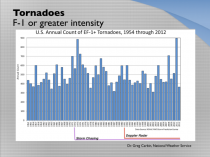
Enlarged tornado-frequency-from-1954
Even though world temperatures have risen, there is absolutely no upward trend in tornadoes. This is especially surprising given the storm chase program that started in 1972 and Doppler radar installations beginning in 1991. There are many small tornadoes that now get into the books that never would have been recorded a half-century ago.
Mike has further graphs and analysis here: Another Shabby Attempt to Tie Increased Tornadoes to Global Warming
I suggest you bookmark his website, and may I recommend his book Warnings: The true story of how science tamed the weather.

I’ve read it, and I’ve lived and experienced much of what he’s written about in the quest to make forecasting, especially severe weather forecasting, more accurate, timely, and specific. For those of us that prefer practical approaches over the rampant speculation on mere wisps of connections to climate, this book is for you.

Derek Alker shared Chuck Wiese's photo.
September 22 at 6:01am
OH YES, you are very, very STUPID love.
BECAUSE there is no greenhouse effect. It IS imaginary. You believe in a pseudo science based upon a falsified paradigm that is ONLY politically correct Climate has always, and always will change perfectly naturally. Belief in homocentric global
warming is, and will be remembered as the largest mass "mistake" in human history.The vast majority of man made climate change believers -
1) Do not even know what, nor have never looked at what the greenhouse effect "theory" is.
2) Do not know what the scientific method is, or who is supposed to use it, what it is supposed to be used for, nor when to use it.Answers to the two statements above
1) For those that have not looked up what the greenhouse effect "theory" actually is, and why it is currently taught in the deliberate stepped manner it is, then this link might be helpful.
2) The scientific method is for ALL. It is inclusive, it is NOT exclusive. It is so “we” the people can check what the “experts” tell us is so, and so that the scientists have a structure by which they can work together.
The scientific method is five very simple stages -
i) Observation - We observe something, preferably with empirical data / measurements.
ii) Hypothesis - Hunch to explain observation.
iii) Experiment - The hypothesis makes predictions of what will happen, these can be tested by experiment.
iv) Theory - IF the experiments confirm the hypothesis, then an explanation has been proven.
HOWEVER, at every stage the proposer must try to disprove his / her own hypothesis and experiment. ALSO, all work associated with observation, hypothesis, and experiment should be made available for all, so they can check too.
v) Law - This is when a theory has “passed” the scientific method, no one can show anything of significance wrong with it. BUT, even Laws, in the scientific method are not above question. As Lord Huxley stated many years ago,
“It only takes one ugly fact to destroy the beautiful theory.”
Science and the scientific method IS never ending, it is open and includes ALL. Anyone who says differently does not understand science, AND is not being scientific. In short, the scientific method is to protect the scientists from making mistakes, and to protect the people from being conned by incompetent, or dishonest science and scientists. This explains WHY so many who believe in the current politically correct pseudo science of homocentric global warming “Theory”, do not understand science, and are usually politically motivated too. This is because man made global warming, is, and always was a politically motivated subject / agenda / movement, by which to control us all, under a one world government headed by the United Nations and the green agenda. ALL, absolutely ALL “justified” by the pseudo science of the greenhouse effect “theory”, that IS a failed hypothesis, according to the scientific method. If only more people understood and practiced the scientific method then there would not be so many STUPID people about....
---------
Paul Dreisen adds this:
The “people’s climate march” is over, but memories linger on - especially those of wealthy Hollywood and other elites who used the occasion to demand that other people change their lifestyles, to protect the planet from over-hyped “catastrophic manmade climate change.”
It was a close call, but my favorite marcher on New York City’s Avenue of the Self-Righteous, however, was Robert F. Kennedy, Jr. He thinks people like me “should be in jail… with all the other war criminals” - for the “crime” of effectively explaining that humans are not causing “dangerous global warming"… that climate change is natural ... and that the policies advocated by Mr. Kennedy and his anti-capitalist comrades are the real threat to the world]s poor and downtrodden.
If there are going to be climate-related trials, I suggest, perhaps they should focus on the alarmists who are perpetuating so much energy-deprivation, poverty, misery, disease and early death in so many countries.
Read his full comments here.
NOAA has claimed “The August global sea surface temperature was 0.65C (1.17F) above the 20th century average of 16.4C (61.4F). This record high departure from average not only beats the previous August record set in 2005 by 0.08C (0.14F), but also beats the previous all-time record set just two months ago in June 2014 by 0.03C (0.05F).” The peak warmth is in the Gulf of Alaska again (join us at WB to see why this will have a major impact on the winter in the US again).
_thumb.png)
Enlarged. Weatherbell.com satellite ocean temperature anomaly imagery.
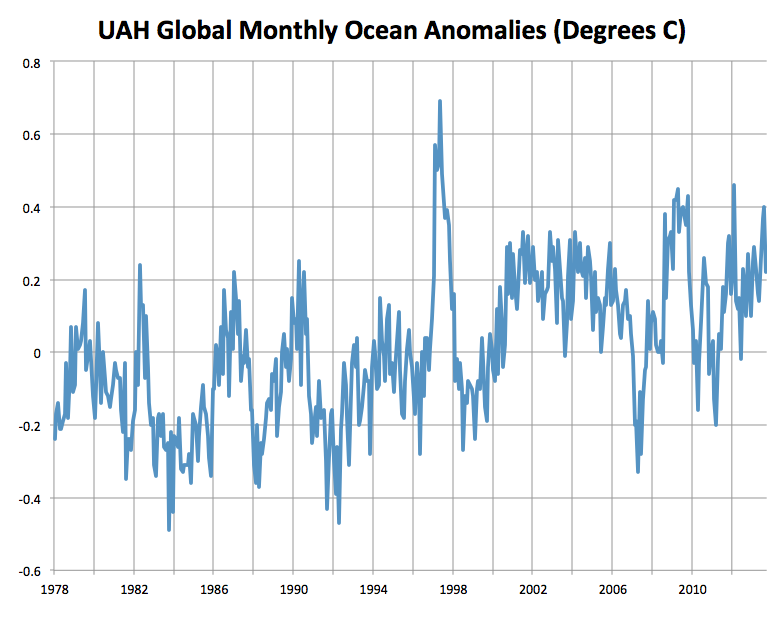
UAH satellite derived SSTAs show it was just +0.22C globally over the oceans. There were 73 months warmer with the warmest +0.69C in May 1998 (nearly half degree celsius warmer than August).

.png)
Are Record Ocean Surface Temperatures Due to Record Low Wind Speeds?
September 18th, 2014 by Roy W. Spencer, Ph. D.
The fortuitous revelation of record warm sea surface temperatures in August, only days before Climate Summit 2014, begs the question - why?
Why were SSTs so warm? (Not “Why announce it just before Leonardo DiCaprio’s coronation?")
As readers here know, I follow the “ocean products” produced by RSS from the SSM/I and SSMIS satellite sensors, and a curious thing has been shaping up in the last few years.
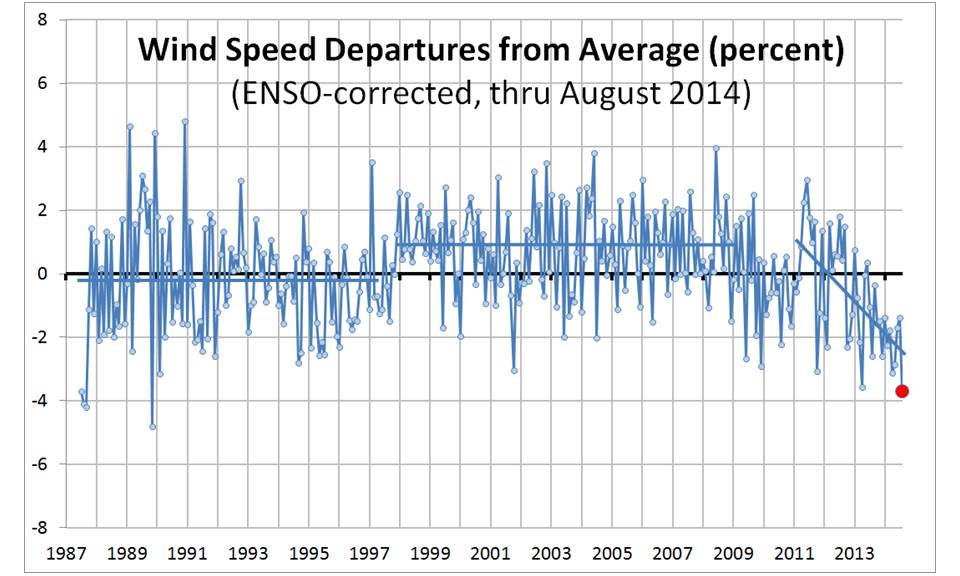
Global average ocean surface wind speeds have been decreasing. In fact, August 2014 had the lowest surface wind speed in about 25 years.
Even after I correct for the typically lower wind speeds that occur with El Nino approaching (-0.5 m/s wind decrease per unit Multivariate ENSO Index value), it’s still at near a record-low since the satellite record began:
Enlarged.
SSM/I and SSMIS monthly global ocean average surface wind speed anomalies.
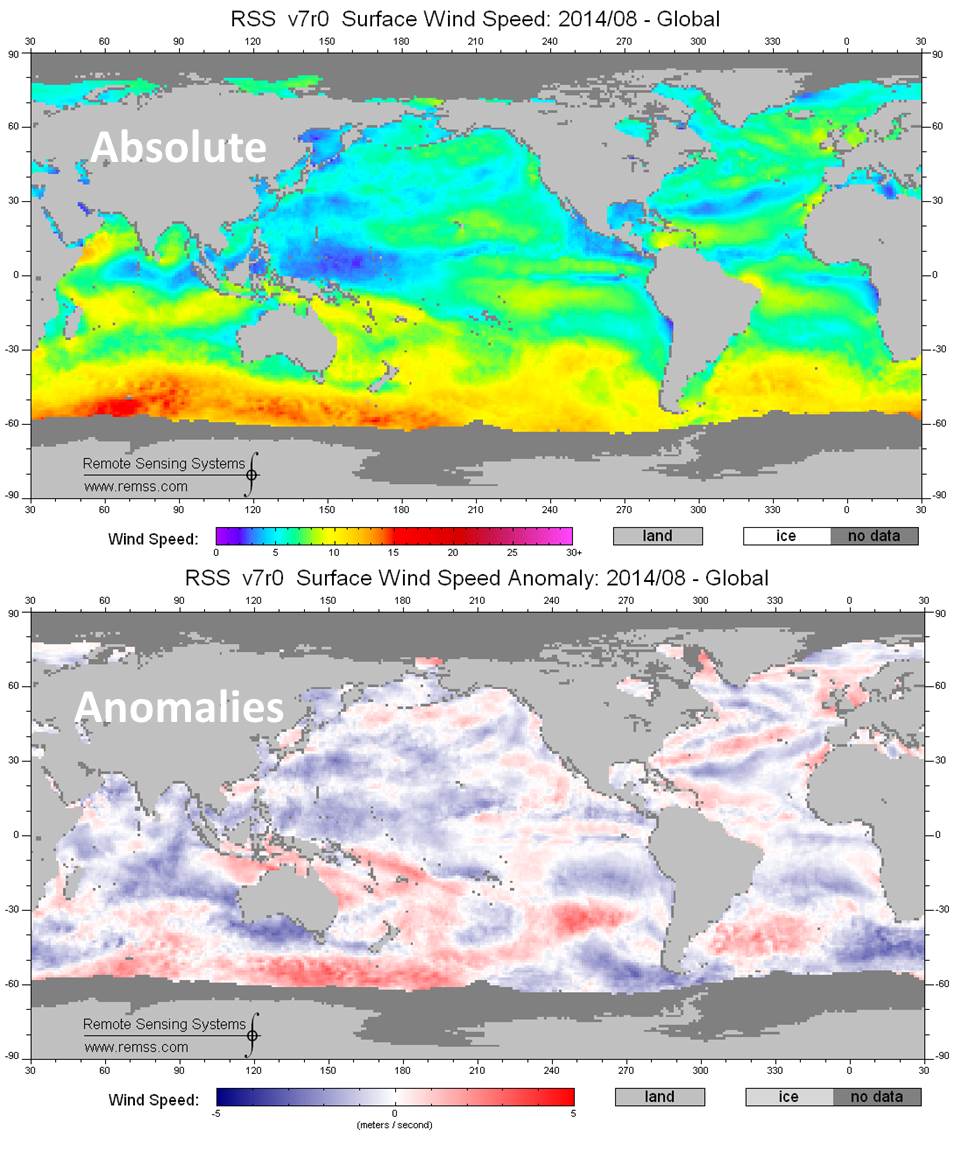
For those wondering what these wind fields look like, here are the average gridpoint wind speeds for August (1 m/sec is about 2 knots), both as absolute values and as anomalies (departures from the mean):
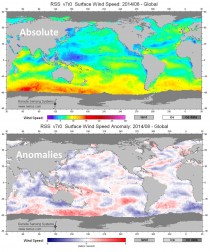
Enlarged.
Grid point ocean surface wind speeds from SSMIS in August 2014, shown as absolute values and anomalies.
Gridpoint ocean surface wind speeds from SSMIS in August 2014, shown as absolute values and anomalies.
Why is Wind Speed Important to SST?
Wind-driven evaporation is the largest source of heat loss from water bodies, including the global oceans. Assuming a global average rate of ocean surface heat loss of 90 W/m2 (which is mostly evaporative), the August value of about 4-5% below the long-term average would mean about 4 W/m2 less cooling of the ocean surface.
Importantly, this 4 W/m2 reduction in heat loss is LARGER than the supposed anthropogenic radiative forcing of about 2.3 W/m2, the IPCC’s RCP6 current radiative forcing value. (The true radiative imbalance is actually less than that because warming has offset some of it with increase IR emission to space). The net result that the wind speed effect is probably at least 4 times the anthropogenic effect.
So, what’s my point? Natural variations in all kinds of things are going on, including a reduction in wind-driven evaporation, which likely contributed to “record warm” SSTs in August.
I have no strong opinions of why the reduction in wind speeds is occurring. Usually the best guess in climate is that it’s part of some cycle that will reverse itself at some point. Only time will tell.
---------
The Curious Case of Record August Ocean Temperatures
September 19th, 2014 by Roy W. Spencer, Ph. D.
Several people have noted the apparent mis-match between the NCDC report of all-time record warmth of global average sea surface temperatures in August, and the satellite tropospheric temperatures which are nowhere near a record.
But, as I have cautioned, there tends to be a time lag between SST warming and atmospheric warming...typically 1 month during non-ENSO conditions, and 2-3 months during ENSO. Furthermore, tropospheric temperature variations are somewhat larger than the SST variations that drive them, making direct comparison of the numbers more difficult.
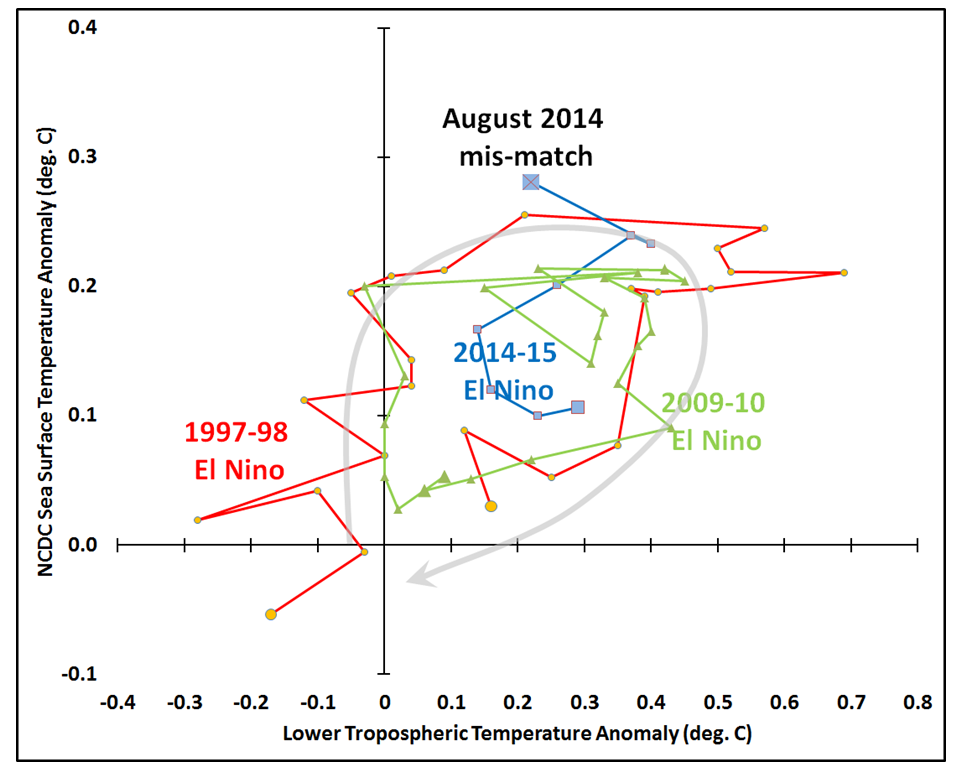
You can get around both of these problems by plotting one versus the other on a graph to see if the latest behavior departs from the normal relationship previously displayed by the two variables (ocean surface temperature and oceanic lower tropospheric temperature).
If you also “connect the dots”, you get what’s called a phase space diagram. If we make such a plot for the 1997-98 super-El Nino, the 2009-10 El Nino, and the current (still weak) El Nino, it looks like this:
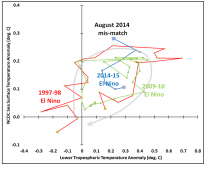
Enlarged Phase space plot of monthly sea surface temperature versus tropospheric temperature anomalies for three El Nino events.
Phase space plot of monthly sea surface temperature versus tropospheric temperature anomalies for three El Nino events (all begin in January, anomalies are relative to 1981-2010 averages).
The time lag of tropospheric temperature behind ocean surface temperature causes a curved trajectory in the data, as I’ve indicated with the light gray line.
What is interesting is that the “record warm” SST month of August, 2014 seems to be an outlier, with the SSTs being too warm (or the tropospheric temperatures too cool) compared to the usual behavior.
Barring some mistake in data processing, the only explanation I have for this is the possibility I blogged about yesterday, that near-record low ocean winds are allowing excessive surface warming while transferring less energy through convection to warm the troposphere. As I also mentioned yesterday, such an excursion would be due to natural variability...not due to “extra” carbon dioxide in the atmosphere, which basically remains unchanged from one month to the next.
Argus
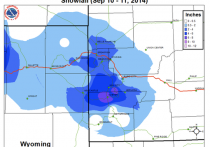
An early September winter storm in the Black Hills has dumped up to 8 inches of snow in the area, while Rapid City received its earliest snowfall in more than 120 years.
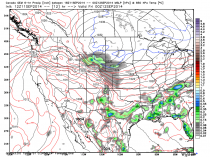
Image from WeatherBELL.com - Canadian GEM forecast ENLARGED
Jon Chamberlain, meteorologist with the National Weather Service in Rapid City, said almost 1 inch of snow had fallen in downtown Rapid City by 8:30 a.m. while 2 inches was measured in higher elevations in town.
The snowfall in downtown Rapid City is the earliest in the city since 1888, the NWS said. The previous early snowfall mark was seven-tenths of an inch on Sept. 13, 1970.
Chamberlain said while it is unusual for Rapid City to see snowfall this early, it isn’t for the Black Hills.
“It’s a little on the high side, though,” he said.
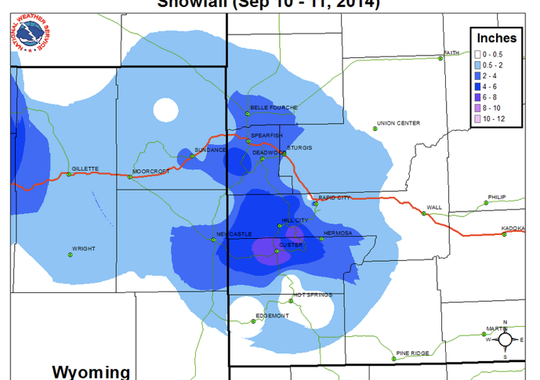
Downtown Custer reported 8 inches of snow, while 7 inches was reported at Mount Rushmore. Other snowfall totals: 6 inches five miles south of Hill City; 4,5 inches in HIll City and 4 inches in Sundance, Wyo.
Chamberlain said roads in the Black Hills are staying relatively snow-free because the snow is melting once it hits the pavement and ground.
A winter storm warning is in effect until noon Mountain time Thursday for the northern and central Black Hills including the cities of Lead, Deadwood, Hill City and Mount Rushmore.
Screen Shot 2014-09-11 at 12.40.45 PM
Preliminary snowfall total map for the Black Hills area.(Photo: NWS) ENLARGED
The NWS says many areas across far western South Dakota might experience a hard freeze by Friday morning as temperatures are expected to dip into the 20s and even teens in the Black Hills.

Antony Watts
That now failed headline is from Duncan Clark in the Guardian.
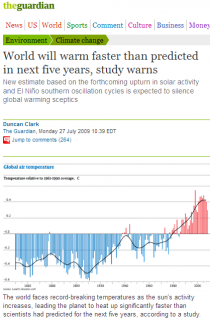
And, for good measure he added:
Just a few small problems there:
Climategate gave skeptics a worldwide voice and stage
Actual temperature has been flat, not increasing
Actual solar activity has been far lower than predicted, not increasing
What El Nino?
Let’s take them one by one.
1. Climategate: I’ll give Duncan this one, nobody could have predicted this event, even though many skeptics had been correctly predicting that behind the scenes there was a lot of “team collusion” going on, which was laid bare for all to see. See our WUWT Climategate section here.
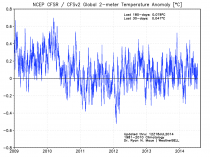
2. Actual temperature has been flat, not increasing: Yes, and since this is a British newspaper, lets use British data to illustrate it and Paul Clark’s excellent “Woodfortrees” website to show what has been happening since 2009 with British HadCRUT4 data.
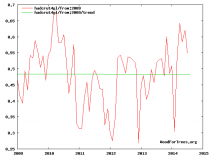
Guardian_5yrs_warming_tempgraph Source:
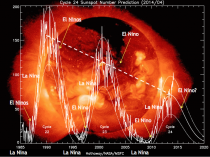
3. Actual solar activity has been far lower than predicted, not increasing: A whole bunch of scientists missed this one, except Dr. Leif Svalgaard. Many were predicting a larger than normal solar cycle, instead we got the weakest one in 100 years.
This animated graph shows the progression of shrinking predictions. And here is the last three cycles down well over 50%.
4. What El Nino? I’ll let Bob Tisdale explain that one here.
We live in interesting times.
UPDATE:
The whole paper making the claim in 2009 is available for free here.
ICECAP NOTE: This was not the first time for alarmist Lean. In much the same way Jonathan Overpeck assumed since David Deming had a paper on Oklahoma climate issues published he was “on the team” and wrote him “Hey David we have to get rid of that Medieval Warm Period, Lean assumed Richard Willson working for NASA on the Hansen team would be amenable to help her prove the sun was not increasing and the warming must be CO2 related (see here). When he pushed back, Lean said it was ok she would get Frohlich to do it.