


By Frank Lansner
Recently I commented on CO2 concentration as a function of temperature. This paper is my attempt to answer comments and reactions for which I am grateful. I wrote: It appears that CO2 concentrations follows temperature with approx 6-9 months. The interesting part is off course that the CO2 trends so markedly responds to temperature changes.
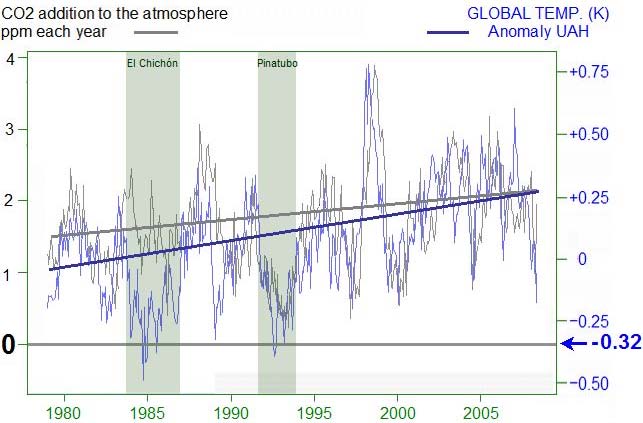
To some, this is “not possible” as we normally see a very smooth rise on CO2 curves. However, the difference in CO2 rise from year to year is quite different from warm to cold years, and as shown differences are closely dependent on global temperatures.
See larger image here
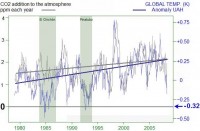
The relatively rough relationship between CO2 growth per year and global temperatures (UAH) is:
1979: CO2 growth (ppm/year) = 3.5 * Temp.anomaly(K) + 0.7
2008: CO2 growth (ppm/year) = 3.5 * Temp.anomaly(K) + 1.2
1979-2008: CO2 growth (ppm/year) = 3.5 * Temp.anomaly(K) + 0.95
For 2007, a UAH temperature anomaly near - 0.32 K should lead to CO2 rise/year = 0 , that is, CO2-stagnation.
These equations are useful for overall understanding, but so far they don’t give a fully precise and nuanced picture, of course. On the graph, I have illustrated that there is a longer trend difference between CO2 and Temperature. Thus, the “constant” of the equation should be a variable as it varies with time (1979: 0.7 2008: 1.2).
The trend difference means, that from 1979 to 2008 the CO2-rise per year compared to the global temperatures has fallen 0.5 ppm/year, or the other way around: It now takes approx. +0.15 K global temperature anomaly more to achieve the same level of CO2 rise/year as it did in 1979. How can this be? The CO2 rise/year now takes higher temperatures to achieve? With the human emissions rising in the time interval 1978-2008, one could imagine that it would be the other way around, that CO2 rises came with still smaller temperature rises needed. But no, its becoming “harder and harder” to make CO2 rise in the atmosphere.
So generally, the human emissions effect appears inferior to other effects in this context at least. Which effects could hold CO2 rise/year down as we see?The fact that we today have higher CO2 concentration in the atmosphere than in 1978 does not favour more CO2 release from the oceans. However the fact that we approx 500 million years ago had almost 7000 ppm CO2 in the atmosphere implies that the 385 ppm today hardly makes a difference. Read much more here.
By Ariel Cohen, Ph.D, Journal of Energy Security
Steadily and stealthily, a natural gas cartel has emerged over the last seven years. On October 21 in Tehran, the Gas Exporting Countries’ Forum (GECF) agreed to form a cartel. Russia, Iran, and Qatar announced that they intend to form a yet-unnamed group to “coordinate gas policy.” The Group of Three (the “troika") will meet quarterly to coordinate and exercise control over close to two-thirds of the world’s gas reserves and a quarter of all gas production. To compare, the Organization of Petroleum Exporting Countries (OPEC) controls more than three-quarters of the world’s oil reserves but only 40% of global production.
The United States should create a global coalition of energy consumers to oppose oil and gas cartels and to bring market principles to the natural gas industry. The US Congress should also liberalize regulations to allow energy exploration in the Arctic, in the Rocky Mountains, and along the Pacific and Atlantic continental shelves, where natural gas is abundant, and expand cooperative gas ties with Canada.
In the tight global energy market, Russia clearly appreciates the economic and political bargaining power that its vast energy resources provide, as it is attempting to control energy exports from the New Independent States, such as Azerbaijan, Kazakhstan, Turkmenistan, and Uzbekistan. Russia also has strengthened its ties to Iran, Venezuela, Libya, and other major energy exporters. Recently, Moscow also launched a charm offensive to OPEC.
Thus, Russia is playing a complex and sophisticated game, one that is likely to maximize its advantage as the leading gas producer with the largest reserves on the planet as well as the largest oil exporter.
The United States should open its vast natural gas resources on-and-offshore to further exploration and production and encourage its neighbors in Canada, Mexico, and the Caribbean to do the same.
Finally, the next administration must develop a clear global policy to limit cartelization of gas markets. Specifically, the US should work with the European Union member states, Japan, China, India, and other countries to prevent the cartelization of the gas sector. This can be accomplished through cooperation through the International Energy Agency, which China and India should be invited to join, and by applying anti-trust legislation worldwide against state-owned companies that are actively involved in cartel-like behavior in energy markets.
The US should also work closely with those within GECF who oppose Russian-Iranian domination. These include Norway as an observer. The National Security Council and the National Economic Council should take the lead in developing this policy. Unless buyer solidarity is translated into action, energy consumers and economic growth will suffer worldwide. Read more here.
By Christopher Monckton on SPPI Scarewatch
The scare: The Guardian, one of the two UK newspapers most prone to write unverified and scientifically-inaccurate stories about the consequences “global warming”, published an article on 10 December 2008, intended to influence delegates at the UN’s Poznan conference on the climate. The article listed a series of alleged climate catastrophes all round the world, saying that “millions are feeling the force of a changing climate. Evidence is emerging of weather patterns in turmoil and the poorest nations disproportionately bearing the brunt of warming”: more and longer droughts, more floods, more heat waves, more rainfall, more frequent and intense cyclones leading to food and water shortages, more illnesses and water-borne diseases, more malnutrition, soil erosion, disruption to water supplies.
In North-Eastern Brazil, temperatures are said to have risen by 1 degree C in 30 years. In “low-lying” Bangladesh, The Guardian says there has been a 10% increase in the intensity and frequency of major cyclones (the period over which this increase is supposed to have occurred is not stated), with too much rain in the rainy season and too little in the dry season. The “balmy” Caribbean is “also being churned up with increasing frequency and ferocity”, with eight hurricanes in 2008, five of which were major, and the hurricane season lasted “a record five months”, leading to “coral bleaching and flooding”. In Mozambique, there is “a clear increase in temperature”, with more frequent extremeweather events, such as tropical cyclones, and late rains. In Nepal, floods that once happened once a decade “seem to be annual and getting more serious”. Forest pigs farrow earlier; rice and cucumber “will no longer grow where they used to”; days are hotter, trees flower twice a year, and “raindrops are getting bigger”. Lakes in Nepal and Bhutan fed by “glacial meltwater” are “growing so rapidly that they could burst their banks”. In Tadjikistan, “thousands of small glaciers will have disappeared completely by 2050, causing more water to flow and hence a “disastrous decline in river flow” The area of Peru’s glaciers fallen by “22% in the last 35 years”.
The truth: The first of two central falsehoods implicit in The Guardian’s wearisomely characteristic catalogue of real or imagined climate disasters is the attribution of every local change in the weather to manmade “global warming”. We begin, as we have had to begin so often in the past when examining such articles as this, by reminding readers that there has been no statistically-significant “global warming” for 13 full years since 1995, and that there has been a significant global cooling over seven full years since late 2001 - a cooling that The Guardian has chosen not to highlight to its readers. It is at once apparent, therefore, that every single one of the imagined recent catastrophes described by The Guardian’s breathless reporters cannot possibly have been caused by any kind of warming, whether manmade or natural, for the good and sufficient reason that there has not been any warming. The second central falsehood lies in the fact, repeatedly stated even by the generally-excitable United Nations climate panel, that individual extreme-weather events, particularly on a local scale, cannot - repeat, cannot - be attributed to “global warming”. Why? Because, as the UN’s 2001 climate assessment puts it, the climate of the Earth is “a complex, non-linear, chaotic object ‘ whose long-run evolution, in the words of Lorenz’s famous paper Deterministic Non-Periodic Flow (1963), “cannot be predicted by any method”. For the truth about a climate scare, visit Scarewatch.
By Bob Ashworth
In the early nineties, some scientists were saying that carbon dioxide (CO2) emissions were causing global warming. This was disturbing to the author; a chemical engineer who has worked on coal conversion processes his whole life. Before it was investigated as to whether or not this was really true, the author developed a scheme to remove CO2 from power plant flue gas by bubbling it through a pond of water to form algae, then skimming it off, drying it and feeding it back to the power plant as a fuel to be blended with the coal. This would do two things, reduce the overall CO2 emissions to the atmosphere, and conserve our coal reserves.
After investigating CO2 as a cause of global warming, it appeared at that time to be false. In the late 1990’s it was brought up again and in 2001, the Intergovernmental Panel on Climate Change (IPCC) announced that CO2 was causing the earth to warm and developed computer models to predict how much the earth would warm in the future. In 2006-2007, the author evaluated this again in depth and found the premise was clearly false. IPCC scientists did not relay that, during the time from the mid 1960’s to 1998, the stratosphere cooled almost three times as much as the earth warmed. From this input, the author could prove that CFC destruction of ozone, not CO2, was the cause of the abnormal warming over that period. He wrote a paper that has been peer reviewed and in mid 2009 will be published in a respected technical magazine. However, putting this aside, does any evidence exist to support the premise that increased concentrations of CO2 in the atmosphere have caused the earth to warm?
Do Scientists Support Global Warming? First, most scientists do not agree with the CO2 global warming premise! In the United States 31,072 scientists, including the author, have signed a petition rejecting the Kyoto global warming agreement and of these, 9,021 have PhDs, including Dr. Edward Teller. The graph below shows the IPPC computer modeling projections from the year 2000 to 2300 based on various assumptions of increasing CO2 in the atmosphere. The pink line, added by the author to the IPCC graph, represents actual measured temperatures.
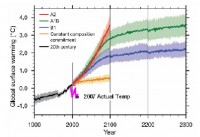
IPCC, 2007: Climate Change Models 2007 compared to Actual Temperature
The actual temperature in 2007 was some 0.7C cooler than the IPCC projection based on the assumption that CO2 concentration did not increase with time. On an actual temperature basis, one sees that the IPCC models predict temperatures that are not even close to actual measurements. To this old chemical engineer the predictions represent the classic “garbage in-garbage out” analysis for computer models.
Based on actual data, CO2 causing global warming is clearly a figment of the IPCC’s imagination. The lesson to the world here is, when it comes to science, never blindly accept an explanation from a politician or scientists who have turned political for their own private gain. Taxing carbon will have absolutely no beneficial effect on our climate, will hurt the economies of the world, and will be harmful to the production of food because less carbon dioxide means reduced plant growth. Many scientists, including the author, see global warming from CO2 as a cruel global swindle, so that a few, at the expense of the many, can reap huge profits from carbon taxes.
See much more here.
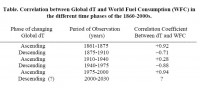
By L.B. Klyashtorin and A.A. Lyubushin
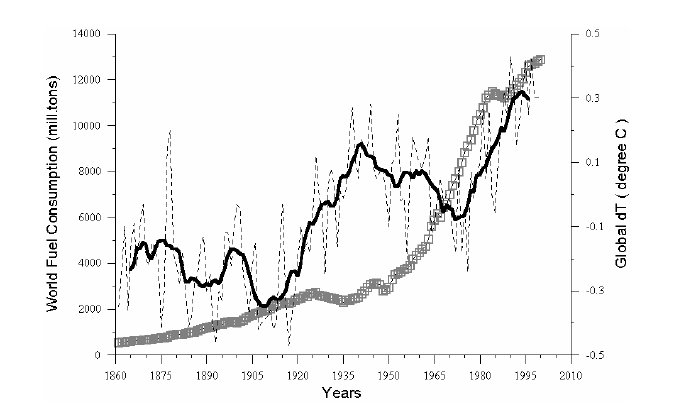
Analysis of the long-term dynamics of World Fuel Consumption (WFC) and the Global Temperature anomaly (dT) for the last 140 years (1961-2000) shows that unlike the monotonously and exponentially increasing WFC, the dynamics of global dT against the background of a linear, age-long trend, undergo quasi-cyclic fluctuations with about 60 a year period. No true linear correlation has taken place between the dT and WFC dynamics in the last century.
Spectral analysis of reconstructed temperature for the last 1420 years and instrumentally measured for the last 140 years global dT shows that dominant period for its variations for the last 1000 years lies in the 50-60 years interval. Modeling of roughly 60-years cyclic dT changes suggest that the observed rise of dT will flatten in the next 5-10 years, and that we might expect a lowering of dT by nearly 0.1-0.15C to the end of the 2020s.

Comparative dynamics of the World Fuel Consumption (WFC) and Global Temperature Anomaly (dT) 1861-2000. Thin line - annual dT; Bold line - 13-years smoothing; Dashed line - WFC (mill. tons of nominal fuel). Larger image here.
Larger image here.
Between 1861-1875, both WFC and dT exhibited simultaneous, well-correlated growth. During 1875-1910, the dynamics of these indices were different. WFC
continues to grow, while global dT decreases, which reflects in negative correlation between the indices. The next period, from 1910 to 1940, is of particular interest in this context. For these 30 years WFC shows virtually no increase because of the global economic crisis of 1920-30-s. However, dT in the same period increased by more than 0.4°. During the subsequent 35-years (1940-1975), WFC increased by a factor of 2.5 (from 3 to 7 billion tons.). For the same period, global dT did not increase, but decreased roughly by 0.12°C and negative correlation between the WFC and dT dynamics is characteristic of this time period.
In the recent 25-year period (1975-2000), in accordance with the ascending phase of an alternate dT fluctuation (see Figure and Table), a close positive correlationtakes place between the dynamics of WFC and dT. Thus, on the background of monotonous increase in WFC during the last 140 years, global dT dynamics exhibited alternating 25-30-year periods of lowering or raising (with the corresponding alternation of positive or negative correlation between the WFC and dT trends). What changes in the dynamics of WFC and Global dT can we expect in the near future, between 2000-2030?
Proceeding from the hypothesis of cyclic dynamics of global dT with a period of 50-60 years, we assume that the current “increasing” phase started in 1975 reached its maximum by 2000, then the gradual decrease in dT will start in the nearest few years and continue up to the 2030s. Read more here.
By Science Daily
The sun’s magnetic field may have a significant impact on weather and climatic parameters in Australia and other countries in the northern and southern hemispheres. According to a study in Geographical Research, the droughts are related to the solar magnetic phases and not the greenhouse effect. The study uses data from 1876 to the present to examine the correlation between solar cycles and the extreme rainfall in Australia.
It finds that the Southern Oscillation Index (SOI) - the basic tool for forecasting variations in global and oceanic patterns - and rainfall fluctuations recorded over the last decade are similar to those in 1914 -1924. Author Professor Robert G. V. Baker from the School of Environmental Studies, University of New England, Australia, says, “The interaction between the directionality in the Sun’s and Earth’s magnetic fields, the incidence of ultraviolet radiation over the tropical Pacific, and changes in sea surface temperatures with cloud cover - could all contribute to an explanation of substantial changes in the SOI from solar cycle fluctuations. If solar cycles continue to show relational values to climate patterns, there is the potential for more accurate forecasting through to 2010 and possibly beyond.”
The SOI-solar association has been investigated recently due to increasing interest in the relationship between the sun’s cycles and the climate. The solar application offers the potential for the long-range prediction of SOI behavior and associated rainfall variations, since quasi-periodicity in solar activity results in an expected cycle of situations and phases that are not random events. Professor Baker adds, “This discovery could substantially advance forecasting from months to decades. It should result in much better long-term management of agricultural production and water resources, in areas where rainfall is correlated to SOI and El Nino (ENSO) events.”

The sun’s magnetic field may have a significant impact on weather and climatic parameters in Australia and other countries in the northern and southern hemispheres.
Journal reference: Baker et al. Exploratory Analysis of Similarities in Solar Cycle Magnetic Phases with Southern Oscillation Index Fluctuations in Eastern Australia. Geographical Research, 2008; 46 (4): 380 DOI: 10.1111/j.1745-5871.2008.00537.x
Read more here.
By Viv Forbes, Chairman of the Carbon Sense Coalition
The Carbon Sense Coalition today called on Australian governments to focus more on energy security, particularly domestic oil exploration, production and refining capacity. Responding to a Queensland government paper entitled “Towards Oil Resilience”, Viv Forbes, Chairman of “Carbon Sense”, said that far too much exploration land was locked up in No-Go areas such as marine parks, national parks, world heritage areas, aboriginal reserves and other restricted areas.
Oil tankers pose far more threat to the coastline and the Great Barrier Reef than would a few oil production platforms and far less eyesore and hazard than hundreds of wind towers. A few inconspicuous oil wells would also disfigure the outback environment far less than thousands of solar panels. And they do less environmental damage than clearing or cultivating vast tracts of land to convert food into ethanol.
Australia is a huge island in a remote corner of the world. Everything we eat, export or import relies on ships, planes, tractors, trucks and trains. These all run on hydro-carbon fuels. Yet every Ministerial statement on energy prattles on endlessly about wind, solar and geothermal energy. For the foreseeable future, our mobile machinery will run on oil, gas, or electricity from coal.
When the next war closes the Middle East oilfields or the sea lanes, Australians will be found trying to run their farm trucks on charcoal burners or waste cooking oil. They will then remember the fools who locked up our own oil on our own land and closed every oil refinery with a totally unnecessary Emissions Trading Scheme.
To read the full submission from The Carbon Sense Coalition “Improving Energy Security” go here.
Viv Forbes
Chairman
The Carbon Sense Coalition
MS 23 Rosewood, Qld 4340
info@carbon-sense.com
www.carbon-sense.com.
By Willis Eschenbach on Climate Audit
A new method is proposed for determining if a group of datasets contain a signal in common. The method, which I call Correlation Distribution Analysis (CDA), is shown to be able to detect common signals down to a signal:noise ratio of 1:10. In addition, the method reveals how much of the common signal is contained by each proxy. I applied the method to the Mann et al. 2008 (hereinafter M2008) proxies. I analysed all (N=95) of the M008 proxies which contain data from 1001 to 1980. These contain a clear hockeystick shaped signal. CDA shows that the hockeystick shape is entirely due to Tiljander proxies plus high-altitude southwestern US “stripbark” pines (bristlecones, foxtails, etc). When these are removed, the hockeystick shape disappears entirely.
Here is the plot with all the proxies:
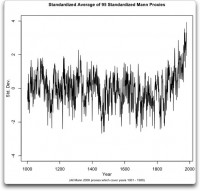
Hmmm … that looks suspiciously like the original MBH98 results, the infamous “HockeyStick”. Once we remove the four Tiljander proxies, it is obvious that the whole edifice is built on a few closely related high-elevation, moisture limited pine trees located in the southwestern US. These tree rings make up no less than 19 of the 21 remaining top proxies after Ti ljander is removed. In other words, the bristlecones are back and with a vengeance.
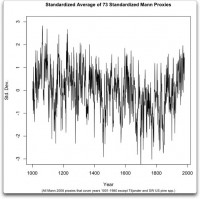
I guess the deal is that no self-respecting paleoclimate reconstruction would be complete without the bristlecone pines (PILO), which make up no less than 12 of the remaining top 21 (after Tiljander is removed). In addition we have the bristlecone’s cousins, the limber pine (PIFL) and the foxtail pine (PIBA). All of these records contain are from similar ecosystems and contain similar signals. The overwhelming majority were collected by Graybill. His work has been called into serious question by LInah Abadneh’s thesis, wherein she was unable to replicate his results.
If I ran the zoo, I’d throw out all of those high altitude pine tree ring records. They are known to have problems, their use has been recommended against, and the principle investigator’s work is under a cloud. I would omit them. After removing the Tiljander and the southwestern US pines, the average looks like this:
Read full post and see Willis’s methods for the analysis here.
Read more papers on why Mann and his hockey stick must hold the Guinness Book of World Record listing for most often debunked scientist and theory.