


By Craig Loehle
Abstract: Tree rings provide a primary data source for reconstructing past climates, particularly over the past 1,000 years. However, divergence has been observed in twentieth century reconstructions. Divergence occurs when trees show a positive response to warming in the calibration period but a lesser or even negative response in recent decades. The mathematical implications of divergence for reconstructing climate are explored in this study. Divergence results either because of some unique environmental factor in recent decades, because trees reach an asymptotic maximum growth rate at some temperature, or because higher temperatures reduce tree growth. If trees show a nonlinear growth response, the result is to potentially truncate any historical temperatures higher than those in the calibration period, as well as to reduce the mean and range of reconstructed values compared to actual. This produces the divergence effect. This creates a cold bias in the reconstructed record and makes it impossible to make any statements about how warm recent decades are compared to historical periods. Some suggestions are made to overcome these problems.
Studies have documented divergence across much of the upper northern hemisphere (but not at all sites), though dendroclimatic studies are rare in warmer
climates (see Feeley et al. 2007) so this geographic restriction does not mean it is restricted to the far north. Reduced tree growth in response to warmer temperature was found in Alaska after ∼1950 by Lloyd and Fastie (2002), by Wilson and Luckman (2003) in Canada, and in Siberia since 1970 (Jacoby et al. 2000), among other places. In a recent circumpolar satellite survey covering 1982 to 2003 (Bunn andGoetz 2006), it was found that tundra areas showed increased photosynthetic activity, but forested areas showing a change evinced decreased photosynthesis and this effect was greater where tree density was higher. This effect probably reflects moisture limitations at higher temperatures. In some places trees appear inherently insensitive to temperature (e.g. Berg et al. 2007).
Conclusion:
In conclusion, the nonlinear response of trees to temperature explains the divergence problem, including cases where divergence was not found. The analysis here also shows why non-tree ring proxies often show the Medieval Warm Period but tree ring-based reconstructions more often do not.While Fritts (1976) notes the parabolic tree growth response to temperature, recent discussions of the divergence problem have not focused on this mechanism and climate reconstructions continue to be done using a linear response model. When the divergence problem clearly indicates that the linearity assumption is questionable, it is not good practice to carry on as if linearity is an established fact. Read full analysis here.
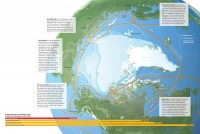
One of our readers sent in this image of the Arctic in the Atlantic with embedded comments on the Northwest Passage.
See larger image here.
“The fabled Northwest Passage opened this summer for the second time in history and the second year in a row. The Northeast Passage (also called the Northern Sea Route) over Eurasia first fully opened in 2005; shipping is already extensive within that region particularly in the Barents Sea. Yet both routes, sought by ancient mariners, are likely to be used for only for a few years. By 2025, if not before, most ships in the arctic will likely sail over the pole, avoiding coastal state jurisdictions and shaving still more miles off their journeys. Much of the world’s international shipping will reorient itself as well.”
Dr. Gary Sharp suggested the following historical account that sets the record straight here. It starts: “The Northwest Passage is a sea route between the Atlantic and Pacific Oceans. For more than three centuries explorers had been trying to find the route before it was finally discovered in 1906 by Norwegian explorer Roald Amundsen (1872–1928)… When Amundsen successfully navigated the Northwest Passage, he found that it wound around between the mainland of northern Canada and the arctic islands of Canada. The journey aboard his small ship Gjoa took more than three years because he and his crew were forced to camp three winters. Columbus, European navigators began to seek a western route. Prominent in this search were such names as Jacques Cartier, Gaspar and Miguel Corte-Real, Sir Martin Frobisher, John Davis, Henry Hudson, and William Baffin.
The urgency behind the search for the passage was tempered by the completion of the Suez Canal in 1869, and later by the Panama Canal, in 1914. Not until 1903-06 did a single ship make the entire trip through the passage. This was accomplished under the leadership of the Norwegian explorer Roald Amundsen. The first successful commercial voyage was made by the ice-breaking tanker SS Manhattan in 1969. This voyage followed the discovery of large oil deposits in Alaska, which influenced the opening of a shorter route to the east coast of the United States.”
Gary then pointed out that there were several non-commercial ventures that made the passage - as per the reference - “Northwest Passage: The Quest for an Arctic Route to the East” by Edward Struzik in 1991 - available via any book sales office. He also recommended this historical account of bad journalism on this subject here and this listing of links here.
See Gary’s site “It’s All About Time and Place” here.
By Art Raiche
In his excellent article, Peter Slezak quotes the importance of Mill, Christ and Socrates in challenging authority and prevailing modes of thought. Why is this scepticism not applied to the climate debate where the very word sceptic is hurled as a damning insult? We ignore sceptics ar our peril. We are making crucial economic decisions based on modelling carried out by CSIRO despite the fact that CSIRO itself uses heavy disclaimers to eschew responsibility for the contents of all their climate reports. For example, their report on climate change in South Australia contains the paragraph:
“This report relates to climate change scenarios based on computer modelling. Models involve simplifications of the real physical processes that are not fully understood. Accordingly, no responsibility will be accepted by CSIRO or the South Australian Government for the accuracy of projections in this report or actions on reliance of this report.”
Climate change is a serious threat, all the more dangerous because the seemingly indisputatable orthodoxy of warming due to increased greenhouse gasses has blinded us to the really dangerous global-cooling threat of mass starvation and wars based on access to food and water. Joint work by the Russian and Ukranian Academies of Science has identified a 200 year cycle in solar activity that has peaked and is now decreasing. Global cooling is predicted, not only on the basis of decreased solar intensity reaching the earth but also because of the associated increase of the cosmic ray barrage. The latter occurs due to the drop in the shielding power of the solar magnetic field and the solar wind velocity.
Increased cosmic ray flux can cause global cooling because it promotes an increase in low altitude cloud formation. As shown by Project SKY at the Danish National Space Centre, this happens because the passing muons in the cosmic radiation release electrons that promote the formation of molecular clusters, the building blocks for cloud condensation nuclei. A follow-on study of this crucial effect, the CLOUD experiment has been established at CERN, with an interdisciplinary team of scientists from 18 institutes in 9 countries, comprised of atmospheric physicists, solar physicists, and cosmic-ray and particle physicists. This is important because of the significant decrease in solar shielding associated with the expected prolonged downturn in solar activity.
See this compilation Art prepared of disclaimers that they CSIRO attached to their alarmist analyses to protect them when they are proven wrong.
By Roger Pielke Jr., Prometheus
Over at Climate Progress, Joe Romm asserts that climate policies in the EU represent a very impressive achievement that should serve as an inspiration to the world. This is an odd conclusion coming from Joe, since he is often going on about the end of the planet if we don’t act yesterday.
Rather than looking dispassionately at the EU as a forward-think policy laboratory, Joe instead chooses to attack the US and make the issue partisan. A more productive approach would be to look to the admirable EU leadership as an opportunity to learn about the practical challenges of emissions reductions, even when there is strong political support.
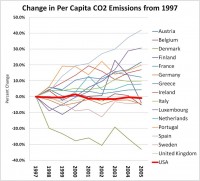
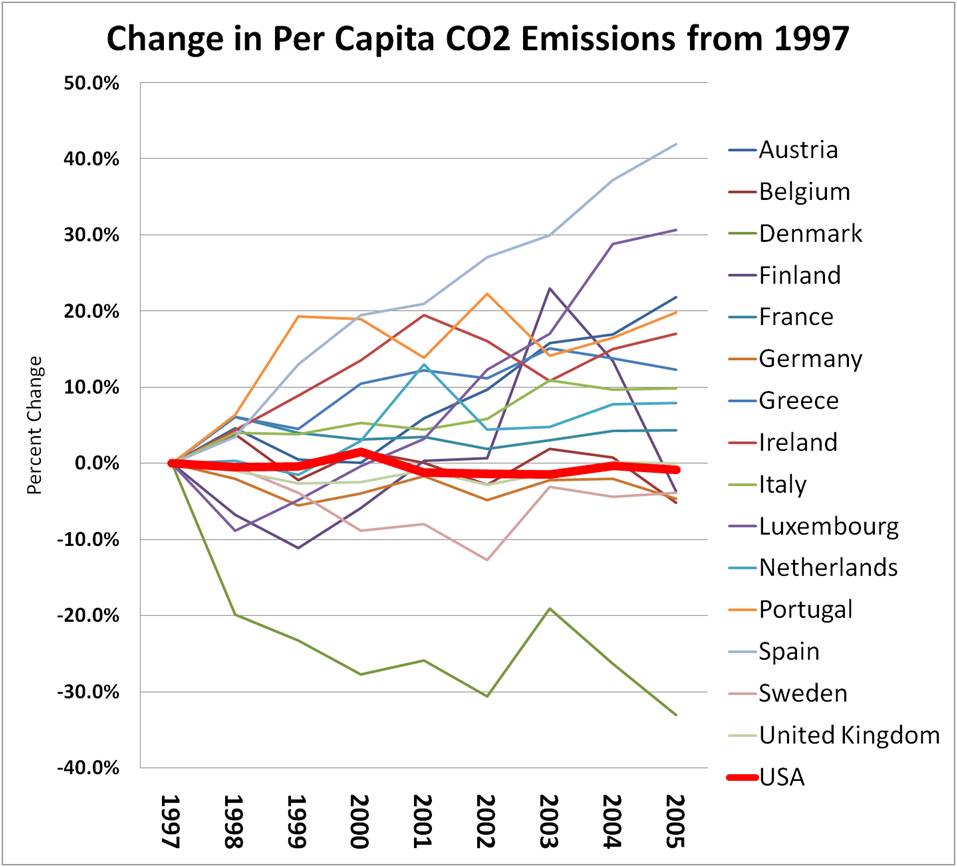
The following graph (using data from the US EIA here in .xls) needs little interpretation. It shows post-Kyoto per capita carbon dioxide emissions in each of the EU-15 countires as well as the US for 1997 to 2005 (the last year for which data was available, but I don’t think that extending to 2007 would make much difference). The overwhelming majority of countries of the EU-15 saw per capita emissions increase faster that the US. The lesson that one should take is not that the US is succeeding, but rather that the success of the EU has been overstated, and Joe propagates that myth. Read more and see comments here.
See larger image here.
By Dr. Roy Spencer
A simple climate model forced by satellite-observed changes in the Earth’s radiative budget associated with the Pacific Decadal Oscillation is shown to mimic the major features of global average temperature change during the 20th Century - including two-thirds of the warming trend. A mostly-natural source of global warming is also consistent with mounting observational evidence that the climate system is much less sensitive to carbon dioxide emissions than the IPCC’s climate models simulate.
As Joe D’Aleo and others have pointed out for years, the Pacific Decadal Oscillation (PDO) has experienced phase shifts that coincided with the major periods of warming and cooling in the 20th Century. The pre-1940 warming coincided with the positive phase of the PDO; then, a slight cooling until the late 1970s coincided with a negative phase of the PDO; and finally, the warming since the 1970s has once again coincided with the positive phase of the PDO.
Since this timing between the phase of the PDO and periods of warming and associated climate change seems like more than mere coincidence, I asked the rather obvious question: What if this known mode of natural climate variability (the PDO) caused a small fluctuation in global-average cloud cover? Such a cloud change would cause the climate system to go through natural fluctuations in average temperature for extended periods of time. The IPCC simply assumes that this kind of natural cloud variability does not exist, and that the Earth stays in a perpetual state of radiative balance that has only been recently disrupted by mankind’s greenhouse gas emissions. (This is an assumption that many of us meteorologists find simplistic and dubious, at best.)
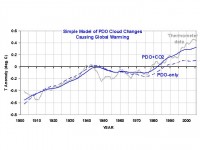
I used a very simple energy balance climate model, previously suggested to us by Isaac Held and Piers Forster, to investigate this possibility. In this model I ran many thousands of combinations of assumed: (1) ocean depth (through which heat is mixed on multi-decadal to centennial time scales), (2) climate sensitivity, and (3) cloud cover variations directly proportional to the PDO index values. In effect, I asked the model to show me what combinations of those model parameters yielded a temperature history approximately like that seen during 1900-2000. And here’s an average of all of the simulations that came close to the observed temperature record:
See lager image here.
The “PDO-only” (dashed) curve indeed mimics the main features of the behavior of global mean temperatures during the 20th Century—including two-thirds of the warming trend. If I include transient CO2 forcing with the PDO-forced cloud changes (solid line labeled PDO+CO2), then the fit to observed temperatures is even closer. These recent satellite measurements - even though they span less than 6 years—support the Pacific Decadal Oscillation as a potential major player in global warming and climate change.
The evidence continues to mount that the IPCC models are too sensitive (produce too much global warming). If climate sensitivity is indeed considerably less than the IPCC claims it to be, then increasing CO2 alone can not explain recent global warming. The evidence presented here suggests that most of that warming might well have been caused by cloud changes associated with a natural mode of climate variability: the Pacific Decadal Oscillation.
I am posting this information in advance of publication because of its potential importance to pending EPA regulations or congressional legislation which assume that carbon dioxide is a major driver of climate change. Since the news media now refuses to report on peer-reviewed scientific articles which contradict the views of the IPCC, Al Gore, and James Hansen, I am forced to bypass them entirely. We need to consider the very real possibility that atmospheric carbon dioxide - which is necessary for life on Earth and of which there is precious little - might well be like the innocent bystander who has been unjustly accused of a crime based upon little more than circumstantial evidence. See full pre-paper post here.
By Jennifer Marohasy, Politics and Environment Blog
These days, it can be hard to imagine how Melbourne ever earned a reputation as the gloomy, rain-filled capital of the south. But, growing up in the 1970s, my memories are full of muddy ovals, local creeks in flood and catching tadpoles in puddles that lasted for months on end. How things have changed.” This is how David Jones, head of climate analysis at the Bureau of Meteorology, began an opinion piece entitled ‘Our hot, dry future’ published by Melbourne’s The Age newspaper on October 6, 2008. Dr Jones goes on to blame climate change for the drought and warns there is worse to come.
I recognise that Dr Jones is an expert on predicting future climates, but I am not sure he has adequately explained the recent past climate of Melbourne. Climate always changes and in a country like Australia climate tends to naturally cycle between periods where there is a dominance of wet La Nina conditions and then dry El Nino. The 1950s and 1960s were very wet along the entire east coast of Australia, but since 1976 the median state of the Pacific Ocean has been towards El Nino that is dry conditions. Indeed Dr Jones was a young boy when it was relatively wet while his adult life has been dominated by El Nino conditions. Of course the built environment has also changed. Melbourne is a much more affluent city now than it was 30 years ago and along with affluence comes laser levelling of sporting venues and much improved drainage and flood mitigation so ovals dry out relatively quickly, creeks are slowed and puddles in public places now a thing of the past.

See larger Melbourne photo here.
But there is more to this story. Bill Kininmonth, a meteorologist formerly with the Bureau, has made the following comment about how the recording of Melbourne’s weather has changed over the years and how the rain gauge in Melbourne’s central business district is now sheltered from the rain bearing winds of the southwest: Although Melbourne’s observations commenced in 1851 the location and environment have changed over that time. The earliest observations commenced at Flagstaff Hill and then they changed to the Observatory site south of the Yarra. For more than 100 years the observations have been taken from the present site on the corner of Victoria Parade and Latrobe Street. However there has been urbanisation. The site has clearly lost exposure to the cooling southerly winds and the rain gauge is sheltered from the rain bearing winds of the southwest.
“Clearly it is difficult to draw a conclusion about Melbourne’s climate and the possibility that it might be changing. The urbanisation of the site should make the record indicate a hotter and dryer climate, whether or not that has occurred. Essendon airport was a previous non-urban locality in the vicinity but that closed in the early 1970s. Tullamarine is the current site but was not open during the dry periods of the first half of the 20th century. Laverton, likewise an early site with long data has also been closed.” Read much more of Part I of this ‘debate’ here.
By Art Raiche
The following letter of mine appeared in the Guardian Weekly (October 10-16 2008). Thanks to Joe D’Aleo for alerting us to his work on the Farmers Almanac. Also full marks to the Guardian Weekly for being open to ideas which seem to oppose their supposed ideological base.
Although “Channelling the weather” (the Guardian Weekly, September 26) presented the climate predictions in the Farmers’ Almanac as a mixture of old-fashioned observation and whimsy, in fact the science behind these predictions is leading edge. Joint work by the Russian and Ukranian Academies of Science has identified a 200 year cycle in solar activity that has peaked and is now decreasing. Global cooling is predicted, not only on the basis of decreased solar intensity reaching the earth but also because of the associated increase of the cosmic ray barrage. The latter occurs due to the drop in the shielding power of the solar magnetic field and the solar wind velocity.
Increased cosmic ray flux can cause global cooling because it promotes an increase in low altitude cloud formation. As shown by Project SKY at the Danish National Space Centre, this happens because the passing muons in the cosmic radiation release electrons that promote the formation of molecular clusters, the building blocks for cloud condensation nuclei. A follow-on study of this crucial effect, the CLOUD experiment has been established at CERN, with an interdisciplinary team of scientists from 18 institutes in 9 countries, comprised of atmospheric physicists, solar physicists, and cosmic-ray and particle physicists. This is important because of the significant decrease in solar shielding associated with the expected prolonged downturn in solar activity.
Project Astrometria has been given high priority by the Russian and Ukranian Academies of Science to try to identify the likely duration and depth of the predicted global cooling period associated with decreased solar intensity. Some researchers fear that the predicted cooling period may be similar to that of the little ice age from about the 16th to the 18th century.
Climate change is a serious threat, all the more dangerous because by being fixated on the possibility of warming due to increased greenhouse gasses, we are oblivious to the really dangerous global-cooling threat of mass starvation and wars based on access to food and water. We build our defenses in the south, but the enemy comes from the north.
By Anthony Watts, Watts Up With That
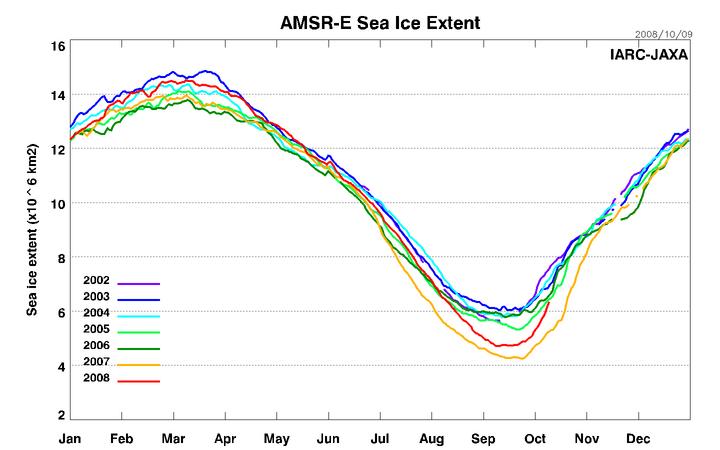
As many readers know, the predictions for record low sea ice minimums in 2008 were not met, and 2008 ended up about 9% higher than in 2007 at the end of the season. See the report here.
Now in looking at AMSR-E satellite data, the red line on the graph below, one can see that the recovery is at a significantly faster rate than in recent years. I’m not one to read much into this, as to do so would be to make the same mistake as was done earlier this year when the NSIDC melt trend led one researcher there to conclude that we’d see an “ice free north pole”.

See larger image here.
See full post and comments here