


By Ernst-Georg Beck
The highlight of the 2001 climate report of the IPCC was undoubtedly the hockeystick graph, created by the Penn State University climate scientist Michael Mann. The curve was a reconstruction of the northern hemisphere’s temperature since 1000 B.C showing a linear contour until the 19th century and an abrupt rise since about 1900. Most remarkable was the absence of the well documented Medievial Warm Period (MWP) and the Little Ice Age (LIA) during the 17th century. Relying mostly on the treerings of bristlecone pines growing at extreme locations several groups of scientists meanwhile had falsified Mann’s study. In September 2008 M. Mann has published a new paper, using data from 9 different proxies and confirming the contradicted claims of his first article in 1998. Again he summarized: “Surface temperatures in the Northern Hemisphere were warmer over the last 10 years than any time during the last 1,300 years”. According to his updated temperature reconstruction modern temperatures exceed those of the MWP by approx. 0.8C.
A closer look to Mann’s paper will help us to find the truth:
1. His new temperature contour is very similar to his “contradicted hockeystick graph. Thousands of studies round the world give evidence for a MWP and LIA showing much higher temperatures during MWP than today. The tree limits in the mountains or near the arctic circle had been several hundred meters higher respectively towards the north compared to today.
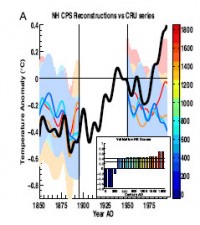
2. Mann is comparing smoothed decadal temperature reconstructions from proxies with the high resolution annual averages from direct measurements since 1850. This is not acceptable.
3. As direct measured temperature data he used the exaggerated data from CRU (UK), which display a rise of approx. 1.3C since 1850, in contrast to the 0.7 C by IPCC.
4. If these direct data were omitted (in red) the proxies clearly show higher temperatures during the MWP.
5. Using fig. 2 of his latest study we see the proxy data compared to the direct measurements since pre-industrial times 1850 (CRU). source: Mann et al. 2008 (fig. 2, extract) but there is absolutely no correlation in the second half of the 20th century when the CRU data claim a sharp rise of the temperature and the proxies suggest a cooling. Conclusion: If the reconstructions are valid modern measured temperature data published by CRU are in error.
6. Mann exclusively had used data received on continents omitting ocean data despite of a 61% coverage of the northern hemisphere by oceans.
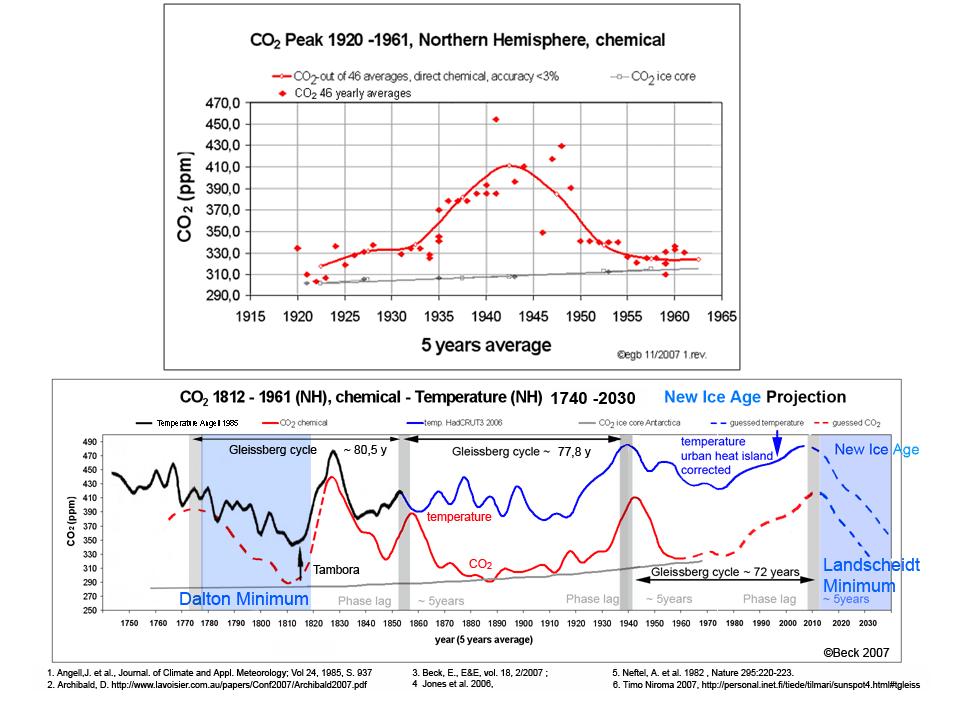
Mann’s new paper is another attempt to falsify climate history by selective and statistical fitted data. MWP and LIA are the most complete documented periods in climate history. The referees who passed such a most questionable piece of paper obviously agreed with Mann’s results to confirm IPCC’s man made greenhouse fantasies. See full pdf here. See Beck’s reconstruction of the CO2 based on direct chemical measurements and temperatures from proxies ignoring the urban contaminated station data over the same interval here.