


By Craig Loehle, Energy and Environment, 2009
Global satellite data is analyzed for temperature trends for the period January 1979 through June 2009. Beginning and ending segments show a cooling trend, while the middle segment evinces a warming trend. The past 12 to 13 years show cooling using both satellite data sets, with lower confidence limits that do not exclude a negative trend until 16 years. It is shown that several published studies have predicted cooling in this time frame. One of these models is extrapolated from its 2000 calibration end date and shows a good match to the satellite data, with a projection of continued cooling for several more decades.
INTRODUCTION
Temperature trends provide critical evidence for evaluating claims regarding anthropogenic climate change. On the one hand, models project continued warming (e.g., Hansen et al., 2006). On the other, it has been argued that Earth’s weather should be expected to exhibit long-term persistence (LTP) at some scale (Cohn and Lins, 2005; Easterling and Wehner, 2009; Wood, 2008). LTP could at any given time give a false impression of the strength of anthropogenic effects by adding a warming trend to an existing anthropogenic signal, or it could act to counter such signal for some period of years or decades. Thus it is critical to examine climate history data at multiple scales to evaluate these effects. Typical trend studies, however, have not evaluated the most recent decades per se.
METHODS
The purpose of the analysis is to examine the data for linear trends. Looking backward from the most recent dates, the question is what is the temperature trend over recent years? If it is negative (cooling), how long can a cooling trend be said to have existed? Starting at the beginning of the record in 1979 and looking forward, how long a record is needed before a warming trend is detectable? Starting with intervals in the middle of the record, how does the trend in this middle interval compare to the starting and ending periods? Linear trends are the simplest way to assess climate change, and are used in the IPCC reports and most of the trend studies cited in the introduction, among many others. Linear trends also have the advantage that confidence intervals are well defined, which aids in interpretation. Calculating such linear trends overcomes issues due to subjective interpretation of noisy data and the arbitrariness of various methods of smoothing the data, especially at the end points (see Soon et al., 2004). By showing trends of data segments of multiple lengths, issues of the studied interval being unduly influential are avoided.
Longer-term trends (or red noise) are graphically uncovered by the analysis, if they exist, and are not being estimated per se. Instead the questions are strictly empirical: how much has it warmed/cooled over various lengths of time, according to satellite data? University of Alabama at Huntsville (UAH) and Remote Sensing Systems (RSS) Microwave Sounding Unit (MSU) data were obtained on July 20, 2009.

See larger image here.
CONCLUSIONS
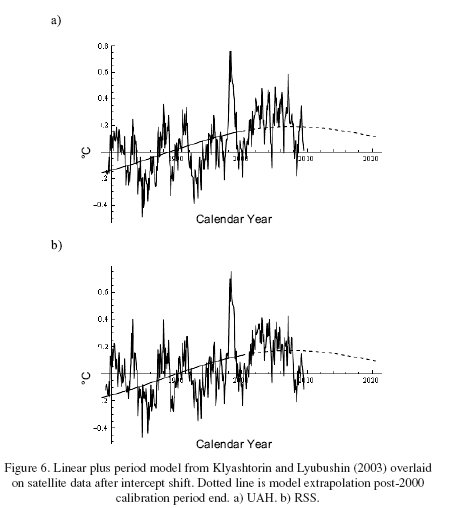
Analysis of the satellite data shows a statistically significant cooling trend for the past 12 to 13 years, with it not being possible to reject a flat trend (0 slope) for 16 years. This is a length of time at which disagreement with climate models can no longer be attributed to simple LTP. On the other hand, studies cited herein have documented a 50-70 year cycle of climate oscillations overlaid on a simple linear warming trend since the mid-1800’s and have used this model to forecast cooling beginning between 2001 and 2010, a prediction that seems to be upheld by the satellite and ocean heat content data. Other studies made this same prediction of transition to cooling based on solar activity indices or from ocean circulation regime changes. In contrast, the climate models predict the recent flat to cooling trend only as a rare stochastic event. The linear warming trend in these models that is obtained by subtracting the 60-70 yr cycle, while unexplained at present, is clearly inconsistent with climate model predictions because it begins too soon (before greenhouse gases were elevated) and does not accelerate as greenhouse gases continue to accumulate. This model and the empirical evidence for recent cooling thus provide a challenge to climate model accuracy.
See full PDF here.