


By Stephen McIntyre, Climate Audit
Last year, Ross McKitrick proposed the ironic idea of a “T3 Tax” in which carbon tax levels were related to observed temperature increases in the tropical troposphere. Temperature increases in the tropical troposphere are, as I understand it, a distinctive “fingerprint” for carbon dioxide forcing. Apparent discrepancies between a lack of warming in satellite data and surface warming have been a battleground issue for many years. In one of the most recent surveys of the matter in 2006, the U.S. CCSP proclaimed that the issue had been put to rest:
“Previously reported discrepancies between the amount of warming near the surface and higher in the atmosphere have been used to challenge the reliability of climate models and the reality of human induced global warming. Specifically, surface data showed substantial global-average warming, while early versions of satellite and radiosonde data showed little or no warming above the surface. This significant discrepancy no longer exists because errors in the satellite and radiosonde data have been identified and corrected. New data sets have also been developed that do not show such discrepancies.”
In this respect, the March 2008 satellite data for the tropics is pretty interesting. The graph below shows UAH (black) and RSS (red) for the tropics (both divided by 1.2 to synchronize to the surface variations - an adjustment factor that John Christy said to use in an email). I also collated the most recent CRU gridded data and calculated a tropical average for 20S to 20N, shown in green. All series have been centered on a common interval.
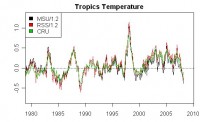
Tropical Troposhoeric Temperatures through March 2008. See larger image here
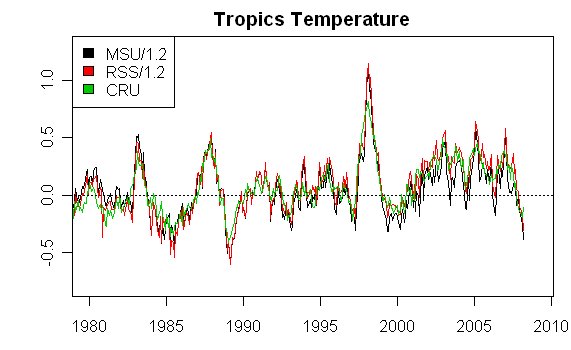
There have only been a few months in the past 30 years which have been as cold in the tropical troposphere as March 2008 four months in the 1988-1989 La Nina. At present, there is no statistically significant trend for the MSU version. The data set has very high autocorrelation. See full post here.