


By Joseph D’Aleo CCM, AMS Fellow
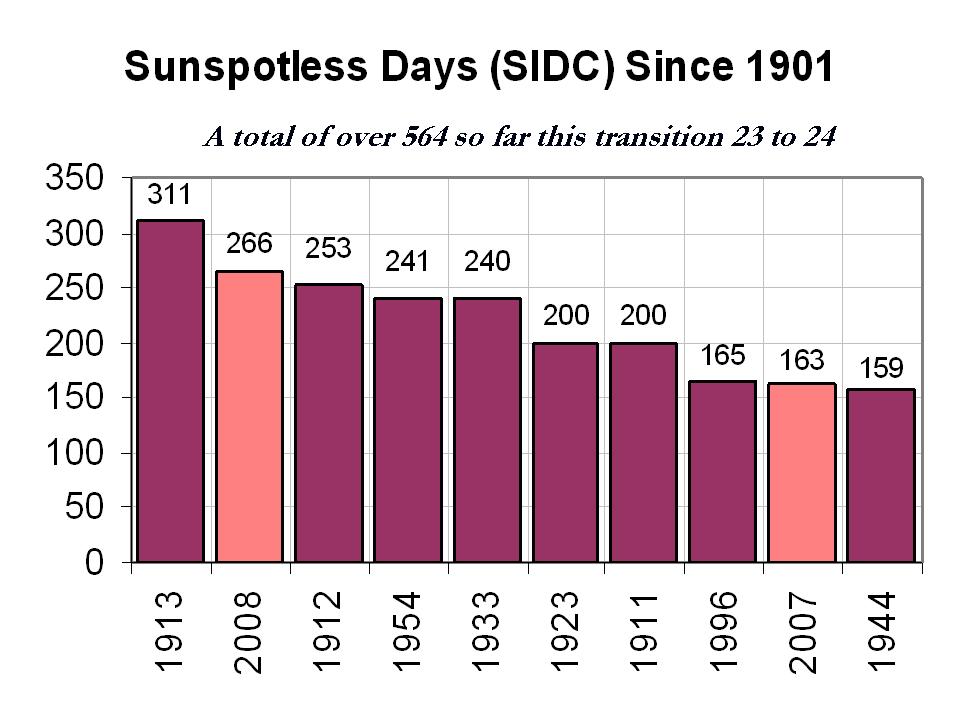
2008 will be coming to a close with yet another spotless days according to the latest solar image.
This will bring the total number of sunspotless days this month to 28 and for the year to 266, clearly enough to make 2008, the second least active solar year since 1901.

See larger image here.
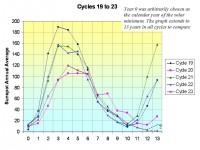
The total number of spotless days this solar minimum is now at around 510 days since the last maximum. The earliest the minimum of the sunspot cycles can be is July 2008, which would make the cycle length 12 years 3 months, longest since cycle 9 in 1848. If the sun stays quiet for a few more months we will rival the early 1800s, the Dalton Minimum which fits with the 213 year cycle which begin with the solar minimum in the late 1790s.
See larger image here.
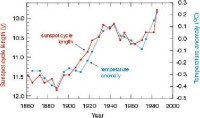
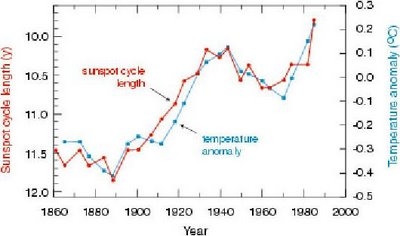
Long cycles are cold and short ones like the ones in the 1980s and 1990s are warm as this analysis by Friis-Christensen in 1991 showed clearly.
See larger image here.
In reply to the arguments made that the temperatures after 1990 increasingly diverged with solar length, I point out that it was around 1990 when a major global station dropout (many rural) began which led to an exaggeration of the warming in the global temperature data bases.
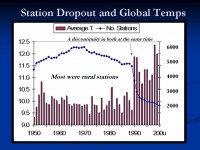
The temperature bars do not represent global temperatures directly as the distribution of the stations that vanished is not geographically even. They do indicate a change to a more urban mix. The satellites and radiosonde balloon provide more accurate temperature change assessments but the do not cover more than several decades. They show changes at about half the inflated global station based data.
See larger image here.
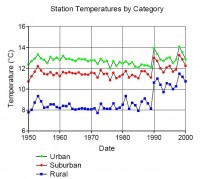
This graph of annual temperatures by Jonathan Drake breaks up the data into urban, suburban and rural. Note the biggest discontinuity was with the rural, indicating the changing distribution of rural stations was the greatest with a change towards a more lower latitude set (greatest losses were in Siberia).
This suggest the lower warming rates found by satellite and balloons is correct during the 1979-1998 period. Supporting this warming was the drop of the length from max to max of 21 to 22 to 9.7 years and cycle 22 length min to min 9.8 years, both very short suggesting warm temperatures in the 1990s. The interval of cycle 22 max to cycle 23 max centered in the mid 1990s began to increase at 10.7 years and the min to min length of cycle 23 is now at least 12.3 years.
With the Wigley suggested lag of sun to temperatures of 5 years and Landscheidt suggested 8 years, a leveling off should have been favored around 2000-2003 and cooling should be showing up now. Looking ahead, put that together with the flip of the PDO in the Pacific to cold and you have alarming signals that this cooling of the last 7 years will continue and accelerate.
See David Hathaway’s PPT presented at a conference in NAPA, CA early in December on forecasting cycle 24 here (courtesy Solarcycle24.com).