By Edward Long, American Thinker
Our study of data-massaging by the U.S. government agency charged with collecting temperature information raises uncomfortable questions.
We have been repeatedly told (perhaps “lectured” is a better word) the past twenty years that global warming is occurring. With Climategate and subsequent confessions and bailouts by scientists at the CRU, Penn State, Arizona State, IPCC, et al., we are learning that little to none of the factual content in their “peer reviewed” articles is true. The Medieval Warming Period did occur, and it was warmer than currently; the oceans are not going to flood the plains; and the Arctic Ocean may not be turning into a summer water park. Of course, the mainstream media, especially in the United States, has reported little of this news, and President Obama appears not to be well-informed. But now the global warming story grows more interesting because here in America, we may have our own little “gate.” I will call it ATG, for “American Temperaturegate.”
NOAA’s National Climatic Data Center (NCDC) informs us, based on their “Adjusted Data” for the period from the last decade of the 19th century to 2006, that the temperature for the contiguous U.S. has increased at a rate of 0.69C/century. Click here. NCDC arrives at this conclusion by massaging raw data from a set of meteorological stations located in the contiguous U.S. which they selected on the basis of a 2.5-degree latitude- and 3.5-degree-longitude grid. For more on this, click here and here. The most-asked question, most recently by D’Aleo and Watts, is whether the NCDC’s reported increase is correct. Perhaps the value is due to a dominant use (over-selection) of stations in urban locations or because of other issues, such as leaving out stations at higher altitudes for the more recent history and retaining them for the more distant past.
Here, one aspect is considered—that of the Urban Heat Island Effect, which is tagged as UHIE.
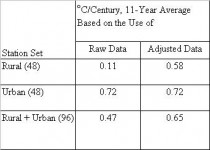
We selected two sets of meteorological stations (48 each, with one station per each of the lower 48 states) from the NCDC master list. The stations in one set were at rural locations—a rural set. The stations in the other set were at urban locations—an urban set. The NCDC latitude and longitude station coordinates were used to “fly over” the locations on a computer, using a GPS map application to confirm the rural and urban characteristics. For each of the 96 stations, the NCDC’s raw and adjusted temperature data were entered into a spreadsheet application and studied. The “raw” data are the annual average temperatures of the measured data. The “adjusted” data are the annual average temperatures the NCDC derived from the raw data by making a set of “corrective” assumptions for time of day, type of instrument, etc. and guessing the temperature at stations for missing data based on temperatures of other stations at the same latitude and/or region. For a more in-depth understanding of the NCDC protocols for converting raw data to adjusted data, click here. A summary of the findings is in the following table. The values in the table (below, enlarged here)show that the NCDC’s rate of increase of temperature, 0.69C/century, is based on an over-selection of stations with urban locations.

The values in the table highlight four important considerations:
1) The rate of increase for rural locations, based on as-measured (raw) values, is small (if not, in effect, zero) at 0.11 C/century.
2) There is definitely a UHIE in that the urban raw data has a rate of increase of 0.72C/century. This tells us that man has caused warming in urban locations. This finding should not surprise anyone. On the other hand, because the rural value is 15% of the urban value, the UHIE has not caused warming in the rural locations, and it certainly has not caused a global sense of warming other than the aspect that the urban location values when averaged with the rural values produce an average increase which is larger than that of the rural alone.
3) The rural + urban value for the adjusted data, 0.65C/century, is still less than the 0.69C/century published by the NCDC. Thus, likely, there are more urban than rural sites used by the NCDC.
4) And this is the “Temperaturegate” aspect: The NCDC’s massaging—they call it “adjusting”—has resulted in an increase in the rural values, from a raw value of 0.11C/century to an adjusted value of 0.58C/century, and no change in the urban values. That is, the NCDC’s treatment has forced the rural value to look more like that of the urban. This is the exact opposite of any rational consideration, given the growth of the sizes of and activities within urban locations, unless deception is the goal.
The criticism this makes of the NCDC’s treatment of historical data for the contiguous U.S. is the same as a recent Russian paper made of the HadCRUT treatment of historical temperature data for Russia. For a thumbnail of the points made in that paper, click here.
See full Temperaturegate story here.
Edward R. Long holds a Ph.D. in physics. He is a retired NASA scientist who is a consultant on radiation physics for space flight and on energy/climate in the Commonwealth of Virginia.
See full paper on SPPI here and an excellent Watts Up With That blog and discussion with comments here.


