By Joseph D’Aleo, CCM, ICECAP
Recently, a critical adjustment was made by NASA to its US Annual mean temperature record since 1895, due to discovering an error in their adjustments found by Steve McIntyre, who also blew the whistle on the flawed hockey stick of Mann, Bradley and Hughes. Tellingly, the adjustment came without a press release or even an explanation on the site, sparking considerable attention in the blogosphere but drawing little mention in the national media. One can rest assured had the adjustment been the other way (a warming), there would have been press releases, widespread hype and headlines for several days.
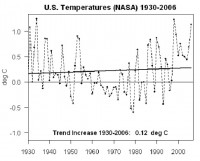
The adjustment made was primarily to the temperatures in the years post 2000 for which the average year declined by 0.15C. NASA GISS’s Gavin Schmidt and James Hansen have responded to the media that the adjusted downward correction of 0.15 deg C (0.27F) was not significant. If one accepts that as true and examines the new US temperature curve since 1930, one finds a trend of only 0.12C (0.22F) for the 77 years of measurement. Thus, according to the recent judgment of Schmidt and Hansen’s, the warming in the United States over the past 77 years has also been “insignificant”.

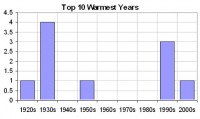
With NASA’s revised data base, 6 of the top 10 warmest years now fall within the span from the 1920s to 1950s, and only 4 in the last two decades.

In the blog we go on to look at a case study, New York’s Central Park. We find very large differences between the raw observed data and the adjusted data sets for the US and global data sets (up to 11F). These kinds of huge variances in the “data” for one location raise serious questions as to whether we can trust any surface station based data set to determine changes the order of a tenth of a degree for climate change assessment and policy prescriptions. See the blog on the SPPI site here.


