


By Jennifer M. Cohen, PhD.
ABSTRACT
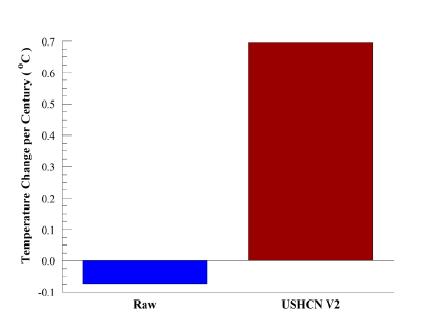
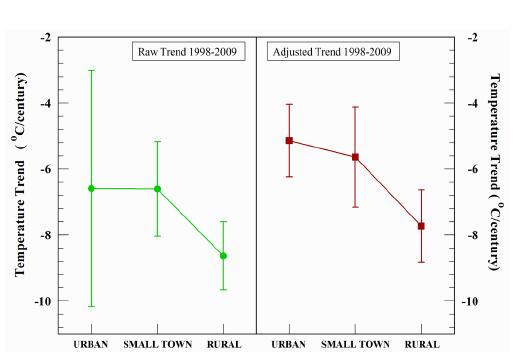
This report compares the raw with the United States Historical Climatology Network Version 2 (USHCN V2) adjusted temperature records for the twenty-four USHCN listed temperature stations in the state of Pennsylvania. Averaging over the twenty-four stations the raw data yielded a small linear decline with temperatures trending -0.1 plus or minus 0.1 C/century, while the U.S. Historical Climatology Network (USCHN) Version 2 adjusted data revealed an increase of 0.7 plus or minus 0.1 C/century. Over the twelve year period 1998-2009 a drop in temperature was observed in both data sets with a raw trend of -0.75 ± 0.1 C/decade and an adjusted trend of -0.65 plus or minus 0.1C/decade.
INTRODUCTION
The USHCN Version 2 (USHCN V2) temperature record adjustment scheme is designed to “reduce uncertainty in temperature trends for the United States”. Raw data are subjected to checks for inconsistencies, such as a daily maximum that is lower than the minimum and errors or a temperature reading that is impossibly high or low. “Time of observation” corrections are introduced which can change the overall temperature trend over time when compared to the raw record. Menne, et al estimate that this yields an increase in the maximum temperature trend of 0.15C per century and an increase in the minimum trend of 0.22C per century. Hence, we anticipate an average increase of about 0.185C per century to be added to whatever trend is found in the average temperature raw data. This is consistent with the USCHN Version 1 (USHCN V1) adjustment method.
An adjustment for updating from liquid in glass (LiG) to the current electronic thermometers results in a further rise in the temperature trend. Temperature stations were updated beginning in the early 1980s. Most were equipped with the electronic versions in the mid-80s, but 10% of the stations were updated after 1994. Approximately 0.52C is added to the raw maximum reading while 0.37C is subtracted from the minimum to account for the electronic readings. Therefore, recent average temperatures are increased by about 0.075C to account for the new equipment which is about 0.025C higher than USHCN V1. We will consider temperature records from 1895 through 2009 and compute temperature trends over a century. This adjustment is expected to add something in the neighborhood of 0.075C per century to whatever trend is seen in the raw data.
Menne, et al combine documented and undocumented changes made after the TOB adjustments in giving their changes to the temperature trends. Their estimate of raising the maximum temperature trend by 0.31C per century, while leaving the minimum temperature trend unchanged, includes the LiG to electronic switchover. These combined changes serve to elevate the average temperature trend by about 0.155C per century. Thus, roughly 0.08C per century is added to the trend due to factors other than switching from LiG to electronic measurement.
Summarizing, we anticipate an upward shift in the average temperature trend of about 0.34C per century. This includes the TOB adjustment increase of 0.185C per century, an increase of 0.075C per century during the LiG to electronic measurement switchover, and a 0.08C per century increase for other documented and undocumented changes.
An important feature of this update involves dropping the Version 1 correction for the Urban Heat Island (UHI) effect in favor of an algorithm that detects undocumented change points. This technique should spot sudden shifts such as undocumented station location and equipment changes. It is less clear how it detects the much slower change in the size of a population center.
The checks and adjustments leave the casual observer to wonder how the raw temperature trends compare with those of the final USHCN V2 product where they live. This survey addresses that question for the state of Pennsylvania.
CALCULATIONS
The temperature records are those available through the online USHCN database. Their locations within Pennsylvania are shown in Fig. 1. Nine of the twenty-four stations had records that ended prior to February of 2010. Data were converted from Fahrenheit to Celsius for this review. No changes were made in the data.
Linear least squares was employed to find the best straight line fit through the data. Our interest is not in the precise average temperature for a given year, but in the temperature trend or slope of the line. Averages of the trends were taken over the twenty-four stations. The raw and USHCN V2 adjusted temperature trends are depicted in Figure. The raw temperature records show a decrease with temperatures trending at a rate of -0.1 plus or minus 0.1 C/century and the USHCN V2 records reveal an increase of 0.7 plus or minus 0.1 C/century (below, enlarged here).

Adjustments have resulted in an increase of about 0.8 C/century. This was higher than the 0.34C per century we had initially anticipated. Since the introduction of the electronic temperature stations likely took place prior to 1995, a second round of data analysis was initiated. This should eliminate or nearly eliminate the LiG to electronic thermometer correction in the temperature trend.
Consider the records for the years from 1998 to 2009, a period during which there may have been a temperature drop. Linear regression was used to determine the best fit linear trend. The sampling error makes it impossible to detect the LiG to electronic thermometer 0.075C uniform shift. However, in this case the temperature trend itself is of interest. During the 1998-2009 time period, a trend toward cooler temperatures was observed for stations in rural, small town, and urban locations (below, enlarged here).
CONCLUSIONS
In the state of Pennsylvania the raw temperature record reveals no significant change in temperature over the period from 1895 to 2009. The USHCN V2 adjusted temperature record shows an increase of less than a degree Celsius over those years. A cooling trend is observed in the raw and USHCN V2 records for the past 12 years. In both the short and longer term cases the USHCN V2 adjusted data yielded trends that were roughly 1C per century higher than those found in the raw temperature records. See full post with individual station plots.