By Joseph D’Aleo, CCM
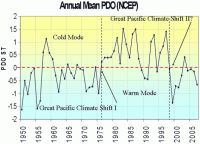
In a recent story we showed how the PDO cycle related to the relative frequency of El Ninos and La Ninas and through that, global temperatures. This is the case because El Ninos lead to global warmth and La Ninas a cooling.

See larger graph here.
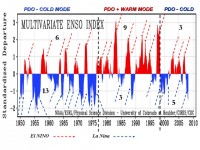
You can clearly see on the chart of Wolter’s Multivariate ENSO Index (explained here) the predisposition for more and stronger La Ninas and fewer weaker El Ninos during the cold phase of the PDO and more and stronger El Ninos and fewer cooler La Ninas.

See larger graph here.
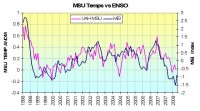
The last decade, we see how well the monthly MEI correlated with the global temperatures. The correlation (Pearson coefficient) is 0.60. There appears to be a lag of a few months from the diagram and indeed if we lag temperatures 3 months to MEI, the correlation jumps to 0.68. Read more here.

See larger graph here.


