by Joseph D’Aleo, CCM, Fellow
The Sun is a variable star with changes in levels of activity including brightness and eruptive activity that varies on periods of 11, 22, 53, 88, 106, 213, and 429 years. Direct and indirect solar factors affect the earth’s temperatures. Some arrogantly discount the importance of the sun in observed global temperature changes, promoting the idea that man is responsible for our climate extremes and variability. Whereas we do have influence on a local and regional basis through urbanization and land use changes, the big global scale changes are natural and ultimately are solar driven.
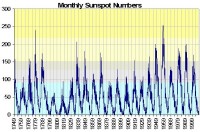
The oldest measure of solar variance is the number of sunspots visible on the sun observed since the days of Galileo and the first telescopes on a daily basis. Sunspots are dark spots (cooler than the photosphere average, which lower irradiance by 0.1%). They are accompanied by bright flares and faculae which are warmer than the average surface (and increase irradiance by 0.2%). The net result of an active sun is that it is a little brighter (0.1%) and thus warmer. The cycles of the monthly sunspot number is quite evident on the following plot with data from NOAA’s National Geophysical Data Center (NGDC).

See larger image here.
The 11 year cycle can be seen to vary in its amplitude and length (in the range from 9-14 years). The longer cycles tend too be associated with and followed by cycles of smaller amplitude. Cycle 23 which peaked in 2000 is ending. But uncharacteristically, cycle 24 has yet to assert itself, although there were a few months back a few small spots with cycle 24 polarity (the polarity reverses across the solar equator and from one cycle to the next (why there is a 22 year cycle).
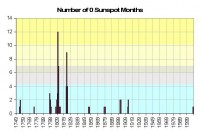
This month (August 2008) has had an international sunspot number of 0 through the reports this morning of the 31th. If that continues the rest of the day, it will mark the first time since 1913, we have had a 0 sunspot calendar month (there have been more 30 day intervals without sunspots as recent as 1954 but they have crossed months). Following is a plot of the number of months with 0 sunspots by year over the period of record - 23 cycles since 1749.

See larger image here.
Note that cluster of zero month years in the early 1800s (a very cold period called the Dalton minimum - at the time of Charles Dickens and snowy London town and including thanks to Tambora, the Year without a Summer 1816) and again to a lesser degree in the early 1900s. These correspond to the 106 and 213 year cycle minimums. This would suggest that the next cycle minimum around 2020 when both cycles are in phase at a minimum could be especially weak. Even David Hathaway of NASA who has been a believer in the cycle 24 peak being strong, thinks the next minimum and cycle 25 maximum could be the weakest in centuries based on slowdown of the plasma conveyor belt on the sun.
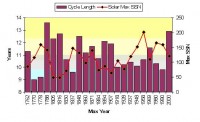
In this plot of the cycle lengths and sunspot number at peak of the cycles, assuming this upcoming cycle will begin in 2009 show the similarity of the recent cycles to cycle numbers 2- 4, two centuries ago preceding the Dalton Minimum. This cycle 23 could end up the longest since cycle 4, which had a similar size peak and also similarly, two prior short cycles.

See larger image here.
See much more in this updated pdf story here.


