By Roy W. Spencer, Ph.D.
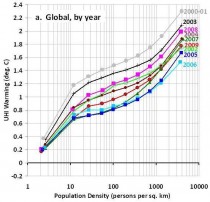
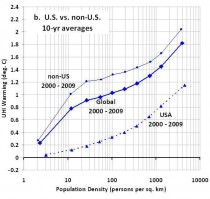
My post from yesterday showed a rather unexpected difference between the United States versus the rest of the world for the average urban heat island (UHI) temperature-population relationship. Updated results shown below have now reduced that discrepancy...but not removed it.
I have now included more station temperature and population data by removing my requirement that two neighboring temperature measurement stations must have similar fractions of water coverage (lakes, coastlines, etc.). The results (shown below, second panel) reveal less of a discrepancy between the U.S. and the rest of the world than in my previous post. The US now shows weak warming at the lowest population densities, rather than cooling as was presented yesterday.
Also, I adjusted the population bin boundaries used for averaging to provide more uniform numbers of station pairs per bin. This has reduced the differences between individual years (top panel), suggesting more robust results. It has also increased the overall UHI warming effect, with about 1.0 deg. C average warming at a population density of 100 persons per sq. km.


See enlarged for both here.
This is an update to my previous post describing a new technique for estimating the average amount of urban heat island (UHI) warming accompanying an increase in population density. The analysis is based upon 4x per day temperature observations in the NOAA International Surface Hourly (ISH) dataset, and on 1 km population density data for the year 2000.
John Christy has agreed to co-author a paper on this new technique, since he has some experience publishing in this area of research (UHI & land use change effects on thermometer data) than me. We have not yet decided what journal to submit to.
--------------------------
On the “march of the thermometers”
By Anthony Watts, Watts Up With That
I’ve been away from WUWT this weekend for recovery from a cold plus family time as we have visitors, so I’m just now getting back to regular posting. Recently on the web there has been a lot of activity and discussions around the issue of the dropping of climatic weather stations aka “the march of the thermometers” as Joe D’Aleo and I reported in this compendium report on issues with surface temperature records.

Most of the station dropout issue covered in that report is based on the hard work of E. M. Smith, aka “chiefio, who has been aggressively working through the data bias issues that develop when thermometers have been dropped from the Global Historical Climate Network. My contribution to the study of the dropout issue was essentially zero, as I focused on contributing what I’ve been studying for the past three years, the USHCN. USHCN has had a few station dropout issues, mostly due to closure, but nothing compared to the magnitude of what has happened in the GHCN.
That said, the GHCN station dropout Smith has been working on is a significant event, going from an inventory of 7000 stations worldwide to about 1000 now, and with lopsided spatial coverage of the globe. According to Smith, there’s also been an affinity for retaining airport stations over other kinds of stations. His count shows 92% of GHCN stations in the USA are sited at airports, with about 41% worldwide.
The dropout issue has been known for quite some time. In this post there is a video that WUWT contributor John Goetz made in March 2008 that shows the global station dropout issue over time. You might want to hit the pause button at time 1:06 to see what recent global inventory looks like.
The question that is being debated is how that dropout affects the outcome of absolutes, averages, and trends. Some say that while the data bias issues show up in absolutes and averaging, it doesn’t effect trends at all when anomaly methods are applied.
Over at Lucia’s Blackboard blog there have been a couple of posts on the issue that raise some questions on methods. I’d like to thank both Lucia Liljegren and Zeke Hausfather for exploring the issue in an “open source” way. All the methods and code used have been posted there at Lucia’s blog which enables a number of people to have a look at and replicate the issue independently. That’s good.
E.M Smith at “chiefio” has completed a very detailed response to the issues raised there and elsewhere. You can read his essay here. His essay is lengthy, I recommend giving yourself more than a few minutes to take it all in. Joe D’Aleo and I will have more to say on this issue also. See post here.
Icecap Note: See also this post here.

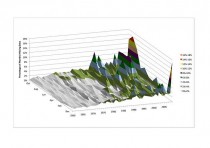
See the number of missing months increase (enlarged here) with a strong bias towards the colder months.
See also this one on Alert station in Canada and GISS.
------------------------
Follow the Money
Enough is enough.
It’s about time that someone once and for all puts the lie to the recurrent charges that the AGW skeptical community is supported by “Big Oil”, or is populated by “flat-earthers”, or by those who in the past have been complicit with “the tobacco lobby”. These transparently pejorative statements are frequent inclusions in postings and commentary by AGW proponents , sometimes by less committed followers of the AGW controversy and even by some posters who are intellectually inclined to side with the skeptics. There are rarely any substantiating statements to support these allegations which in the absence of any formal repudiation by those so categorized, take on a life of their own like so many urban myths that populate the blogosphere.
The facts are that quite the opposite is the case. For example, let’s take “Big Oil”. BP has contributed over $500 Million to UC Berkeley, one of the Bay Area’s centers of AGW support, for its Energy Biosciences Institute.
Stanford University has received $225 Million from ExxonMobil, Toyota and Schlumberger for its Global Climate and Energy Project. That money will be combined with a $50 Million donation from alumnus Jay Precourt whose career as an oil engineer included such companies as Hamilton Oil and Tejas Gas Corp. The new entity will be named the Precourt Center for Energy Efficiency. See here.
Compare these numbers with a total of ~$6.4 Million over a 4-year period between 2002-2005 provided to non-academic and presumably more conservative think tanks by ExxonMobile according to data acquired by EDF (hardly an unbiased source). See here.
As for individuals active in the promotion of AGW, Susan Solomon, a Phd from Stanford and a lead author of the 2007 IPC Report was a recipient of the 2004 Blue Planet Prize, a 50 Million Yen (~$460,000) cash award from the Asahi Glass Foundation , see here. Other high profile figures such as James Hansen and Michael Mann have received six-figure amounts from organizations such as the Theresa Heinz Foundation and the Dan David Foundation. It seems as though being a staunch proponent of AGW is a very rewarding position to have.
These are just a fractional example of the money that has flowed from the private sector to individuals and academic institutions friendly to the notion of anthropogenic influences on the environment. Over the past 10 years Government funding to such organizations has been conservatively estimated at well over $50 Billion.
Compare these enormous sums of money with the amounts that are received by prominent and well qualified members of the skeptical community. I know from personal association that external funding for such sites as WUWT and icecap is in the low five figures and comes almost exclusively from individual donations from those who access these sites. It would seem that the thinly veiled assertions from those expressing an alarmist position that people who adopt a more skeptical attitude are somehow insincere and must be doing it for the money. Since this is patently untrue, I submit that such accusations are more likely to be evidence of projection than of fiscal reality and they are more designed to obfuscate than enlighten the debate.
See more here.


