


By Dr. Roy Spencer
It has been awhile since I provided an update to the global average sea surface temperature plot, shown below through yesterday (March 17, 2011).
As can be seen, SSTs remain below normal. The trend line is close to zero, so still no sign of “global warming” having resumed.
The corresponding water vapor plot (vertically integrated) shows a rather spectacular plunge in recent weeks:
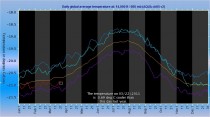
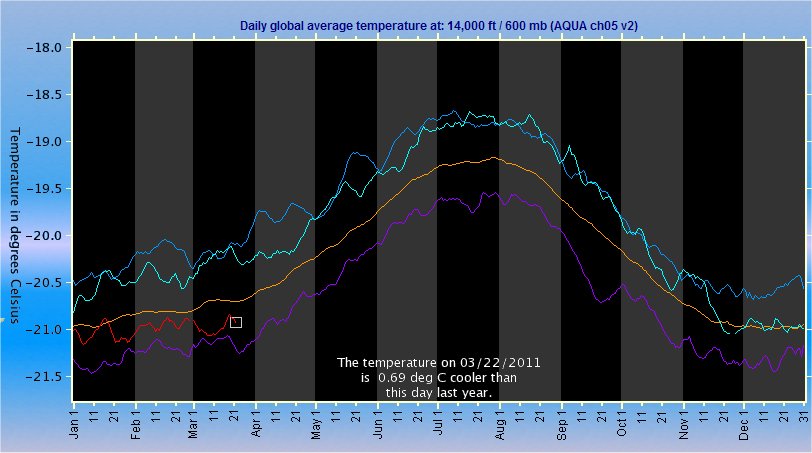
ICECAP NOTE: The UAH Discover temperature tracking tool for the lower troposphere (600mb - above the mixing layer) shows that March 2011 temperatures (red) continues well below normal (yellow) and 0.69C below last year (aqua blue) on March 22. We are flirting with the record low (purple) while last year tangled with the record high (blue) in March. You can track it here. La Ninas tend to be cold and El Ninos warm with a lag of about 7 months. The El Nino of 2009/10 faded in May to La Nina by June/July 2010.
See my post ”Weakening La Nina, Where to from Here” on WeatherBell Analytics.