


By Dr. Richard Keen
OH MANN IS IT EVER GOING TO GET HOT
Although I’ve lived in Colorado for 40+ years, Philadelphia is my ancestral home and I keep track of the weather there. Of course, I’m excited about any event that sets records there, and last week’s heat wave set several. Apparently Michael Mann is excited, too, and in his “Victory and Vindication” interview, he said: “Record heat wave in the US that’s part of a larger picture of early summer temperatures that are the warmest on record, which is part of a larger picture of a globe that is running warmer than ever before...”
So is Philadelphia getting more heat waves? Here’s a chart of annual maximum temperatures for Philadelphia since 1873, when the Weather Bureau installed self-registering max-min thermometers. Earlier records are not comparable, since they are from hourly or 2 p.m. readings, which lead to lower extremes (see enlarged here).
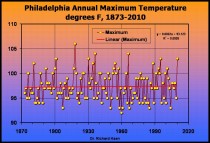
I think the graph speaks for itself - the trend line (plotted in red) is rather flat, with an upward trend of 0.2 degrees F per century. If that continues for another century, the old town will heat up another 0.2 degrees and turn into an inferno. As for the question of more heat waves, before 1942, the mid-point of the data, Philadelphia enjoyed 9 years in which the maximum temperature exceeded 100 degrees. For the second half of the record, since 1942, there were, well, 9 years. Not much of an increase. If that trend continues, I would expect another 9 years with 100+ degree temperatures by 2060.
STANFORD - ANOTHER SOURCE OF HOT AIR CHIMES IN
Oh my God, I’m going to fry!!!
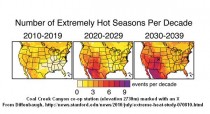
Watt’s up with that posted a prediction by Noah Diffenbaugh at Stanford that heat waves will increase across the U.S. over the next few decades, with the largest increases being in the higher elevations of the Rockies, especially Colorado (figure enlarged here).
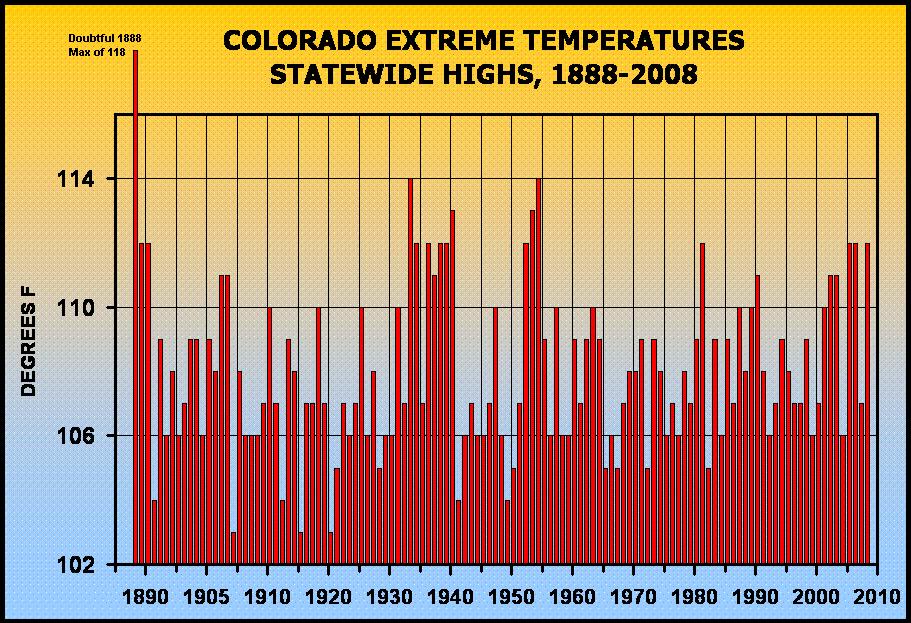
Since I live at 9,000 feet above sea level in central Colorado, I’m terrified! I don’t think I can handle more days over 80F (it’s never reached 90 here). Since CO2 has already increased by 110 ppm, any effects of increasing atmospheric carbon should be noticeable by now. Here’s a chart of the highest temperature recorded in the state of Colorado for each year since 1888 (figure enlarged here).

The hottest recorded in the state is a pretty good indicator of the occurrence of heat waves, and a trend should indicate a change in heat wave frequency. I didn’t want to break the beauty of the graph by plotting the linear trend line, which is essentially horizontal with an upward trend of about 0.5F over the 120 year period. That would indicate little change in the occurrence of extreme heat in Colorado.
Is extreme heat getting more frequent in Colorado? During the first half of the record, from 1888 to 1947, Colorado had 17 years in which some place in the state reached 110F or higher. Since then, there’s been 15 year with 110-degree readings. It appears that Colorado heat waves haven’t gotten the word that they’re supposed to increase with the rising CO2 levels. It also appears that I needn’t worry about a 90-degree day at my weather station for a while (that’s one reason I moved here).
Steve Goddard has a wonderful post on Watt’s Up With That detailing trends (or the lack thereof) in Colorado’s summer climate. He shows high temperatures have been declining in most of Colorado over the last 80 years, as CO2 has gone from 310 to 390 ppm.
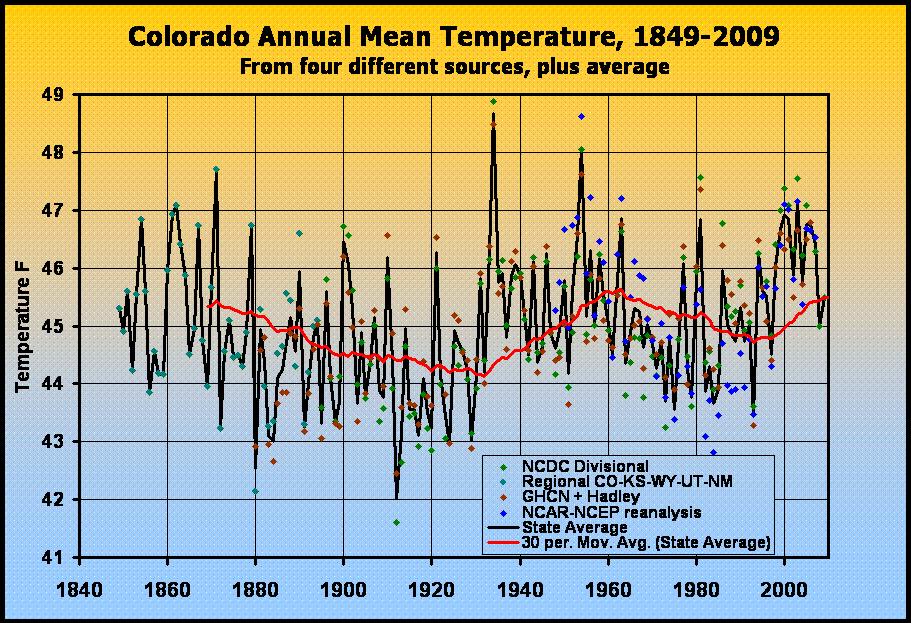
Here’s a broader look at Colorado’s climate - annual statewide mean temperatures for 160 years of record from four sources. The data shown (enlarged here) are:
(1) NCDC combined divisional averages for the state;
(2) USHCN and Hadley CRU gridded values for the Colorado “box” (USHCN and Hadley are so similar they are averaged into one time series);
(3) NCAR-NCEP reanalysis surface temperatures for the Colorado “box”; and
(4) Regional averages from stations in Colorado and neighboring states before 1895, when there were fewer stations in Colorado.
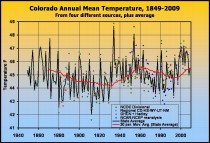
There’s a wealth of information here and many possible interpretations. The 30-year running mean emphasizes the PDO and AMO contributions. Colorado appears to follow neither oceanic oscillation very closely, but rather appears to respond to a mix of both oscillations.
More important is the lack of an overall trend in the temperatures. Colorado is predicted by many models to have the greatest warming of any state in the “lower 48”, but so far this warming is not evident. The warmest 30-year period remains 1933-1963 at 45.6F, 0.1F warmer than the most recent 30 years and 0.3F warmer than the first 30 years (1850-1879). The net warming from 1850-79 to 1980-2009 is all of 0.2F.
Although a warming signal is not evident over the entire record, there has been a warming since 1900 (which is what NCDC and others advertise as evidence of a warming Colorado). Even if one chooses to ignore the cooling after the warm 1860’s and concentrate on the 20th century, the bulk of the warming of that century occurred in a few years around 1930 - a bit early to be due to CO2.
Permalink here. More complete analysis can be found here. Note: RSS feeds now working for all posts(http://icecap.us/index.php/rss).