


Update: See Monckton dismantle college environmentalists and professors at Union College in NYS covered by Anthony here and in video below.
See in this story how the liberal environmental professors afterwards met hurriedly with their brainwashed and shattered students afterwards to try and reclaim their credibility. That’s how the Nazi’s did it.
Also see the aurora from Lapland in this extended video.
Powerful Aurora borealis over Abisko National Park. 03-12-2012 from Lights Over Lapland on Vimeo.
----------------
By Anthony Watts, Watts Up With That
In June 1986, Dr. James Hansen made a prediction to a newspaper reporter in Oxnard, CA of a 2 degree temperature rise by 2006. This was two years before, almost to the day before he and Senator Tim Wirth duped a bunch of Washington legislators with stagecraft on a hot June day by turning off the a/c in the hearing room while complaining about global warming and urging the need for “immediate action” (translation: cash).
Like Dr. Hansen’s 20 year sea level prediction, it hasn’t come true. In honor of the 80s, when a popular TV commercial for a fast food restaurant had inspired a whole nation to say the catch phrase, I ask Dr. James Hansen, regarding your claims of global warming, “Where’s the Beef”?!
Let’s have a look at Exhibit A: Hansens’ GISTEMP graph, distributed worldwide from the GISS headquarters above Jerry Seinfeld’s favorite Monk’s Restaurant in New York City. Annotations in blue mine.
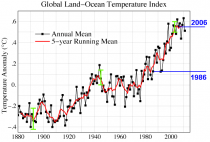
Source.
Exhibit B: The GISS Data, available here. Let’s do the math.
Global Land-Ocean Temperature Index (C)
(Anomaly with Base: 1951-1980)
----------------------------------
Year Annual_Mean 5-year_Mean
----------------------------------
1986 0.13 0.18
1987 0.28 0.20
1988 0.33 0.26
1989 0.21 0.31
1990 0.36 0.28
1991 0.35 0.24
1992 0.13 0.24
1993 0.14 0.25
1994 0.24 0.24
1995 0.39 0.30
1996 0.30 0.39
1997 0.41 0.40
1998 0.58 0.40
1999 0.33 0.43
2000 0.35 0.46
2001 0.48 0.46
2002 0.56 0.49
2003 0.55 0.54
2004 0.48 0.55
2005 0.62 0.56
2006 0.55 0.53
Finding the difference: 0.55C – 0.13C = 0.42C
Predicted change 2.0C compared to Actual change 0.42C = Climate Fail
Exhibit C: Where’s the Beef?!
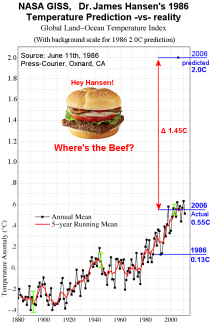
Note: I realize that I could have placed the top prediction at 2.13C, but why pile on? ![]() What’s 0.13C between friends? Besides he said “nearly” and it is near well enough.
What’s 0.13C between friends? Besides he said “nearly” and it is near well enough.
Don’t believe me? Read for yourself. The Press-Courier - Google News Archive Search
Big h/t to Steve Goddard at Real-Science for finding this one.
UPDATE: Some commenters suggested Hansen may have given the 2 degree number in Fahrenheit rather than Celsius. Another article on the same day suggests he did.
So at 4F we have 2.2 C If the reporter in the first story took the middle between 2-4F as 3F we have 1.67C or “nearly 2 degrees higher in 20 years” as the reporter from Oxnard states.
The 2010 Annual Mean Temperature anomaly from GISS is 0.63 C
So, no matter how you look at it, Hansen’s 1986 prediction has not come true.