


By Anthony Watts
I never thought I’d see this from MSNBC. But, here it is, your chance to weigh in. Of course the choices are rather weird, but then so is MSNBC. Make some noise, maybe Olberman will label me as the “worst person in the world”. Heh.
Their question:
Are you satisfied with the British panel’s conclusion that while ‘Climategate’ scientists were not always forthcoming, their science was sound?
Vote here.
---------------
How Unusual the Triple Digit Heat in the Big Apple
By Joseph D’Aleo, CCM
In the amazing winter of 2009/10 when the southeast had the coldest winter since 1977/78 and longest duration of sub 80F days in history, all time record snows fell in the Mid-Atlantic, Europe reported the coldest and snowiest winter in places since 1977/78 or 1962/63, Russia the snowiest and coldest in decades and in Siberia perhaps the coldest winter ever. North China had the coldest weather since 1971/72 with paralyzing snows.
Last winter, Joe Romm and others in the alarmist media angrily argued that the long time or all time record cold and snows in many locations around the Northern Hemisphere was “weather and not climate” and should be ignored. They especially took exception to the cooling might be a sign of things to come. In his typical duplicitous fashion, he on his latest Climate Progress posts is claiming this northeast heat is proof of global warming and signs of things to come. He was joined in this comment by Dr Tom Peterson, the environmental extremist at NCDC who is largely responsible for engineering and justification of the manipulation of NOAA data to enhance apparent warming. Attempts to contact Hansen and Schmidt at NASA GISS for comment were unsuccessful (busy taking language courses in Arabic?).
First of all, the heat is concentrated in the northeast with much of the rest of the country more normal.
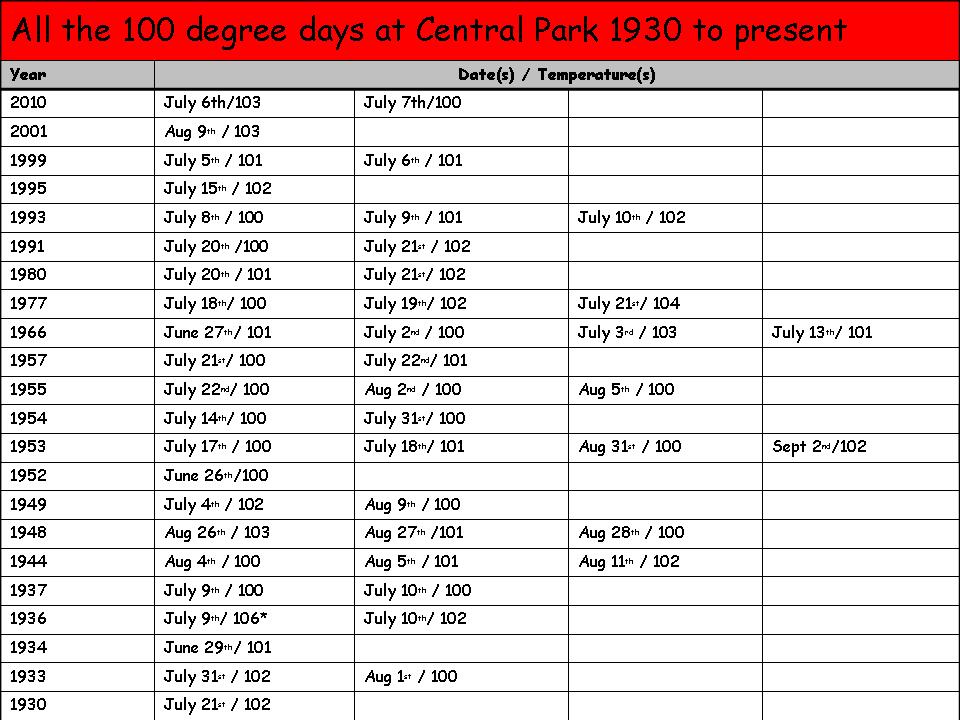
How unusual is 100F heat in New York City? It doesn’t happen every year, but it is not unprecedented. This past winter was an El Nino winter and developing La Nina summers following El Nino winters tend to be hot. Below is a table of 100F days in Central Park, New York City since 1930 (enlarged here).

We may touch 100F again today in Central Park. The heat will slowly fade as the winds turn moren onshore in the northeast and moisture and clouds increase. Eventually a cold front with showers and storm will restore more normal readings by and during this weekend. More heat surges may follow this summer, until enough rains come (perhaps with tropical systems).
By the way, any blackouts can be considered signs of our future given the misguided green agenda. We are not building the energy infrastructure to meet growing needs especially in times of stress. As they found in Europe, wind and solar did not save any energy (active backup generation was needed) and wind was not there when needed the most on the coldest or hottest days.
-----------------
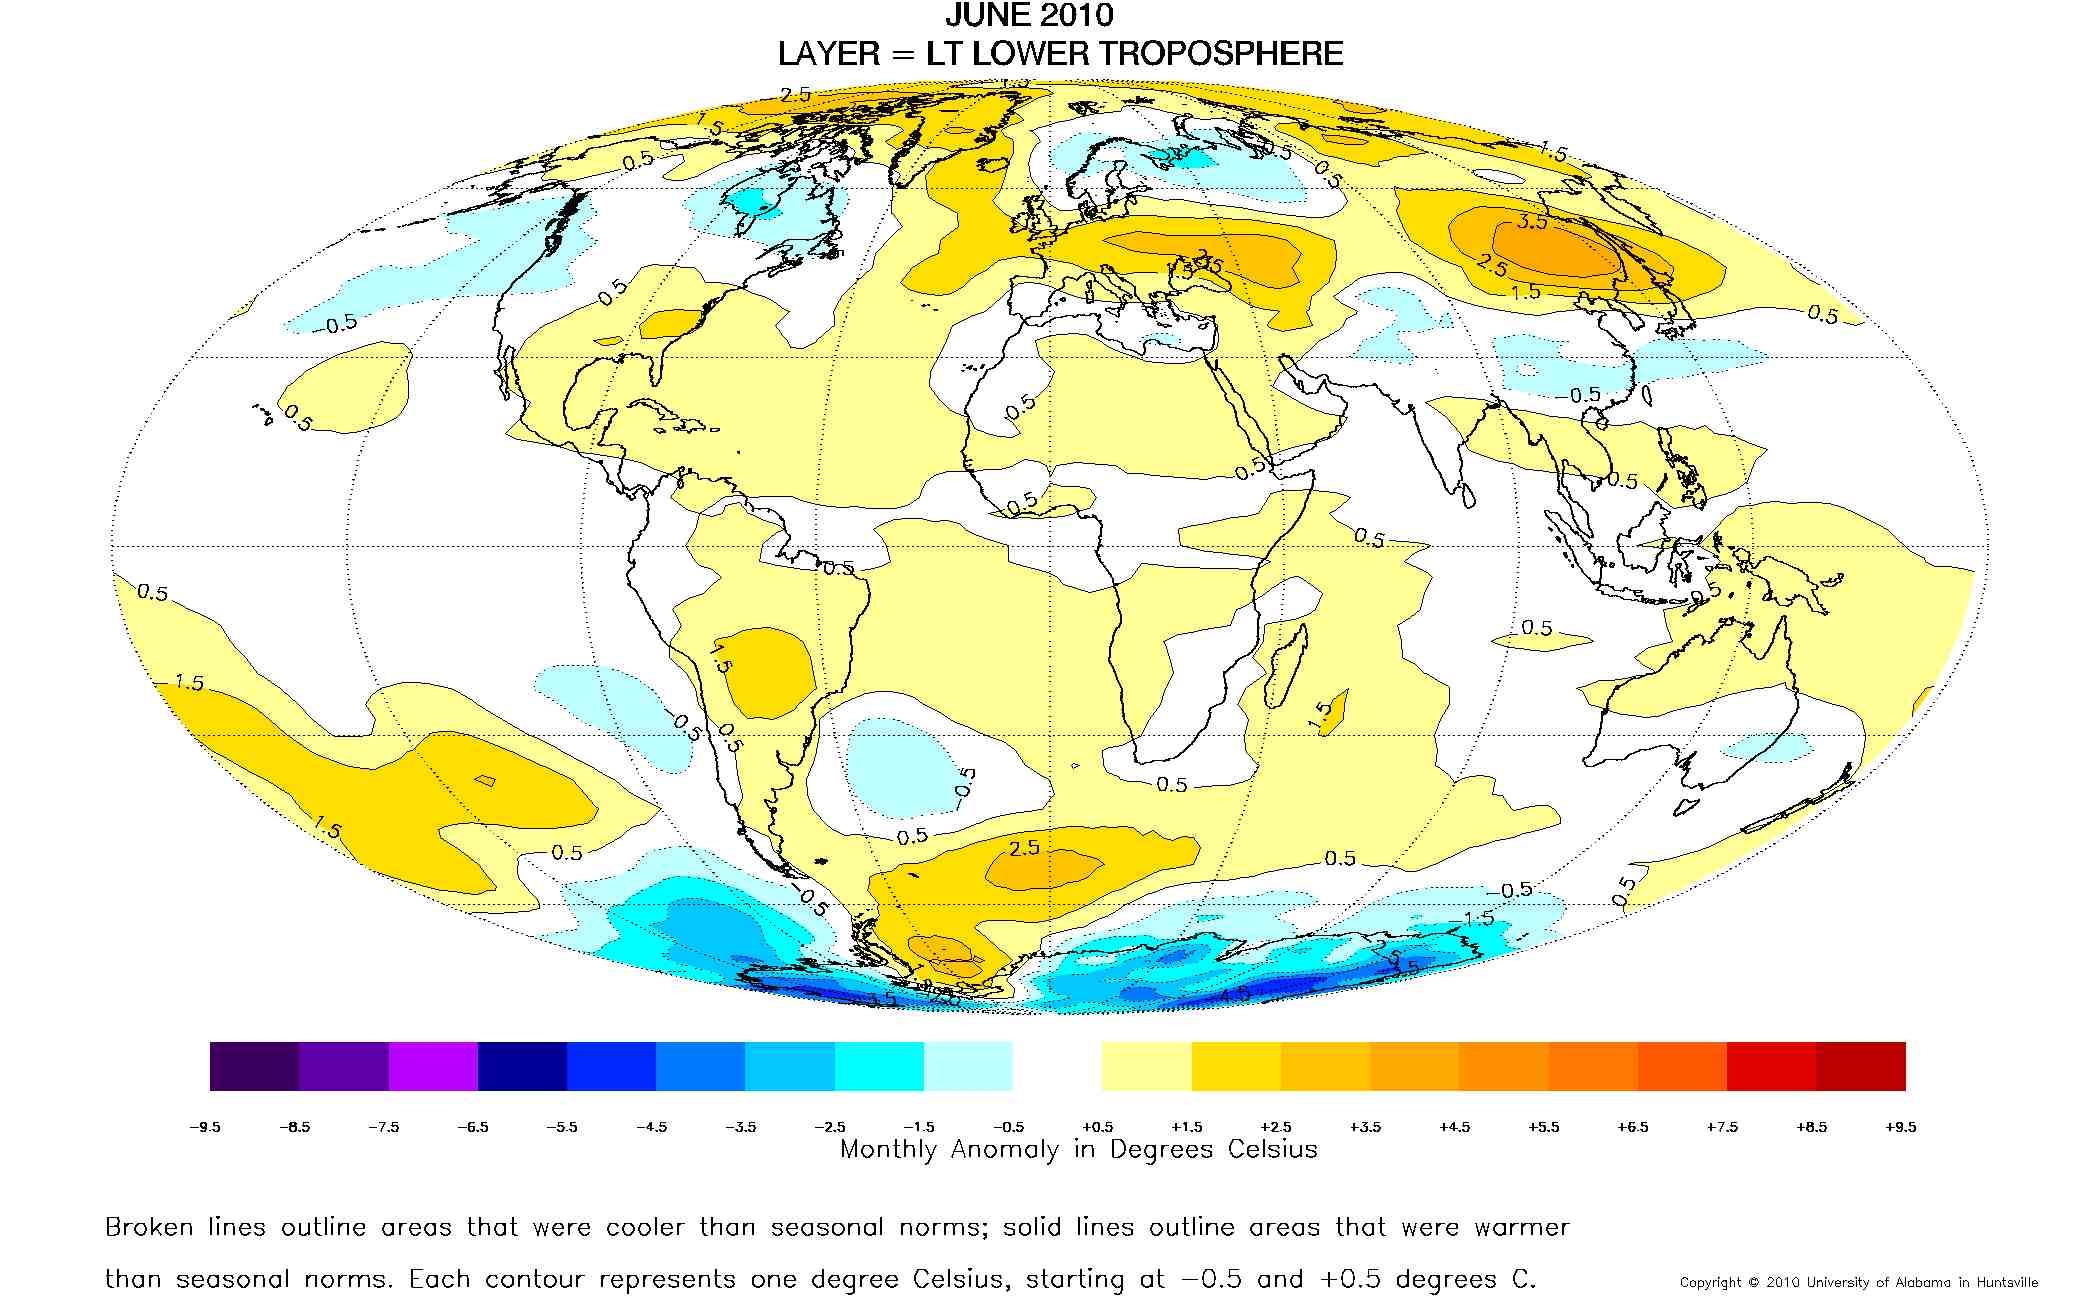
June 2010 UAH Global Temperature Update: +0.44 deg. C
By Dr. Roy Spencer

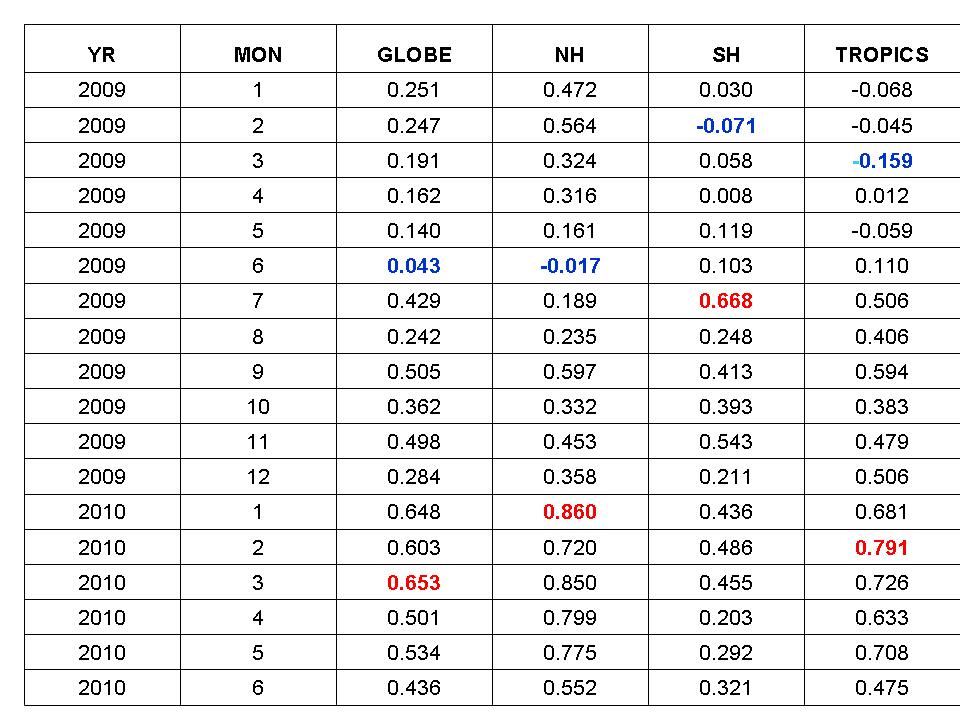
The monthly global, hemispheric and tropical anomalies are shown for 2009 through June 2010 enlarged here.
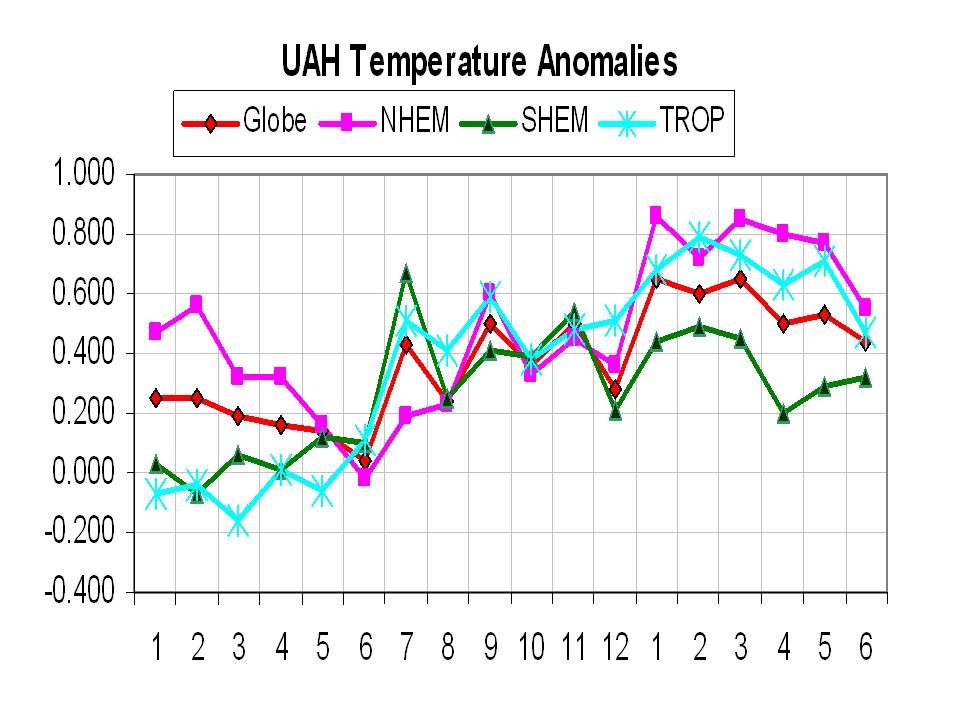
Plotted below (enlarged here).
The global-average lower tropospheric temperature remains warm, +0.44 deg. C for June, 2010, but it appears the El Nino warmth is waning as a La Nina approaches (enlarged here.)
For those keeping track of whether 2010 ends up being a record warm year, 1998 still leads with the daily average for 1 Jan to 30 June being +0.64 C in 1998 compared with +0.56 C for 2010. (John Christy says that the difference is not statistically significant.) As of 30 June 2010, there have been 181 days in the year. From our calibrated daily data, we find that 1998 was warmer than 2010 on 122 (two-thirds) of them.
Enlarged here.
As a reminder, four months ago we changed to Version 5.3 of our dataset, which accounts for the mismatch between the average seasonal cycle produced by the older MSU and the newer AMSU instruments. This affects the value of the individual monthly departures, but does not affect the year to year variations, and thus the overall trend remains the same as in Version 5.2. ALSO...we have added the NOAA-18 AMSU to the data processing in v5.3, which provides data since June of 2005. The local observation time of NOAA-18 (now close to 2 p.m., ascending node) is similar to that of NASA’s Aqua satellite (about 1:30 p.m.). The temperature anomalies listed above have changed somewhat as a result of adding NOAA-18.
[NOTE: These satellite measurements are not calibrated to surface thermometer data in any way, but instead use on-board redundant precision platinum resistance thermometers (PRTs) carried on the satellite radiometers. The PRT’s are individually calibrated in a laboratory before being installed in the instruments.]
See post here.